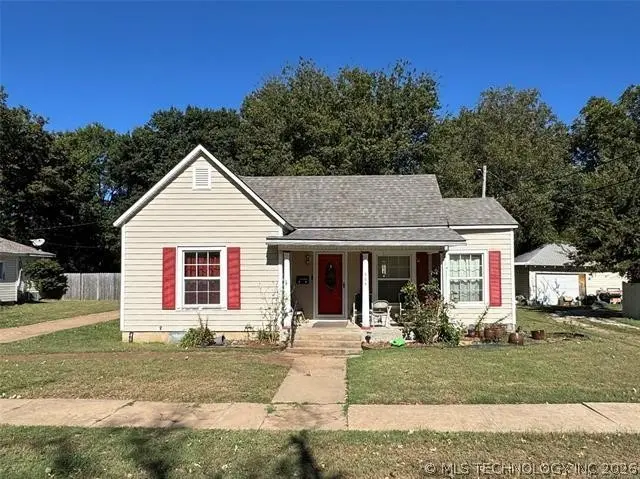
505 W Pawnee St · Cleveland, OK
Flood risk 1/10 · Minimal
- FEMA flood zone
- —
- Chance of flooding over 30 yrs
- 0.0%
- Est. flood insurance / yr
- —
Fire risk 6/10 · Moderate
- Est. fire insurance / yr
- $2,463 – $4,575
Heat risk 6/10 · Moderate
- Hot days now (above 110°F)
- 7 days/yr
- Hot days in 30 yrs
- 20 days/yr
Wind risk 2/10 · Minimal
- Chance of severe wind over 30 yrs
- 4.0%
Air-quality risk 2/10 · Minimal
- Unhealthy air days now
- 0 days/yr
- Unhealthy air days in 30 yrs
- 1 days/yr
Risk factors via First Street. Map © Google.
Why this score? — see what drove the A- grade
The composite is a weighted blend of 9 inputs, each scored 0–100. Each bar is that input's sub-score; the figure is the points it added to the 100-point composite (weight × sub-score).
- Cash flow +30.0/30.0
- ARV discount +15.0/15.0
- DSCR +10.0/10.0
- Appreciation +10.0/10.0
- 1% rule +9.6/10.0
- Livability +3.4/5.0
- Rent growth +2.5/5.0
- Condition / age +2.5/5.0
- Schools +1.8/10.0
$115,000
🖨 Deal sheet 📄 Offer letter ✓ Due diligence
Listing remarks
No Money Down with USDA Financing! Adorable Home in the Heart of Town This charming residence offers a welcoming blend of comfort and convenience, ideally situated in a central location. Key Features Bedrooms/Bathroom: 3 beds, 1 bath Living & dining: Cozy living room; spacious dining area for gatherings Kitchen: Large, well-appointed kitchen ready for culinary creativity Garage/Workshop: Attached garage with a versatile workshop space HVAC system and hot water heater are relatively new Roof replaced within the last 3 years Why You’ll Love It: Perfect for first-time buyers seeking affordable, move-in-ready living Attractive option for investors looking for a solid
Key facts
- Attached garage
- New hot water heater
- Roof replaced
Tags
Property features AI
Exterior
- Parking: Attached garage (1 car) with side-facing garage
- Security: No safety shelter
- Utilities: Electricity available; Natural gas available; Public water; Public sewer
- Home design: Single-story; Faces south; Entry/foundation: crawlspace
- Construction: Built with vinyl siding and wood frame; Asphalt/fiberglass roof
- Exterior features: Covered porch
Interior
- Kitchen: Oven; Range; Stove
- Bedrooms: Bedroom count not provided
- Flooring: Carpet
- Bathrooms: 1 full bathroom
- Heating & cooling: Central heating (gas); Central air conditioning
- Interior features: Laminate countertops; Electric oven & range connections; Vinyl windows; No additional interior features listed
- Laundry & utility: Washer hookup; Gas water heater
Neighborhood map
What this means for you Summary
Snapshot
- This is a 3-bed/1.0-bath single-family listed at $115k.
Deal economics
- At list price, monthly cash flow is $634 ($8k/yr) — positive.
- The deal already cash-flows at list — no discount required.
- Meets the 1% rule at list price ($2k rent vs $115k).
- Recommended offer: $108k (6.0% below list) — sets the bar for market timing.
- Cap rate 12.9% vs local median 6.4% in Cleveland — top-decile yield for the area; either an underpriced asset or a hidden risk that comps aren't pricing in. Stress-test before assuming the spread holds.
Location & tenants
- Location reads 67/100 on livability (#93 in OK) — a middle-class / working-renter tenant base. Strengths: cost of living A+, housing A+; Watch: crime C-, employment C-, schools D-.
- Cleveland (town): math 21% / reading 19% proficiency, ranked #169 of 270 in OK (top 63%) — low school quality limits family demand, transient renter base, plan for 1-2y turnover.
- Market conditions: 86 active listings in the ZIP; 3 units permitted in Pawnee County in 2024 (0 in 5+ unit buildings).
Forward outlook
- In year one you build about $12k of equity ($795 loan paydown + $12k appreciation (10.0% local appreciation)).
- Pawnee County population projected to shrink 4% by 2050 — rents likely to lag national; underwrite the cash flow, not the appreciation.
- At projected returns (10.0% appreciation + 3.0% rent growth), your $32k cash investment doubles in ~2 years — after that, you're playing with house money.
- By year 3, paydown + projected appreciation supports a ~$31k cash-out refi (75% LTV) — recoverable capital for the next deal without selling this one.
Negotiation context
- It's been on market 78 days — a 6% lower offer ($108k) is reasonable based on typical stale-listing flexibility.
- 2 sale attempts with the ask held roughly flat each time — persistent listings suggest the price (not the market) is what's stuck; bring a comps-based counter.
- Current owner paid $35k; list at $115k implies a 229% gain — meaningful room to come down on a strong offer.
Risks & watch-outs
- Watch-outs: built in 1918 — expect roof / HVAC / electrical / plumbing capex.
- Climate carrying-cost: major wildfire risk; extreme-heat days projected 7→20/yr by 2055 (HVAC capex compounding) — expect insurance premiums to compound above CPI over the hold.
Questions for the listing agent
- It's been on market 78 days. Have you received any prior offers? Is the seller open to a 6% concession, seller financing, or rate buy-down credit?
- Built in 1918 — when were the roof, HVAC, electrical panel, plumbing, and water heater last replaced?
- Why hasn't it sold? Are there any deal-killer items the seller is aware of (foundation, flood, title, zoning, code violations)?
- Is there a deadline driving the sale (1031 exchange, divorce, estate, relocation)? That informs how much negotiation room exists.
- Schools are D-rated, which usually means shorter tenancies and higher turnover. Who's the typical renter profile here, and what's been the actual vacancy rate?
- What's the average days-on-market for RENTAL listings here right now (not sales)? A rising rental-DOM trend means longer vacancies and softer asking-rent achievability than the comps imply.
- What's the recent tenant-quality profile in this submarket — average credit score on applications, eviction rate, late-payment / NSF rate, and stable-employment percentage? A property-management company in the area should have these aggregated.
- How much new for-sale + rental construction is in the pipeline within 1–3 miles? Heavy new supply typically softens prices + rents 12–24 months out; constrained supply supports both.
Investment metrics
- 1% rule
- 1.46% ✓
- Cap rate
- 12.91%
- Cash-on-cash
- 23.64%
- DSCR
- 2.05
- GRM
- 5.7
CMA / ARV
- ARV (on-the-fly)
- $180,960
- Comps found
- 12
Show comp detail 12 sales within ~0.75 mi
| Address | Dist | Beds/Ba | Sqft | Sold | Price | $/sf | Match |
|---|---|---|---|---|---|---|---|
| 305 N 7th Ave | 0.19mi | 3/2.0 | 1,560 (0%) | 3mo | $178,000 | $114 | 85 |
| 413 W Pogue St | 0.40mi | 3/2.0 | 1,432 (-8%) | 0mo | $170,000 | $119 | 63 |
| 709 N D Ave | 0.39mi | 3/2.0 | 1,476 (-5%) | 7mo | $155,000 | $105 | 63 |
| 208 N Swan | 0.54mi | 3/1.0 | 1,598 (+2%) | 10mo | $155,000 | $97 | 63 |
| 606 N B Ave | 0.36mi | 3/1.0 | 1,360 (-13%) | 1mo | $138,500 | $102 | 61 |
| 1301 Jodebo St | 0.52mi | 3/2.0 | 1,647 (+6%) | 2mo | $136,000 | $83 | 61 |
| 703 N D Ave | 0.35mi | 3/1.5 | 1,360 (-13%) | 2mo | $168,000 | $124 | 58 |
| 1004 W Pawnee St | 0.35mi | 3/2.0 | 1,368 (-12%) | 3mo | $165,000 | $121 | 57 |
| 634 Hickory Dr | 0.56mi | 3/2.0 | 1,476 (-5%) | 8mo | $195,000 | $132 | 54 |
| 200 S Division St | 0.29mi | 2/1.0 (-1) | 1,380 (-12%) | 12mo | $129,900 | $94 | 52 |
| 202 W Ponca Ave | 0.50mi | 3/2.0 | 1,398 (-10%) | 6mo | $247,000 | $177 | 50 |
| 200 S Vine Ave | 0.55mi | 4/1.5 (+1) | 1,714 (+10%) | 11mo | $198,000 | $116 | 42 |
Match score weights: distance 35% · size 25% · config 20% · recency 20%. Top-matched comps best support the ARV.
Projected returns pro-forma
10.0% appreciation · 3.0% rent growth · sell at horizon
- IRR
- 42.0%
- Equity multiple
- 4.20×
- Total profit
- $103,005
- Equity at exit
- $103,601
- IRR
- 36.3%
- Equity multiple
- 9.43×
- Total profit
- $271,487
- Equity at exit
- $223,420
Cash invested: $32,200 (down + closing). Projections, not guarantees.
Landlord ↔ Tenant lean methodology
- Overall (STATE)
- 83 Strongly Landlord-Friendly
- State Oklahoma
- 83 Strongly Landlord-Friendly · R+20
- County
- — inherits STATE
- City
- — inherits STATE
ZIP-level market 74020
- Home prices YoY
- 6.9%
- Active inventory
- 86
- Price-to-rent
- 5.7×
Monthly cashflow live
- Estimated rent
- $1,684 medium interval (Pro) →
- Mortgage (P&I)
- −$603
- Tax from tax record
- −$45 /mo · $541/yr
- Insurance
- −$48
- HOA
- −$0
- Vacancy / Maint / Mgmt
- −$354
- Net cashflow
- $634
Break-even live
UW: 25.0% down · 7.5% · 30yr · 1.5% tax · 5.0% vac · 8.0% maint · 8.0% mgmt
Financing live
Cash to close
- Down payment
- $28,750
- Closing costs
- $3,450
- Reserves months
- —
- Total cash needed
- —
Loan-product check · same deal, 3 products live
Conventional
25% down · 7.5% · 30yr
- Down + closing
- —
- Monthly P&I
- —
- Monthly cashflow
- —
- DSCR
- —
- Eligible?
- —
Personal DTI + credit; lowest rate.
DSCR
20% down · 8.5% · 30yr
- Down + closing
- —
- Monthly P&I
- —
- Monthly cashflow
- —
- DSCR
- —
- Eligible?
- —
No personal income docs; deal must DSCR.
Hard money
10% down · 12.0% · 12mo
- Down + closing
- —
- Monthly P&I
- —
- Monthly cashflow
- —
- DSCR
- —
- Eligible?
- —
Short-term bridge; refi at stabilization.
Listing history 18 events
-
2026-06-18days on market $115,000 Active 78 DOM
-
2026-06-17days on market $115,000 Active 77 DOM
-
2026-06-16days on market $115,000 Active 76 DOM
-
2026-06-15days on market $115,000 Active 75 DOM
-
2026-06-13days on market $115,000 Active 73 DOM
-
2026-06-10days on market $115,000 Active 70 DOM
-
2026-06-09days on market $115,000 Active 69 DOM
-
2026-06-08days on market $115,000 Active 68 DOM
-
2026-06-07days on market $115,000 Active 67 DOM
-
2026-06-03days on market $115,000 Active 63 DOM
-
2026-06-02days on market $115,000 Active 62 DOM
-
2026-06-01days on market $115,000 Active 61 DOM
-
2026-05-31days on market $115,000 Active 60 DOM
-
2026-04-01$115,000 Active
-
2026-03-27historical
-
2026-02-02price $115,000
-
2025-10-02$129,000 Active
-
2004-04-30soldstatus $35,000
ⓘ Source: listings_history table (triggers on properties + properties_extension) + one-shot
backfill from property_details.listing_events for pre-trigger history.
Tax reassessment forecast OK · Resets to sale price
- Current annual tax
- $541 · $45/mo
- Projected year-2 tax
- $1,035 · $86/mo
- Expected delta
- +$494/yr (+$41/mo · 91.3%)
ⓘ Screening estimate from a state-policy table — verify with the county assessor before closing.
Climate risk First Street
- Flood 1/10 Low 0% chance over 30 yrs
- Wildfire 6/10 Major
- Heat 6/10 Major 7 d/yr ≥110°F today · 20 d/yr by 30 yrs out
- Wind 2/10 Low 4% chance of damaging wind over 30 yrs
- Air quality 2/10 Low 0 unhealthy d/yr today · 1 by 30 yrs out
Nearby sold comps map
Loading sold comps map…
Walkable amenities ~0.75 mi
Loading nearby amenities…
Taxation est. · year 1
- Rental income
- $20,211
- − Mortgage interest
- −$6,442
- − Property taxes
- −$541
- − Insurance
- −$575
- − Repairs & maintenance
- −$1,617
- − Management
- −$1,617
- − Depreciation
- −$3,345
- Taxable income
- $6,074
- Est. tax owed @ 24.0%
- −$1,458
- After-tax cash flow
- $6,156/yr
For passive investors: Depreciation is non-cash, so a rental often shows a tax loss while cash-flowing — sheltering income. Rental losses are passive: they offset passive income freely, and up to $25,000/yr can offset ordinary (W-2) income if you actively participate and your MAGI is under $100k (phasing out to $0 by $150k); unused losses carry forward. On sale, claimed depreciation is recaptured at up to 25%, and gains may owe capital-gains tax (a 1031 exchange can defer both). Figures are a year-1 estimate at your 24.0% rate — not tax advice; consult a CPA.
Schools (NCES district)
- District
- Cleveland
- NCES district ID
- 4008040
- Math proficiency
- 21% ▼ -6.00%
- Reading proficiency
- 19% ▼ -11.00%
- Median HH income
- $45,642
- Composite
- 17.52/100
- National rank
- #9049
- State rank
- #169 of 270 in OK
Livability — Cleveland
- Score
- 67/100
- State rank
- #93
- US rank
- #10844
Category grades
Schools grade is shown separately in the Schools card above.
Census & demographics
- Census place
- Cleveland, OK
- Population (ZIP)
- 7,365
Population outlook (Pawnee County) Hauer SSP2
- Today (2025)
- 16,219 people
- By 2030
- 16,028 · -1.2%
- By 2040
- 15,724 · -3.1%
- By 2050
- 15,563 · -4.0%
- By 2075
- 15,905 · -1.9%
- By 2100
- 16,058 · -1.0%
Race, ethnicity, and origin ACS 2023
- Neighborhood character
- Predominantly White (77%)
- Race & ethnicity
- White 77% Two or more races 12% Native American 6% Hispanic / Latino 4% Black 1%
- Common ancestry
- Slovak 2% Lithuanian 2% Iranian 1%
- Foreign-born
- 1% · Canada
- Languages at home
- 96% English-only · Spanish 2% Other Asian/Pacific 1%
Political lean MEDSL · Pawnee
- 2024 margin
- Solid R (+58.9) · D 19.7% · R 78.6% · Other 1.7%
- 2008→2024 swing
- -21.4pp toward R · 2008: -37.4pp · 2024: -58.9pp
- All cycles
- 2024: R+58.9 2020: R+57.5 2016: R+53.2 2012: R+40.0 2008: R+37.4
Not yet ingested
- Civics
- —
Market trends
- HPI YoY
- ▲ 14.01%
- Current HPI
- 218.04
- Rent YoY
- —
- Metro
- —
- State GDP YoY
- ▲ 1.55%
- F500 in state
- 6
Industry mix (Fortune 500 HQ in OK)
| Industry | F500 HQs | Revenue |
|---|---|---|
| Energy | 3 | $48B |
|
||
Price history
+228.6% since first listed5 events — show timeline
- 2026-04-01 Listed $115,000 MLS Technology, Inc.
- 2026-03-27 Listing Removed — MLS Technology, Inc.
- 2026-02-02 Price Changed $115,000 MLS Technology, Inc.
- 2025-10-02 Listed $129,000 MLS Technology, Inc.
- 2004-04-30 Sold (Public Records) $35,000 Public Records
Cash-flow waterfall
monthlySold comps — $/sqft
last 12 mo · ≤1 miLoading sold comps…