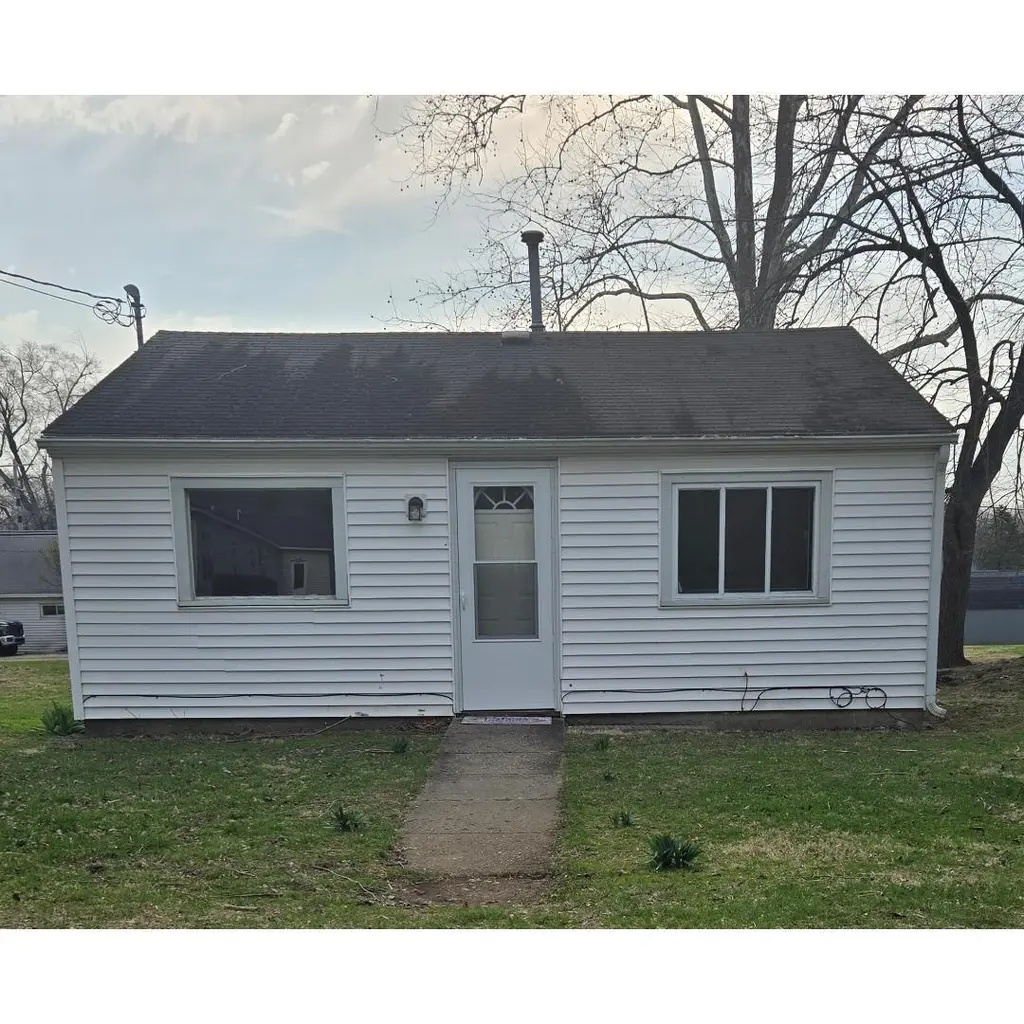
103 Market St. St · Williamsport, IN
Flood risk 1/10 · Minimal
- FEMA flood zone
- X (unshaded)
- Chance of flooding over 30 yrs
- 0.0%
- Est. flood insurance / yr
- $507 – $1,088
Fire risk 1/10 · Minimal
- Est. fire insurance / yr
- $717 – $1,331
Heat risk 3/10 · Minor
- Hot days now (above 103°F)
- 7 days/yr
- Hot days in 30 yrs
- 18 days/yr
Wind risk 2/10 · Minimal
- Chance of severe wind over 30 yrs
- —
Air-quality risk 3/10 · Minor
- Unhealthy air days now
- 2 days/yr
- Unhealthy air days in 30 yrs
- 4 days/yr
Risk factors via First Street. Map © Google.
Why this score? — see what drove the B- grade
The composite is a weighted blend of 9 inputs, each scored 0–100. Each bar is that input's sub-score; the figure is the points it added to the 100-point composite (weight × sub-score).
- Cash flow +25.2/30.0
- Appreciation +8.4/10.0
- DSCR +8.3/10.0
- ARV discount +7.5/15.0
- 1% rule +5.7/10.0
- Schools +5.0/10.0
- Livability +3.8/5.0
- Rent growth +2.5/5.0
- Condition / age +2.5/5.0
$74,900
🖨 Deal sheet 📄 Offer letter ✓ Due diligence
Listing remarks MLS
Charming 576 sq. ft. cottage offering a fantastic opportunity for a savvy investor or DIY enthusiast! This cozy home sits on a deep lot featuring a large, level backyard—perfect for gardening, a fire pit, or even future expansion. With some thoughtful updates and a little vision, you can easily polish this gem to its full potential. Whether you're looking for a manageable rental or a tiny-home retreat, this value-add property is a must-see.
Key facts
- Future expansion
- Deep lot
- Large level backyard
Tags
Neighborhood map
What this means for you Summary
Snapshot
- This is a 1-bed/1.0-bath single-family listed at $75k.
Deal economics
- At list price, monthly cash flow is $168 ($2k/yr) — positive.
- The deal already cash-flows at list — no discount required.
- Meets the 1% rule at list price ($799 rent vs $75k).
- Recommended offer: $73k (3.0% below list) — sets the bar for market timing.
Location & tenants
- Location reads 75/100 on livability (#59 in IN, #4,014 nationally) — a middle-class / working-renter tenant base. Strengths: crime A+, cost of living A+, housing A+; Watch: employment C-, schools D+, amenities F.
- Market conditions: 1 comparable units currently listed for rent nearby; 27 units permitted in Warren County in 2024 (0 in 5+ unit buildings).
Forward outlook
- In year one you build about $6k of equity ($518 loan paydown + $5k appreciation (6.8% local appreciation)).
- Warren County population projected at -24% by 2050 — secular population decline; favor cash flow + early exit over multi-decade hold.
- At projected returns (6.8% appreciation + 3.0% rent growth), your $21k cash investment doubles in ~3 years — after that, you're playing with house money.
- By year 6, paydown + projected appreciation supports a ~$31k cash-out refi (75% LTV) — recoverable capital for the next deal without selling this one.
Negotiation context
- It's been on market 51 days — a 3% lower offer ($73k) is reasonable based on typical stale-listing flexibility.
- 2 sale attempts with the ask held roughly flat each time — persistent listings suggest the price (not the market) is what's stuck; bring a comps-based counter.
Risks & watch-outs
- Watch-outs: built in 1956 — expect roof / HVAC / electrical / plumbing capex.
Questions for the listing agent
- It's been on market 51 days. Have you received any prior offers? Is the seller open to a 3% concession, seller financing, or rate buy-down credit?
- Built in 1956 — when were the roof, HVAC, electrical panel, plumbing, and water heater last replaced?
- Is there a deadline driving the sale (1031 exchange, divorce, estate, relocation)? That informs how much negotiation room exists.
- Schools are D-rated, which usually means shorter tenancies and higher turnover. Who's the typical renter profile here, and what's been the actual vacancy rate?
- What's the average days-on-market for RENTAL listings here right now (not sales)? A rising rental-DOM trend means longer vacancies and softer asking-rent achievability than the comps imply.
- What's the recent tenant-quality profile in this submarket — average credit score on applications, eviction rate, late-payment / NSF rate, and stable-employment percentage? A property-management company in the area should have these aggregated.
- How much new for-sale + rental construction is in the pipeline within 1–3 miles? Heavy new supply typically softens prices + rents 12–24 months out; constrained supply supports both.
Investment metrics
- 1% rule
- 1.07% ✓
- Cap rate
- 8.98%
- Cash-on-cash
- 9.60%
- DSCR
- 1.43
- GRM
- 7.8
CMA / ARV
- ARV (median comp)
- $220,000
- List price
- $74,900
- Delta
- 18.14%
- Verdict
- OVERPRICED
- Comps
- 11 within 1.0 mi
Show comp detail 1 sale within ~0.75 mi
| Address | Dist | Beds/Ba | Sqft | Sold | Price | $/sf | Match |
|---|---|---|---|---|---|---|---|
| 103 Market St. St | 0.00mi | 1/1.0 | 576 (0%) | 1mo | $70,000 | $122 | 99 |
Match score weights: distance 35% · size 25% · config 20% · recency 20%. Top-matched comps best support the ARV.
Projected returns pro-forma
6.84% appreciation · 3.0% rent growth · sell at horizon
- IRR
- 25.0%
- Equity multiple
- 2.72×
- Total profit
- $36,061
- Equity at exit
- $51,097
- IRR
- 23.1%
- Equity multiple
- 5.62×
- Total profit
- $96,863
- Equity at exit
- $96,338
Cash invested: $20,972 (down + closing). Projections, not guarantees.
Landlord ↔ Tenant lean methodology
- Overall (STATE)
- 90 Strongly Landlord-Friendly
- State Indiana
- 90 Strongly Landlord-Friendly · R+11
- County
- — inherits STATE
- City
- — inherits STATE
ZIP-level market 47993
- Home prices YoY
- 2.9%
- Price-to-rent
- 7.8×
Monthly cashflow live
- Estimated rent
- $799 medium interval (Pro) →
- Mortgage (P&I)
- −$393
- Tax from tax record
- −$39 /mo · $473/yr
- Insurance
- −$31
- HOA
- −$0
- Vacancy / Maint / Mgmt
- −$168
- Net cashflow
- $168
Break-even live
UW: 25.0% down · 7.5% · 30yr · 1.5% tax · 5.0% vac · 8.0% maint · 8.0% mgmt
Financing live
Cash to close
- Down payment
- $18,725
- Closing costs
- $2,247
- Reserves months
- —
- Total cash needed
- —
Loan-product check · same deal, 3 products live
Conventional
25% down · 7.5% · 30yr
- Down + closing
- —
- Monthly P&I
- —
- Monthly cashflow
- —
- DSCR
- —
- Eligible?
- —
Personal DTI + credit; lowest rate.
DSCR
20% down · 8.5% · 30yr
- Down + closing
- —
- Monthly P&I
- —
- Monthly cashflow
- —
- DSCR
- —
- Eligible?
- —
No personal income docs; deal must DSCR.
Hard money
10% down · 12.0% · 12mo
- Down + closing
- —
- Monthly P&I
- —
- Monthly cashflow
- —
- DSCR
- —
- Eligible?
- —
Short-term bridge; refi at stabilization.
Rent comps 1 comps
| Address | Beds | Baths | Sqft | Rent | $/sqft | DOM | Units | Dist |
|---|---|---|---|---|---|---|---|---|
| 114 Brown St Williamsport, IN | 2.0 | 1.0 | 721 | $799 | $1.11 | 13d | 1 | 1.33mi |
Listing history 3 events
-
2026-05-13status Pending 450-char remark
Show marketing remark (450 chars)
Charming 576 sq. ft. cottage offering a fantastic opportunity for a savvy investor or DIY enthusiast! This cozy home sits on a deep lot featuring a large, level backyard—perfect for gardening, a fire pit, or even future expansion. With some thoughtful updates and a little vision, you can easily polish this gem to its full potential. Whether you're looking for a manageable rental or a tiny-home retreat, this value-add property is a must-see.
-
2026-03-23$74,900 Active 450-char remark
Show marketing remark (450 chars)
Charming 576 sq. ft. cottage offering a fantastic opportunity for a savvy investor or DIY enthusiast! This cozy home sits on a deep lot featuring a large, level backyard—perfect for gardening, a fire pit, or even future expansion. With some thoughtful updates and a little vision, you can easily polish this gem to its full potential. Whether you're looking for a manageable rental or a tiny-home retreat, this value-add property is a must-see.
-
2026-03-23$259,900 Active
Show marketing remark (450 chars)
Charming 576 sq. ft. cottage offering a fantastic opportunity for a savvy investor or DIY enthusiast! This cozy home sits on a deep lot featuring a large, level backyard—perfect for gardening, a fire pit, or even future expansion. With some thoughtful updates and a little vision, you can easily polish this gem to its full potential. Whether you're looking for a manageable rental or a tiny-home retreat, this value-add property is a must-see.
ⓘ Source: listings_history table (triggers on properties + properties_extension) + one-shot
backfill from property_details.listing_events for pre-trigger history.
Tax reassessment forecast IN · Partial reset (capped growth)
- Current annual tax
- $473 · $39/mo
- Projected year-2 tax
- $555 · $46/mo
- Expected delta
- +$82/yr (+$7/mo · 17.3%)
ⓘ Screening estimate from a state-policy table — verify with the county assessor before closing.
Climate risk First Street
- Flood 1/10 Low FEMA zone X (unshaded) · 0% chance over 30 yrs
- Wildfire 1/10 Low
- Heat 3/10 Moderate 7 d/yr ≥103°F today · 18 d/yr by 30 yrs out
- Wind 2/10 Low
- Air quality 3/10 Moderate 2 unhealthy d/yr today · 4 by 30 yrs out
Nearby sold comps map
Loading sold comps map…
Walkable amenities ~0.75 mi
Loading nearby amenities…
Taxation est. · year 1
- Rental income
- $9,588
- − Mortgage interest
- −$4,196
- − Property taxes
- −$473
- − Insurance
- −$374
- − Repairs & maintenance
- −$767
- − Management
- −$767
- − Depreciation
- −$2,179
- Taxable income
- $832
- Est. tax owed @ 24.0%
- −$200
- After-tax cash flow
- $1,814/yr
For passive investors: Depreciation is non-cash, so a rental often shows a tax loss while cash-flowing — sheltering income. Rental losses are passive: they offset passive income freely, and up to $25,000/yr can offset ordinary (W-2) income if you actively participate and your MAGI is under $100k (phasing out to $0 by $150k); unused losses carry forward. On sale, claimed depreciation is recaptured at up to 25%, and gains may owe capital-gains tax (a 1031 exchange can defer both). Figures are a year-1 estimate at your 24.0% rate — not tax advice; consult a CPA.
Schools (NCES district)
No district data.
Livability — Williamsport
- Score
- 75/100
- State rank
- #59
- US rank
- #4014
Category grades
Schools grade is shown separately in the Schools card above.
Census & demographics
- Census place
- Williamsport, IN
- Population (ZIP)
- 3,667
Population outlook (Warren County) Hauer SSP2
- Today (2025)
- 7,692 people
- By 2030
- 7,331 · -4.7%
- By 2040
- 6,581 · -14.4%
- By 2050
- 5,853 · -23.9%
- By 2075
- 4,692 · -39.0%
- By 2100
- 3,985 · -48.2%
Race, ethnicity, and origin ACS 2023
- Neighborhood character
- Predominantly White (97%)
- Race & ethnicity
- White 97% Two or more races 3%
- Common ancestry
- Slovak 3% Portuguese 2% Italian 1%
- Foreign-born
- 1%
Political lean MEDSL · Warren
- 2024 margin
- Solid R (+57.3) · D 20.6% · R 77.8% · Other 1.6%
- 2008→2024 swing
- -47.0pp toward R · 2008: -10.3pp · 2024: -57.3pp
- All cycles
- 2024: R+57.3 2020: R+54.3 2016: R+52.5 2012: R+27.7 2008: R+10.3
Not yet ingested
- Civics
- —
Market trends
- HPI YoY
- ▲ 6.84%
- Current HPI
- 245.607
- Rent YoY
- —
- Metro
- —
- State GDP YoY
- ▲ 2.90%
- F500 in state
- 18
Industry mix (Fortune 500 HQ in IN)
| Industry | F500 HQs | Revenue |
|---|---|---|
| Industrial Machinery | 2 | $37B |
|
||
| Healthcare | 1 | $177B |
|
||
| Pharmaceuticals | 1 | $45B |
|
||
| Metals / Steel | 1 | $18B |
|
||
| Agriculture | 1 | $17B |
|
||
| Packaging | 1 | $12B |
|
||
Price history
-71.2% since first listed3 events — show timeline
- 2026-05-13 Pending — IRMLS
- 2026-03-23 Listed $74,900 IRMLS
- 2026-03-23 Listed $259,900 IRMLS
Property tax history
+2.3%/yrLatest (2024): $473 · +13.1% YoY. Source: county tax records.
Cash-flow waterfall
monthlySold comps — $/sqft
last 12 mo · ≤1 miLoading sold comps…