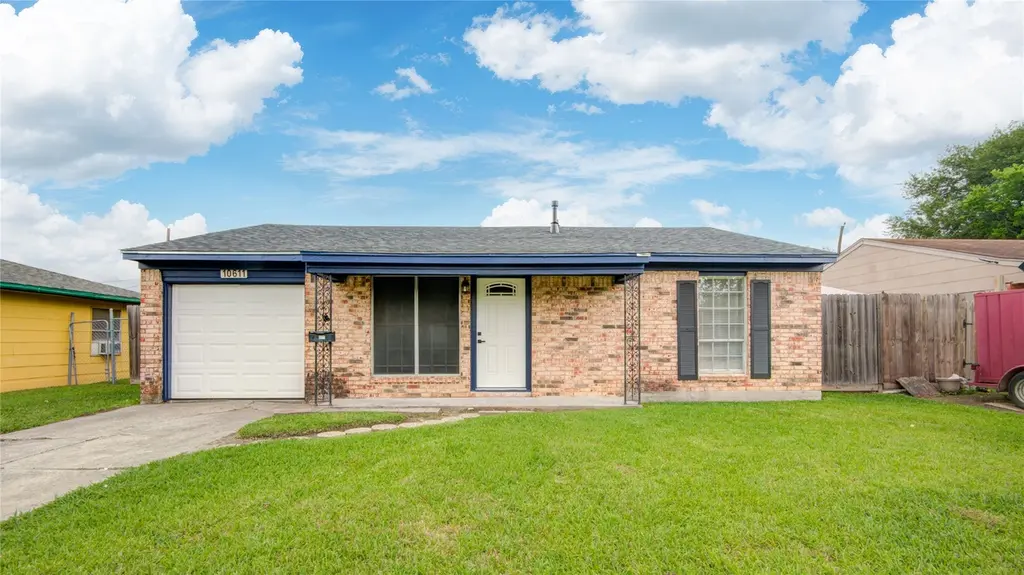
10611 Leitrim Way · Houston, TX
Flood risk 4/10 · Minor
- FEMA flood zone
- X (shaded)
- Chance of flooding over 30 yrs
- 0.24%
- Est. flood insurance / yr
- $507 – $1,088
Fire risk 1/10 · Minimal
- Est. fire insurance / yr
- $1,222 – $2,270
Heat risk 9/10 · Severe
- Hot days now (above 109°F)
- 7 days/yr
- Hot days in 30 yrs
- 24 days/yr
Wind risk 9/10 · Severe
- Chance of severe wind over 30 yrs
- 99.0%
Air-quality risk 2/10 · Minimal
- Unhealthy air days now
- 2 days/yr
- Unhealthy air days in 30 yrs
- 2 days/yr
Risk factors via First Street. Map © Google.
Why this score? — see what drove the D grade
The composite is a weighted blend of 9 inputs, each scored 0–100. Each bar is that input's sub-score; the figure is the points it added to the 100-point composite (weight × sub-score).
- Cash flow +16.2/30.0
- ARV discount +7.5/15.0
- DSCR +5.0/10.0
- 1% rule +4.3/10.0
- Livability +3.7/5.0
- Schools +2.7/10.0
- Condition / age +2.5/5.0
- Rent growth +2.4/5.0
- Appreciation +0.0/10.0
$159,900
🖨 Deal sheet 📄 Offer letter ✓ Due diligence
Listing remarks
Welcome to this beautifully updated 3 bed, 1 bath home with 1 car garage in South Acres. This property features a new roof, flooring, central a/c, kitchen cabinets, quartz countertops, and stainless steel appliances. The spacious secondary bedrooms enhance the curb appeal of this must-see property. Schedule your showing today and don't miss out on the opportunity to make this house your new home!
Key facts
- Quartz countertops
- Kitchen cabinets
- New roof
Tags
Property features AI
Exterior
- Parking: Attached garage (1 car)
- Utilities: Public water; Public sewer
- Home design: Residential property; Entry level: First floor
- Construction: Brick construction; Composition roof; Slab foundation; Built in 1963
- Exterior features: Subdivision lot
Interior
- Kitchen: Dishwasher; Free‑standing range; Gas oven; Oven
- Bedrooms: Primary bedroom on the first level; Two additional bedrooms on the first level
- Flooring: Plank flooring; Vinyl flooring
- Bathrooms: 1 full bathroom
- Heating & cooling: Central heating (gas); Central electric air conditioning
- Interior features: Ceiling fan(s); Programmable thermostat
Neighborhood map
What this means for you Summary
Snapshot
- This is a 2-bed/1.0-bath single-family listed at $160k.
Deal economics
- At list price, monthly cash flow is $86 ($1k/yr) — positive.
- The deal already cash-flows at list — no discount required.
- To meet the 1% rule (rent ≥ 1% of price), the offer needs to be $148k (7.3% below list).
- Recommended offer: $148k (7.3% below list) — sets the bar for 1% rule.
- Cap rate 6.9% vs local median 3.2% in Houston — top-decile yield for the area; either an underpriced asset or a hidden risk that comps aren't pricing in. Stress-test before assuming the spread holds.
Location & tenants
- Location reads 74/100 on livability (#184 in TX, #4,771 nationally) — a middle-class / working-renter tenant base. Strengths: amenities A+, cost of living A+, housing A+; Watch: crime F.
- Houston ISD (urban): math 27% / reading 35% proficiency, ranked #593 of 826 in TX (top 72%) — families likely to look elsewhere, expect single-tenant / working-renter base with shorter leases; 71% free/reduced lunch — lower-income household profile, screen leases tightly.
- Zoned schools: Woodson School (math 17% / reading 22%, grade F, #3,583 of 4,322 statewide, top 86%, 572 students, 99% FRL); Thomas Middle (math 3% / reading 13%, grade F, #1,654 of 1,662 statewide, top 100%, 526 students, 98% FRL); Worthing H S (math 22% / reading 21%, grade F, #1,377 of 1,632 statewide, top 85%, 827 students, 96% FRL) — zoned schools average 98% FRL vs 71% district-wide (27 pts higher); higher-poverty schools than district average — tighter screening recommended.
- Zoned-school proficiency averages 16% at this address vs 31% district-wide (-15 pts) — the specific schools serving this property underperform the Houston ISD average; the district grade overstates school quality for this exact location.
- Market conditions: Rents soft (-0.2%/yr); 280 active listings in the ZIP; 20 comparable units currently listed for rent nearby; rentals at typical pace (median 19d on market — plan ~3-4 weeks tenant-placement turnaround); solid renter incomes; 29,883 units permitted in Harris County in 2024 (8,621 in 5+ unit buildings).
Forward outlook
- Local home prices are declining (-3.0%/yr); year-one equity from $1k of loan paydown is wiped out by about $5k of value loss. Plan a longer hold.
- Harris County population projected at +47% by 2050 — long-run rental-demand tailwind backs the buy-and-hold thesis.
Negotiation context
- Only 8 days on market — expect competitive offers; lowballing is unlikely to land.
- 3 sale attempts; this cycle's ask is 9037% above the opening price — seller raised mid-cycle; expect resistance to lowballs.
Risks & watch-outs
- Climate carrying-cost: severe wind risk, 99% chance of damaging wind over 30y; extreme-heat days projected 7→24/yr by 2055 (HVAC capex compounding) — expect insurance premiums to compound above CPI over the hold.
Questions for the listing agent
- Built in 1963 — when were the roof, HVAC, electrical panel, plumbing, and water heater last replaced?
- Is there a deadline driving the sale (1031 exchange, divorce, estate, relocation)? That informs how much negotiation room exists.
- Schools are D-rated, which usually means shorter tenancies and higher turnover. Who's the typical renter profile here, and what's been the actual vacancy rate?
- Crime grade is F in this area — have there been break-ins, vandalism, or insurance claims at this property in the last 3 years? What carrier currently insures it and at what premium?
- The area grade is low — what's the realistic commute time and amenity access for the typical tenant pool here? Any planned neighborhood developments (good or bad) we should know about?
- What's the average days-on-market for RENTAL listings here right now (not sales)? A rising rental-DOM trend means longer vacancies and softer asking-rent achievability than the comps imply.
- What's the recent tenant-quality profile in this submarket — average credit score on applications, eviction rate, late-payment / NSF rate, and stable-employment percentage? A property-management company in the area should have these aggregated.
- How much new for-sale + rental construction is in the pipeline within 1–3 miles? Heavy new supply typically softens prices + rents 12–24 months out; constrained supply supports both.
Investment metrics
- 1% rule
- 0.93% ✗
- Cap rate
- 6.93%
- Cash-on-cash
- 2.29%
- DSCR
- 1.10
- GRM
- 9.0
CMA / ARV
- ARV (median comp)
- $159,860
- List price
- $159,900
- Delta
- 0.03%
- Verdict
- FAIR
- Comps
- 20 within 1.0 mi
Show comp detail 12 sales within ~0.75 mi
| Address | Dist | Beds/Ba | Sqft | Sold | Price | $/sf | Match |
|---|---|---|---|---|---|---|---|
| 10611 Leitrim Way | 0.00mi | 3/1.0 (+1) | 1,105 (0%) | 0mo | $159,900 | $145 | 95 |
| 4235 Dacca Dr | 0.26mi | 3/2.0 (+1) | 1,110 (+0%) | 4mo | $177,000 | $159 | 75 |
| 3334 Dulcrest St | 0.67mi | 3/1.0 (+1) | 1,122 (+2%) | 3mo | $90,000 | $80 | 58 |
| 10818 Carlton Dr | 0.31mi | 3/1.0 (+1) | 1,246 (+13%) | 2mo | $175,999 | $141 | 58 |
| 11018 Long Gate | 0.38mi | 3/1.5 (+1) | 1,242 (+12%) | 2mo | $130,000 | $105 | 53 |
| 3334 Airport Blvd | 0.67mi | 3/1.0 (+1) | 1,118 (+1%) | 11mo | $179,900 | $161 | 53 |
| 10205 Sierra Dr | 0.72mi | 3/1.0 (+1) | 1,151 (+4%) | 3mo | $120,000 | $104 | 52 |
| 10006 Chesterfield Dr | 0.70mi | 3/1.0 (+1) | 1,170 (+6%) | 3mo | $125,000 | $107 | 50 |
| 10010 Fairland Dr | 0.74mi | 3/1.0 (+1) | 1,148 (+4%) | 10mo | $72,000 | $63 | 46 |
| 4419 Botany Ln | 0.71mi | 3/2.0 (+1) | 1,173 (+6%) | 3mo | $190,000 | $162 | 45 |
| 11707 Segrest Dr | 0.75mi | 3/1.0 (+1) | 1,020 (-8%) | 9mo | $149,900 | $147 | 40 |
| 4826 Airport Blvd | 0.64mi | 3/1.0 (+1) | 1,260 (+14%) | 6mo | $164,900 | $131 | 37 |
Match score weights: distance 35% · size 25% · config 20% · recency 20%. Top-matched comps best support the ARV.
Projected returns pro-forma
-3.0% appreciation · 0.0% rent growth · sell at horizon
- IRR
- -16.0%
- Equity multiple
- 0.45×
- Total profit
- $-24,796
- Equity at exit
- $23,842
- IRR
- -14.0%
- Equity multiple
- 0.30×
- Total profit
- $-31,322
- Equity at exit
- $13,825
Cash invested: $44,772 (down + closing). Projections, not guarantees.
Landlord ↔ Tenant lean methodology
- Overall (STATE)
- 87 Strongly Landlord-Friendly
- State Texas
- 87 Strongly Landlord-Friendly · R+5
- County
- — inherits STATE
- City
- — inherits STATE
ZIP-level market 77047
- Home prices YoY
- -10.1%
- Rents YoY
- -0.2%
- Active inventory
- 280
- Price-to-rent
- 9.0×
Monthly cashflow live
- Estimated rent
- $1,482 high interval (Pro) →
- Mortgage (P&I)
- −$839
- Tax from tax record
- −$180 /mo · $2,162/yr
- Insurance
- −$67
- HOA
- −$0
- Vacancy / Maint / Mgmt
- −$311
- Net cashflow
- $86
Break-even live
UW: 25.0% down · 7.5% · 30yr · 1.5% tax · 5.0% vac · 8.0% maint · 8.0% mgmt
Financing live
Cash to close
- Down payment
- $39,975
- Closing costs
- $4,797
- Reserves months
- —
- Total cash needed
- —
Loan-product check · same deal, 3 products live
Conventional
25% down · 7.5% · 30yr
- Down + closing
- —
- Monthly P&I
- —
- Monthly cashflow
- —
- DSCR
- —
- Eligible?
- —
Personal DTI + credit; lowest rate.
DSCR
20% down · 8.5% · 30yr
- Down + closing
- —
- Monthly P&I
- —
- Monthly cashflow
- —
- DSCR
- —
- Eligible?
- —
No personal income docs; deal must DSCR.
Hard money
10% down · 12.0% · 12mo
- Down + closing
- —
- Monthly P&I
- —
- Monthly cashflow
- —
- DSCR
- —
- Eligible?
- —
Short-term bridge; refi at stabilization.
Rent comps 20 comps
| Address | Beds | Baths | Sqft | Rent | $/sqft | DOM | Units | Dist |
|---|---|---|---|---|---|---|---|---|
| 4322 Groton Dr Houston, TX | 3.0 | 1.0 | 858 | $1,395 | $1.63 | 43d | 1 | 0.40mi |
| 4112 Grassmere St Houston, TX | 2.0 | 1.0 | 711 | $700 | $0.98 | 10d | 1 | 0.67mi |
| 4205 Grassmere St Houston, TX | 2.0 | 1.0 | 824 | $900 | $1.09 | 24d | 1 | 0.68mi |
| 10510 Cathedral Dr Houston, TX | 3.0 | 1.0 | 887 | $1,300 | $1.47 | 43d | 1 | 0.76mi |
| 11819 Leitrim Way Houston, TX | 3.0 | 1.0 | 1476 | $1,150 | $0.78 | 5d | 1 | 0.81mi |
| 9414 Heno St Unit 13 Houston, TX | 2.0 | 1.0 | 824 | $900 | $1.09 | 24d | 1 | 0.82mi |
| 11319 Murr Way Houston, TX | 3.0 | 1.5 | 1213 | $1,699 | $1.40 | 18d | 1 | 0.96mi |
| 4810 Wilmington St Unit A Houston, TX | 3.0 | 2.0 | 1165 | $1,650 | $1.42 | 43d | 1 | 1.04mi |
| 4207 Phlox St Houston, TX | 2.0 | 1.0 | 736 | $962 | $1.31 | 1d | 1 | 1.06mi |
| 4205 Phlox St Unit 2 BEDROOM 6 Houston, TX | 2.0 | 1.0 | 736 | $860 | $1.17 | 18d | 1 | 1.06mi |
| 2201 Orem Dr Houston, TX | 1.0 | 1.0 | 826 | $1,230 | $1.49 | 12d | 1 | 1.08mi |
| 4918 Wilmington St Unit A Houston, TX | 3.0 | 3.0 | 1300 | $2,100 | $1.62 | 43d | 1 | 1.13mi |
| 4326 Larkspur St Unit 3 Houston, TX | 2.0 | 1.0 | 800 | $1,200 | $1.50 | 16d | 1 | 1.17mi |
| 4015 Marchant Rd Houston, TX | 3.0 | 2.0 | 1200 | $1,700 | $1.42 | 43d | 1 | 1.20mi |
| 4723 Mallow St Houston, TX | 3.0 | 2.5 | 1472 | $1,850 | $1.26 | 5d | 1 | 1.23mi |
| 12227 Cape Hyannis Dr Houston, TX | 3.0 | 2.0 | 1432 | $1,705 | $1.19 | 13d | 1 | 1.39mi |
| 5426 Greylog Dr Houston, TX | 3.0 | 2.0 | 1205 | $1,750 | $1.45 | 24d | 1 | 1.39mi |
| 5036 Mallow St Houston, TX | 3.0 | 3.0 | 1472 | $2,050 | $1.39 | 43d | 1 | 1.45mi |
| 2910 Reed Rd Houston, TX | 1.0–3.0 | 1.0–2.0 | 967 | $1,088 | $1.12 | 1d | 5 | 1.46mi |
| 4526 Knoxville St Unit A Houston, TX | 3.0 | 2.5 | 1474 | $1,775 | $1.20 | 14d | 1 | 1.47mi |
Listing history 6 events
-
2026-05-12historical
-
2026-05-12$159,900 Active 399-char remark
-
2026-05-11price $159,900
-
2026-04-07$164,900 Active
-
2026-02-06soldstatus
-
1988-01-02soldstatus
ⓘ Source: listings_history table (triggers on properties + properties_extension) + one-shot
backfill from property_details.listing_events for pre-trigger history.
Tax reassessment forecast TX · Resets to sale price
- Current annual tax
- $2,162 · $180/mo
- Projected year-2 tax
- $2,926 · $244/mo
- Expected delta
- +$764/yr (+$64/mo · 35.4%)
ⓘ Screening estimate from a state-policy table — verify with the county assessor before closing.
Climate risk First Street
- Flood 4/10 Moderate FEMA zone X (shaded) · 24% chance over 30 yrs
- Wildfire 1/10 Low
- Heat 9/10 Extreme 7 d/yr ≥109°F today · 24 d/yr by 30 yrs out
- Wind 9/10 Extreme 99% chance of damaging wind over 30 yrs
- Air quality 2/10 Low 2 unhealthy d/yr today · 2 by 30 yrs out
Nearby sold comps map
Loading sold comps map…
Walkable amenities ~0.75 mi
Loading nearby amenities…
Taxation est. · year 1
- Rental income
- $17,785
- − Mortgage interest
- −$8,957
- − Property taxes
- −$2,162
- − Insurance
- −$800
- − Repairs & maintenance
- −$1,423
- − Management
- −$1,423
- − Depreciation
- −$4,652
- Taxable loss
- −$1,631
- Est. tax savings @ 24.0%
- +$391
- After-tax cash flow
- $1,418/yr
For passive investors: Depreciation is non-cash, so a rental often shows a tax loss while cash-flowing — sheltering income. Rental losses are passive: they offset passive income freely, and up to $25,000/yr can offset ordinary (W-2) income if you actively participate and your MAGI is under $100k (phasing out to $0 by $150k); unused losses carry forward. On sale, claimed depreciation is recaptured at up to 25%, and gains may owe capital-gains tax (a 1031 exchange can defer both). Figures are a year-1 estimate at your 24.0% rate — not tax advice; consult a CPA.
Schools (NCES district)
- District
- Houston ISD
- NCES district ID
- 4823640
- Math proficiency
- 27% ▼ -18.00%
- Reading proficiency
- 35% ▼ -6.00%
- Median HH income
- $46,054
- Composite
- 26.63/100
- National rank
- #7173
- State rank
- #593 of 826 in TX
Livability — Houston
- Score
- 74/100
- State rank
- #184
- US rank
- #4771
Category grades
Schools grade is shown separately in the Schools card above.
Census & demographics
- Census place
- Houston, TX
- County
- Harris County · 4,702,590 people
- City population
- 3,226,434
- Metro
- Houston-The Woodlands-Sugar Land, TX
- Population (ZIP)
- 34,987
- Household income
- $78,538
- Rent vs Own
- Severe rent burden
- 1109.0
Population outlook (Harris County) Hauer SSP2
- Today (2025)
- 5,571,493 people
- By 2030
- 6,089,821 · +9.3%
- By 2040
- 7,142,806 · +28.2%
- By 2050
- 8,185,864 · +46.9%
- By 2075
- 10,574,329 · +89.8%
- By 2100
- 12,109,958 · +117.4%
Race, ethnicity, and origin ACS 2023
- Neighborhood character
- Diverse neighborhood (Simpson 0.58)
- Race & ethnicity
- Black 57% Hispanic / Latino 29% Two or more races 15% White 6% Asian 3% Pacific Islander 1%
- Hispanic origin (detail)
- Mexican 24% Puerto Rican 1%
- Common ancestry
- Lithuanian 1%
- Foreign-born
- 15% · Canada, Vietnam
- Languages at home
- 70% English-only · Spanish 23% Vietnamese 1% Other Indo-European 1%
Political lean MEDSL · Harris
- 2024 margin
- Lean D (+5.5) · D 52.0% · R 46.4% · Other 1.6%
- 2008→2024 swing
- +3.9pp toward D · 2008: 1.6pp · 2024: 5.5pp
- All cycles
- 2024: D+5.5 2020: D+13.3 2016: D+12.4 2012: D+0.1 2008: D+1.6
Not yet ingested
- Civics
- —
Market trends
- HPI YoY
- ▼ -26.76%
- Current HPI
- 239.2287
- Rent YoY
- ▼ -0.21%
- Metro
- Houston-The Woodlands-Sugar Land, TX
- State GDP YoY
- ▲ 3.95%
- F500 in state
- 110
Industry mix (Fortune 500 HQ in TX)
| Industry | F500 HQs | Revenue |
|---|---|---|
| Energy | 16 | $1,198B |
|
||
| Technology | 5 | $198B |
|
||
| Engineering / Construction | 4 | $72B |
|
||
| Energy Services | 3 | $60B |
|
||
| Utilities | 3 | $41B |
|
||
| Healthcare | 2 | $330B |
|
||
Price history
-98.9% since first listed11 events — show timeline
- 2026-06-15 Rental Removed $1,750 HARMLS
- 2026-06-08 Sold (Public Records) — Public Records
- 2026-06-07 Listed for Rent $1,750 HARMLS
- 2026-06-04 Sold (MLS) — HARMLS
- 2026-05-20 Pending — HARMLS
- 2026-05-12 Listing Removed — HARMLS
- 2026-05-12 Listed $159,900 HARMLS
- 2026-05-11 Price Changed $159,900 HARMLS
- 2026-04-07 Listed $164,900 HARMLS
- 2026-02-06 Sold (Public Records) — Public Records
- 1988-01-02 Sold (Public Records) — Public Records
Property tax history
+4.5%/yrLatest (2025): $2,162 · +11.7% YoY. Source: county tax records.
Cash-flow waterfall
monthlySold comps — $/sqft
last 12 mo · ≤1 miLoading sold comps…