 Duplex
104 Grove St #2 · Lake Hallie, WI
Flood risk No data
- FEMA flood zone
- —
- Chance of flooding over 30 yrs
- —
- Est. flood insurance / yr
- —
Fire risk No data
- Est. fire insurance / yr
- —
Heat risk No data
- Hot days now (above threshold)
- —
- Hot days in 30 yrs
- —
Wind risk No data
- Chance of severe wind over 30 yrs
- —
Air-quality risk No data
- Unhealthy air days now
- —
- Unhealthy air days in 30 yrs
- —
Risk factors via First Street. Map © Google.
Why this score? — see what drove the B- grade
The composite is a weighted blend of 9 inputs, each scored 0–100. Each bar is that input's sub-score; the figure is the points it added to the 100-point composite (weight × sub-score).
- Cash flow +28.1/30.0
- DSCR +10.0/10.0
- 1% rule +7.7/10.0
- ARV discount +7.5/15.0
- Livability +3.5/5.0
- Schools +3.4/10.0
- Rent growth +3.0/5.0
- Condition / age +2.8/5.0
- Appreciation +0.0/10.0
$209,499
🖨 Deal sheet 📄 Offer letter ✓ Due diligence
Multi-family units
County records classify this as Multi-Family (2-4 Unit). Listing-text estimate: 2 units. confirmed
Listing remarks
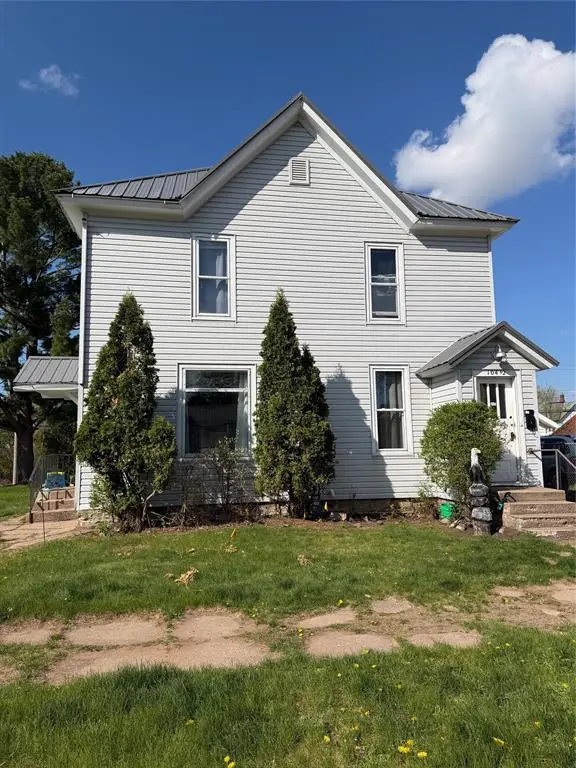
East Hill Duplex, Investment Opportunity in Chippewa Falls! This well-maintained duplex is ready for its new owners and offers a great opportunity for both investors and owner-occupants alike! The lower unit features 3 bedrooms and 1 bathroom, while the upper unit offers 2 bedrooms and 1 bathroom. Both units include spacious living areas along with in-unit washers and dryers for added tenant convenience. The lower unit also features central air conditioning. Major updates in recent years provide peace of mind, including: New roof, Lower unit furnace, Hot water heaters, Upgraded 100 amp electrical service Located in the desirable East Hill neighborhood, this property combines stro
Key facts
- New roof
- 8,193 sq ft lot
- Built 1918
Tags
Property features AI
Finance
- Financial info: Duplex with 2 units
Exterior
- Utilities: Municipal sewer
- Home design: Duplex (multi-family); Estimated total above-grade living area about 2,218 sq ft
- Exterior features: Vinyl exterior; Lot smaller than 1/2 acre (approx. 0.1881 acre)
Interior
- Bedrooms: Unit 1: 3 bedrooms; Unit 2: 2 bedrooms
- Bathrooms: Unit 1: 1 full bathroom; Unit 2: 1 full bathroom
- Heating & cooling: Central air; Forced air; Natural gas heating
- Interior features: Circuit breakers
Neighborhood map
What this means for you Summary
Snapshot
- This is a 2 × 2-bed/1.0-bath units multifamily listed at $209k. Condition is rated average.
Deal economics
- At list price, monthly cash flow is $657 ($8k/yr) — positive. Per door: $328/mo.
- The deal already cash-flows at list — no discount required.
- Meets the 1% rule at list price ($3k rent vs $209k).
- Recommended offer: $203k (3.0% below list) — sets the bar for market timing.
- Cap rate 10.1% vs local median 1.4% in Lake Hallie — top-decile yield for the area; either an underpriced asset or a hidden risk that comps aren't pricing in. Stress-test before assuming the spread holds.
Location & tenants
- Location reads 69/100 on livability (#320 in WI) — a middle-class / working-renter tenant base. Strengths: cost of living A+, housing A+, crime A-; Watch: schools D+, health & safety D, amenities F.
- Chippewa Falls Area Unified School District (suburban): math 39% / reading 39% proficiency, ranked #165 of 342 in WI (top 48%) — families likely to look elsewhere, expect single-tenant / working-renter base with shorter leases.
- Market conditions: Rents rising (+1.9%/yr); 171 active listings in the ZIP; solid renter incomes; 368 units permitted in Chippewa County in 2024 (142 in 5+ unit buildings).
- This rent runs 42% of the median local income ($76k/yr) — at the standard rent-burdened threshold; future hikes will face affordability resistance.
Forward outlook
- Local home prices are declining (-3.0%/yr); year-one equity from $1k of loan paydown is wiped out by about $6k of value loss. Plan a longer hold.
- Chippewa County population projected to shrink 5% by 2050 — rents likely to lag national; underwrite the cash flow, not the appreciation.
- At projected returns (-3.0% appreciation + 1.9% rent growth), your $59k cash investment doubles in ~10 years — after that, you're playing with house money.
Negotiation context
- It's been on market 36 days — a 3% lower offer ($203k) is reasonable based on typical stale-listing flexibility.
Risks & watch-outs
- Watch-outs: built in 1918 — expect roof / HVAC / electrical / plumbing capex.
Questions for the listing agent
- It's been on market 36 days. Have you received any prior offers? Is the seller open to a 3% concession, seller financing, or rate buy-down credit?
- Can we see the unit-by-unit rent roll, current vacancy, and any below-market leases? What's the average tenancy length?
- What capital expenditures (roof, boiler, parking lot, exteriors) have been made in the last 5 years, and what's planned in the next 2?
- Built in 1918 — when were the roof, HVAC, electrical panel, plumbing, and water heater last replaced?
- Is there a deadline driving the sale (1031 exchange, divorce, estate, relocation)? That informs how much negotiation room exists.
- Schools are D-rated, which usually means shorter tenancies and higher turnover. Who's the typical renter profile here, and what's been the actual vacancy rate?
- What's the average days-on-market for RENTAL listings here right now (not sales)? A rising rental-DOM trend means longer vacancies and softer asking-rent achievability than the comps imply.
- What's the recent tenant-quality profile in this submarket — average credit score on applications, eviction rate, late-payment / NSF rate, and stable-employment percentage? A property-management company in the area should have these aggregated.
- How much new apartment / multifamily construction is in the pipeline within 1–3 miles? Heavy new supply (>2% of stock underway) typically softens rents 12–24 months out; light construction supports rent growth.
Investment metrics
- 1% rule
- 1.27% ✓
- Cap rate
- 10.05%
- Cash-on-cash
- 13.44%
- DSCR
- 1.60
- GRM
- 6.6
CMA / ARV
No comps found within radius.
Projected returns pro-forma
-3.0% appreciation · 1.95% rent growth · sell at horizon
- IRR
- 2.3%
- Equity multiple
- 1.09×
- Total profit
- $5,136
- Equity at exit
- $31,237
- IRR
- 10.9%
- Equity multiple
- 1.81×
- Total profit
- $47,307
- Equity at exit
- $18,114
Cash invested: $58,660 (down + closing). Projections, not guarantees.
Landlord ↔ Tenant lean methodology
- Overall (STATE)
- 73 Landlord-Friendly
- State Wisconsin
- 73 Landlord-Friendly · R+2
- County
- — inherits STATE
- City
- — inherits STATE
ZIP-level market 54729
- Rents YoY
- 1.9%
- Active inventory
- 171
- Price-to-rent
- 13.1×
Monthly cashflow live
- Estimated rent
- $2,664 medium interval (Pro) →
- Mortgage (P&I)
- −$1,099
- Tax est. 1.5%
- −$262 /mo · $3,142/yr
- Insurance
- −$87
- HOA
- −$0
- Vacancy / Maint / Mgmt
- −$559
- Net cashflow
- $657
Break-even live
2-unit breakdown (identical units grouped — click to expand)
| Units | Beds | Baths | Est. rent |
|---|---|---|---|
| 2× units | 2 | 1 | $2,664 |
| #1 | 2 | 1 | $1,332 |
| #2 | 2 | 1 | $1,332 |
| Total (2 units) | $2,664 | ||
UW: 25.0% down · 7.5% · 30yr · 1.5% tax · 5.0% vac · 8.0% maint · 8.0% mgmt
Financing live
Cash to close
- Down payment
- $52,375
- Closing costs
- $6,285
- Reserves months
- —
- Total cash needed
- —
Loan-product check · same deal, 3 products live
Conventional
25% down · 7.5% · 30yr
- Down + closing
- —
- Monthly P&I
- —
- Monthly cashflow
- —
- DSCR
- —
- Eligible?
- —
Personal DTI + credit; lowest rate.
DSCR
20% down · 8.5% · 30yr
- Down + closing
- —
- Monthly P&I
- —
- Monthly cashflow
- —
- DSCR
- —
- Eligible?
- —
No personal income docs; deal must DSCR.
Hard money
10% down · 12.0% · 12mo
- Down + closing
- —
- Monthly P&I
- —
- Monthly cashflow
- —
- DSCR
- —
- Eligible?
- —
Short-term bridge; refi at stabilization.
Listing history 19 events
-
2026-06-19days on market $209,499 Active 36 DOM
-
2026-06-18days on market $209,499 Active 35 DOM
-
2026-06-17days on market $209,499 Active 34 DOM
-
2026-06-16days on market $209,499 Active 33 DOM
-
2026-06-15days on market $209,499 Active 32 DOM
-
2026-06-14days on market $209,499 Active 30 DOM
-
2026-06-13days on market $209,499 Active 29 DOM
-
2026-06-10days on market $209,499 Active 27 DOM
-
2026-06-09days on market $209,499 Active 26 DOM
-
2026-06-08days on market $209,499 Active 25 DOM
-
2026-06-07days on market $209,499 Active 24 DOM
-
2026-06-05days on market $209,499 Active 21 DOM
-
2026-06-03days on market $209,499 Active 20 DOM
-
2026-06-02days on market $209,499 Active 19 DOM
-
2026-06-01days on market $209,499 Active 18 DOM
-
2026-05-31days on market $209,499 Active 17 DOM
-
2026-05-30days on market $209,499 Active 16 DOM
-
2026-05-22price $209,499
-
2026-05-14$219,900 Active
ⓘ Source: listings_history table (triggers on properties + properties_extension) + one-shot
backfill from property_details.listing_events for pre-trigger history.
Nearby sold comps map
Loading sold comps map…
Walkable amenities ~0.75 mi
Loading nearby amenities…
Taxation est. · year 1
- Rental income
- $31,968
- − Mortgage interest
- −$11,735
- − Property taxes
- −$3,142
- − Insurance
- −$1,047
- − Repairs & maintenance
- −$2,557
- − Management
- −$2,557
- − Depreciation
- −$6,095
- Taxable income
- $4,833
- Est. tax owed @ 24.0%
- −$1,160
- After-tax cash flow
- $6,721/yr
For passive investors: Depreciation is non-cash, so a rental often shows a tax loss while cash-flowing — sheltering income. Rental losses are passive: they offset passive income freely, and up to $25,000/yr can offset ordinary (W-2) income if you actively participate and your MAGI is under $100k (phasing out to $0 by $150k); unused losses carry forward. On sale, claimed depreciation is recaptured at up to 25%, and gains may owe capital-gains tax (a 1031 exchange can defer both). Figures are a year-1 estimate at your 24.0% rate — not tax advice; consult a CPA.
Condition & rehab AI · 12 photos
This well-maintained but dated multi-family property offers a great investment opportunity. Minor repairs and updates can significantly enhance its value.
Repairs flagged
- Minor Kitchen cabinets — Slight wear and tear visible.
- Minor Bathroom fixtures — Signs of wear and tear visible.
- Minor Landscaping — Basic landscaping could be improved for better curb appeal.
Value-add opportunities
- Both Paint interior walls — Fresh paint can improve the overall appearance and value of the property.
- Both Replace kitchen cabinets — New cabinets can enhance the kitchen's functionality and aesthetic appeal.
- Both Upgrade bathroom fixtures — Modern fixtures can improve the bathroom's functionality and aesthetic appeal.
- Both Improve landscaping — Better landscaping can improve curb appeal and add value to the property.
Renovation cost estimate screening
| Repair item | Severity | Est. cost |
|---|---|---|
| Kitchen cabinets · Slight wear and tear visible. | Minor | $500–3,000 |
| Bathroom fixtures · Signs of wear and tear visible. | Minor | $500–3,000 |
| Landscaping · Basic landscaping could be improved for better curb appeal. | Minor | $500–3,000 |
| Total estimated repair cost · 3 items | $1,500–9,000 |
Value-add ROI direction
- Both Paint interior walls — Fresh paint can improve the overall appearance and value of the property. ↑
- Both Replace kitchen cabinets — New cabinets can enhance the kitchen's functionality and aesthetic appeal. ↑
- Both Upgrade bathroom fixtures — Modern fixtures can improve the bathroom's functionality and aesthetic appeal. ↑
- Both Improve landscaping — Better landscaping can improve curb appeal and add value to the property. ↑
ⓘ Cost ranges are severity-bucket heuristics (US national rule-of-thumb). Get contractor quotes + a written scope before underwriting a rehab budget.
Schools (NCES district)
- District
- Chippewa Falls Area Unified School District
- NCES district ID
- 5502550
- Math proficiency
- 39% ▼ -8.00%
- Reading proficiency
- 39% ▼ -5.00%
- Median HH income
- $53,111
- Composite
- 33.97/100
- National rank
- #5326
- State rank
- #165 of 342 in WI
Livability — Lake Hallie
- Score
- 69/100
- State rank
- #320
- US rank
- #8248
Category grades
Schools grade is shown separately in the Schools card above.
Census & demographics
- County
- Chippewa County · 34,366 people
- Metro
- Eau Claire, WI
- Population (ZIP)
- 34,366
- Household income
- $75,809
- Rent vs Own
- Severe rent burden
- 890.0
Population outlook (Chippewa County) Hauer SSP2
- Today (2025)
- 64,601 people
- By 2030
- 64,743 · +0.2%
- By 2040
- 63,950 · -1.0%
- By 2050
- 61,359 · -5.0%
- By 2075
- 53,265 · -17.5%
- By 2100
- 40,534 · -37.3%
Race, ethnicity, and origin ACS 2023
- Neighborhood character
- Predominantly White (93%)
- Race & ethnicity
- White 93% Two or more races 3% Asian 2% Hispanic / Latino 2% Black 1%
- Common ancestry
- Portuguese 14% Romanian 5% Lithuanian 3%
- Foreign-born
- 2% · Canada, China
- Languages at home
- 96% English-only · Spanish 2% Other Asian/Pacific 1%
Political lean MEDSL · Chippewa
- 2024 margin
- Strong R (+23.0) · D 38.0% · R 60.9% · Other 1.1%
- 2008→2024 swing
- -32.1pp toward R · 2008: 9.1pp · 2024: -23.0pp
- All cycles
- 2024: R+23.0 2020: R+20.4 2016: R+19.2 2012: R+0.5 2008: D+9.1
Not yet ingested
- Civics
- —
Market trends
- HPI YoY
- ▼ -197.54%
- Current HPI
- 222.4407
- Rent YoY
- ▲ 1.95%
- Metro
- Eau Claire, WI
- State GDP YoY
- ▲ 2.10%
- F500 in state
- 20
Industry mix (Fortune 500 HQ in WI)
| Industry | F500 HQs | Revenue |
|---|---|---|
| Industrial Machinery | 4 | $23B |
|
||
| Industrial Technology | 2 | $36B |
|
||
| Insurance | 1 | $36B |
|
||
| Professional Services | 1 | $19B |
|
||
| Utilities | 1 | $9B |
|
||
| Consumer Goods | 1 | $3B |
|
||
Price history
-4.7% since first listed2 events — show timeline
- 2026-05-22 Price Changed $209,499 RANWW
- 2026-05-14 Listed $219,900 RANWW
Cash-flow waterfall
monthlySold comps — $/sqft
last 12 mo · ≤1 miLoading sold comps…