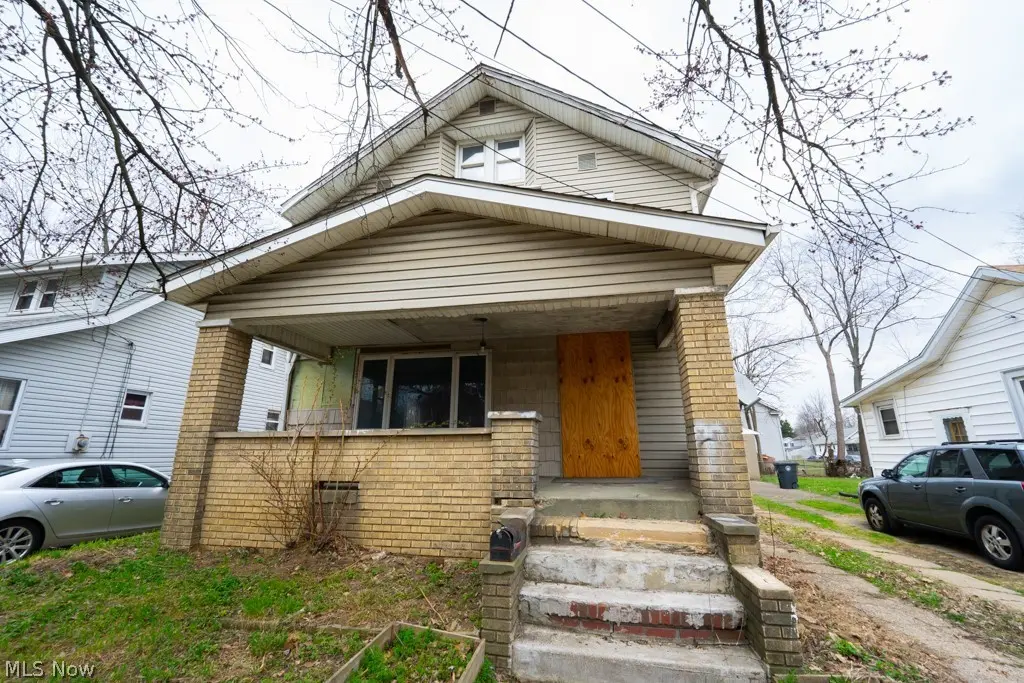
559 Morgan Ave · Akron, OH
Flood risk 1/10 · Minimal
- FEMA flood zone
- X (unshaded)
- Chance of flooding over 30 yrs
- 0.0%
- Est. flood insurance / yr
- $473 – $860
Fire risk 1/10 · Minimal
- Est. fire insurance / yr
- $713 – $1,323
Heat risk 3/10 · Minor
- Hot days now (above 96°F)
- 7 days/yr
- Hot days in 30 yrs
- 16 days/yr
Wind risk 1/10 · Minimal
- Chance of severe wind over 30 yrs
- —
Air-quality risk 3/10 · Minor
- Unhealthy air days now
- 2 days/yr
- Unhealthy air days in 30 yrs
- 4 days/yr
Risk factors via First Street. Map © Google.
Why this score? — see what drove the B- grade
The composite is a weighted blend of 9 inputs, each scored 0–100. Each bar is that input's sub-score; the figure is the points it added to the 100-point composite (weight × sub-score).
- Cash flow +30.0/30.0
- 1% rule +10.0/10.0
- DSCR +10.0/10.0
- ARV discount +4.8/15.0
- Livability +4.0/5.0
- Rent growth +2.5/5.0
- Condition / age +2.5/5.0
- Schools +2.1/10.0
- Appreciation +0.0/10.0
$98,700
🖨 Deal sheet 📄 Offer letter ✓ Due diligence
Listing remarks MLS
Unlock the potential of this spacious 1920s gem! With five large bedrooms and a flexible layout, there is plenty of room to modernize and add value. It’s a classic home with a solid foundation, just waiting for a creative renovation to bring it into the modern era. Sold as-is—perfect for your next project!
Key facts
- 4,399 sq ft lot
- Parking
- Built 1928
Neighborhood map
What this means for you Summary
Snapshot
- This is a 5-bed/1.0-bath single-family listed at $99k.
Deal economics
- At list price, monthly cash flow is $470 ($6k/yr) — positive.
- The deal already cash-flows at list — no discount required.
- Meets the 1% rule at list price ($1k rent vs $99k).
- Recommended offer: $93k (6.0% below list) — sets the bar for market timing.
- Cap rate 12.0% vs local median 6.6% in Akron — top-decile yield for the area; either an underpriced asset or a hidden risk that comps aren't pricing in. Stress-test before assuming the spread holds.
Location & tenants
- Location reads 81/100 on livability (#104 in OH, #1,591 nationally) — a professional / high-income tenant draw. Strengths: amenities A+, commute A+, cost of living A+; Watch: crime F, employment F.
- Akron City (urban): math 22% / reading 30% proficiency, ranked #602 of 656 in OH (top 92%) — low school quality limits family demand, transient renter base, plan for 1-2y turnover; 66% free/reduced lunch — lower-income household profile, screen leases tightly.
- Market conditions: 54 active listings in the ZIP; 25 comparable units currently listed for rent nearby; rentals lingering (median 44d on market — plan ~5-8 weeks vacancy on turnover, expect pricing pressure); 64% of comp listings sitting > 30 days — soft ceiling on asking rent; lower-income renter base — watch delinquency; 1,114 units permitted in Summit County in 2024 (397 in 5+ unit buildings).
- At $1,478/mo this rent would consume 73% of the median local household income ($24k/yr) (locally 659% of renters already pay >50% of income on rent) — very limited rent-growth headroom before tenants either downsize or default.
Forward outlook
- Local home prices are declining (-3.0%/yr); year-one equity from $682 of loan paydown is wiped out by about $3k of value loss. Plan a longer hold.
- Summit County population projected to shrink 6% by 2050 — rents likely to lag national; underwrite the cash flow, not the appreciation.
- At projected returns (-3.0% appreciation + 3.0% rent growth), your $28k cash investment doubles in ~6 years — after that, you're playing with house money.
Negotiation context
- It's been on market 78 days — a 6% lower offer ($93k) is reasonable based on typical stale-listing flexibility.
- 6 sale attempts since 34y ago with the ask held roughly flat each time — persistent listings suggest the price (not the market) is what's stuck; bring a comps-based counter.
- Current owner paid $56k; list at $99k implies a 76% gain — meaningful room to come down on a strong offer.
Risks & watch-outs
- Watch-outs: built in 1928 — expect roof / HVAC / electrical / plumbing capex.
Questions for the listing agent
- It's been on market 78 days. Have you received any prior offers? Is the seller open to a 6% concession, seller financing, or rate buy-down credit?
- Built in 1928 — when were the roof, HVAC, electrical panel, plumbing, and water heater last replaced?
- Why hasn't it sold? Are there any deal-killer items the seller is aware of (foundation, flood, title, zoning, code violations)?
- Is there a deadline driving the sale (1031 exchange, divorce, estate, relocation)? That informs how much negotiation room exists.
- Crime grade is F in this area — have there been break-ins, vandalism, or insurance claims at this property in the last 3 years? What carrier currently insures it and at what premium?
- What's the average days-on-market for RENTAL listings here right now (not sales)? A rising rental-DOM trend means longer vacancies and softer asking-rent achievability than the comps imply.
- What's the recent tenant-quality profile in this submarket — average credit score on applications, eviction rate, late-payment / NSF rate, and stable-employment percentage? A property-management company in the area should have these aggregated.
- How much new for-sale + rental construction is in the pipeline within 1–3 miles? Heavy new supply typically softens prices + rents 12–24 months out; constrained supply supports both.
Investment metrics
- 1% rule
- 1.50% ✓
- Cap rate
- 12.01%
- Cash-on-cash
- 20.42%
- DSCR
- 1.91
- GRM
- 5.6
CMA / ARV
- ARV (median comp)
- $93,107
- List price
- $98,700
- Delta
- 6.01%
- Verdict
- FAIR
- Comps
- 20 within 1.0 mi
Show comp detail 6 sales within ~0.75 mi
| Address | Dist | Beds/Ba | Sqft | Sold | Price | $/sf | Match |
|---|---|---|---|---|---|---|---|
| 916 Kling St | 0.21mi | 4/1.5 (-1) | 1,728 (-7%) | 10mo | $118,000 | $68 | 62 |
| 1033 Herberich Ave | 0.15mi | 4/2.0 (-1) | 1,619 (-13%) | 4mo | $142,000 | $88 | 58 |
| 1258 Wilbur Ave | 0.56mi | 4/2.0 (-1) | 1,769 (-5%) | 8mo | $61,500 | $35 | 49 |
| 847 5th Ave | 0.65mi | 4/1.0 (-1) | 1,798 (-4%) | 12mo | $121,500 | $68 | 49 |
| 354 E Crosier | 0.46mi | 4/1.0 (-1) | 1,600 (-14%) | 16mo | $70,000 | $44 | 37 |
| 824 Concord Ave | 0.62mi | 4/2.0 (-1) | 1,983 (+6%) | 18mo | $150,000 | $76 | 37 |
Match score weights: distance 35% · size 25% · config 20% · recency 20%. Top-matched comps best support the ARV.
Projected returns pro-forma
-3.0% appreciation · 3.0% rent growth · sell at horizon
- IRR
- 12.7%
- Equity multiple
- 1.51×
- Total profit
- $13,997
- Equity at exit
- $14,716
- IRR
- 21.6%
- Equity multiple
- 2.84×
- Total profit
- $50,893
- Equity at exit
- $8,534
Cash invested: $27,636 (down + closing). Projections, not guarantees.
Landlord ↔ Tenant lean methodology
- Overall (STATE)
- 73 Landlord-Friendly
- State Ohio
- 73 Landlord-Friendly · R+6
- County
- — inherits STATE
- City
- — inherits STATE
ZIP-level market 44311
- Home prices YoY
- -28.4%
- Active inventory
- 54
- Price-to-rent
- 5.6×
Monthly cashflow live
- Estimated rent
- $1,478 high interval (Pro) →
- Mortgage (P&I)
- −$518
- Tax from tax record
- −$138 /mo · $1,662/yr
- Insurance
- −$41
- HOA
- −$0
- Vacancy / Maint / Mgmt
- −$310
- Net cashflow
- $470
Break-even live
UW: 25.0% down · 7.5% · 30yr · 1.5% tax · 5.0% vac · 8.0% maint · 8.0% mgmt
Financing live
Cash to close
- Down payment
- $24,675
- Closing costs
- $2,961
- Reserves months
- —
- Total cash needed
- —
Loan-product check · same deal, 3 products live
Conventional
25% down · 7.5% · 30yr
- Down + closing
- —
- Monthly P&I
- —
- Monthly cashflow
- —
- DSCR
- —
- Eligible?
- —
Personal DTI + credit; lowest rate.
DSCR
20% down · 8.5% · 30yr
- Down + closing
- —
- Monthly P&I
- —
- Monthly cashflow
- —
- DSCR
- —
- Eligible?
- —
No personal income docs; deal must DSCR.
Hard money
10% down · 12.0% · 12mo
- Down + closing
- —
- Monthly P&I
- —
- Monthly cashflow
- —
- DSCR
- —
- Eligible?
- —
Short-term bridge; refi at stabilization.
Rent comps 25 comps
| Address | Beds | Baths | Sqft | Rent | $/sqft | DOM | Units | Dist |
|---|---|---|---|---|---|---|---|---|
| 1012 Brown St Akron, OH | 4.0 | 2.0 | 1518 | $1,295 | $0.85 | 43d | 1 | 0.09mi |
| 885 Brown St Akron, OH | 4.0 | 2.0 | 1280 | $1,400 | $1.09 | 23d | 1 | 0.19mi |
| 1028 Kling St Akron, OH | 4.0 | 2.0 | 1500 | $1,450 | $0.97 | 43d | 1 | 0.19mi |
| 1040 Neptune Ave Akron, OH | 4.0 | 1.0 | 1400 | $1,300 | $0.93 | 43d | 1 | 0.22mi |
| 1085 Herberich Ave Akron, OH | 4.0 | 1.0 | 1350 | $1,400 | $1.04 | 43d | 1 | 0.22mi |
| 466 Adkins Ave Akron, OH | 4.0 | 1.5 | 1800 | $1,450 | $0.81 | 43d | 1 | 0.28mi |
| 1114 Herberich Ave Akron, OH | 4.0 | 1.0 | 1308 | $1,200 | $0.92 | 43d | 1 | 0.29mi |
| 768 Beardsley St Akron, OH | 5.0 | 1.5 | 1714 | $1,500 | $0.88 | 14d | 1 | 0.48mi |
| 1139 Marcy St Akron, OH | 4.0 | 1.5 | 1300 | $1,300 | $1.00 | 43d | 1 | 0.59mi |
| 1282 Andrus St Akron, OH | 4.0 | 1.0 | 1242 | $1,195 | $0.96 | 43d | 1 | 0.71mi |
| 373 N Firestone Blvd Akron, OH | 4.0 | 1.5 | 1590 | $1,550 | $0.97 | 43d | 1 | 0.74mi |
| 432 N Firestone Blvd Unit 1496097P Akron, OH | 4.0 | 2.0 | 1926 | $6,253 | $3.25 | 21d | 1 | 0.74mi |
| 548 Spicer St Akron, OH | 4.0 | 2.0 | 1487 | $1,100 | $0.74 | 23d | 1 | 0.79mi |
| 1368 Moore St Akron, OH | 4.0 | 1.0 | 1575 | $1,300 | $0.83 | 43d | 1 | 0.82mi |
| 516 Whitney Ave Akron, OH | 4.0 | 2.0 | 1676 | $1,500 | $0.89 | 43d | 1 | 0.83mi |
| 600 Sherman St Akron, OH | 4.0 | 1.0–2.0 | 824 | $1,600 | $1.94 | 14d | 14 | 0.90mi |
| 435 Margaret St Akron, OH | 4.0 | 2.0 | 1900 | $1,450 | $0.76 | 43d | 1 | 0.91mi |
| 288 Cross St Akron, OH | 4.0 | 2.0 | 1512 | $1,295 | $0.86 | 43d | 1 | 0.93mi |
| 490 Gage St Akron, OH | 4.0 | 1.0 | 1326 | $1,053 | $0.79 | 43d | 1 | 0.96mi |
| 488 Alexander St Akron, OH | 4.0 | 2.0 | 1311 | $1,350 | $1.03 | 23d | 1 | 1.03mi |
| 78 E Mapledale Ave Akron, OH | 4.0 | 1.5 | 1600 | $1,500 | $0.94 | 14d | 1 | 1.04mi |
| 497 Sumner St Akron, OH | 5.0 | 2.0 | 1776 | $1,295 | $0.73 | 43d | 1 | 1.05mi |
| 1070 Super Genius Cir Akron, OH | 2.0–4.0 | 1.0–2.0 | 1145 | $1,429 | $1.25 | 14d | 1 | 1.09mi |
| 497 Lucy St Akron, OH | 4.0 | 1.0 | 1600 | $1,500 | $0.94 | 43d | 1 | 1.14mi |
| 1076 Ackley St Akron, OH | 4.0 | 2.0 | 1998 | $2,000 | $1.00 | 14d | 1 | 1.22mi |
Listing history 31 events
-
2026-06-18days on market $98,700 Active 78 DOM
-
2026-06-17days on market $98,700 Active 77 DOM
-
2026-06-16days on market $98,700 Active 76 DOM
-
2026-06-15days on market $98,700 Active 75 DOM
-
2026-06-14days on market $98,700 Active 73 DOM
-
2026-06-13days on market $98,700 Active 72 DOM
-
2026-06-10days on market $98,700 Active 70 DOM
-
2026-06-09days on market $98,700 Active 69 DOM
-
2026-06-08days on market $98,700 Active 68 DOM
-
2026-06-07days on market $98,700 Active 67 DOM
-
2026-06-05days on market $98,700 Active 64 DOM
-
2026-06-03days on market $98,700 Active 63 DOM
-
2026-06-02days on market $98,700 Active 62 DOM
-
2026-06-01days on market $98,700 Active 61 DOM
-
2026-05-31days on market $98,700 Active 60 DOM
-
2026-05-31days on market $98,700 Active 59 DOM
-
2026-04-01$98,700 Active 319-char remark
Show marketing remark (319 chars)
Unlock the potential of this spacious 1920s gem! With five large bedrooms and a flexible layout, there is plenty of room to modernize and add value. It’s a classic home with a solid foundation, just waiting for a creative renovation to bring it into the modern era. Sold as-is—perfect for your next project!
-
2026-02-25historical
-
2026-02-17price $98,900
-
2025-08-25$109,000 Active
-
2004-11-23soldstatus $56,000
-
2003-05-15historical
-
2003-02-08$74,800
-
2002-11-15historical
-
2002-08-02$77,800
-
1994-06-25historical
-
1993-09-09$42,800
-
1993-07-31historical
-
1992-09-01$48,800
-
1987-09-11soldstatus $18,000
-
1983-02-25soldstatus $17,000
ⓘ Source: listings_history table (triggers on properties + properties_extension) + one-shot
backfill from property_details.listing_events for pre-trigger history.
Tax reassessment forecast OH · Partial reset (capped growth)
- Current annual tax
- $1,662 · $138/mo
- Projected year-2 tax
- $1,662 · $138/mo
- Expected delta
- $0/yr ($0/mo · 0.0%)
ⓘ Screening estimate from a state-policy table — verify with the county assessor before closing.
Climate risk First Street
- Flood 1/10 Low FEMA zone X (unshaded) · 0% chance over 30 yrs
- Wildfire 1/10 Low
- Heat 3/10 Moderate 7 d/yr ≥96°F today · 16 d/yr by 30 yrs out
- Wind 1/10 Low
- Air quality 3/10 Moderate 2 unhealthy d/yr today · 4 by 30 yrs out
Nearby sold comps map
Loading sold comps map…
Walkable amenities ~0.75 mi
Loading nearby amenities…
Taxation est. · year 1
- Rental income
- $17,736
- − Mortgage interest
- −$5,529
- − Property taxes
- −$1,662
- − Insurance
- −$494
- − Repairs & maintenance
- −$1,419
- − Management
- −$1,419
- − Depreciation
- −$2,871
- Taxable income
- $4,342
- Est. tax owed @ 24.0%
- −$1,042
- After-tax cash flow
- $4,602/yr
For passive investors: Depreciation is non-cash, so a rental often shows a tax loss while cash-flowing — sheltering income. Rental losses are passive: they offset passive income freely, and up to $25,000/yr can offset ordinary (W-2) income if you actively participate and your MAGI is under $100k (phasing out to $0 by $150k); unused losses carry forward. On sale, claimed depreciation is recaptured at up to 25%, and gains may owe capital-gains tax (a 1031 exchange can defer both). Figures are a year-1 estimate at your 24.0% rate — not tax advice; consult a CPA.
Schools (NCES district)
- District
- Akron City
- NCES district ID
- 3904348
- Math proficiency
- 22% ▼ -17.00%
- Reading proficiency
- 30% ▼ -12.00%
- Median HH income
- $33,811
- Composite
- 21.31/100
- National rank
- #8383
- State rank
- #602 of 656 in OH
Livability — Akron
- Score
- 81/100
- State rank
- #104
- US rank
- #1591
Category grades
Schools grade is shown separately in the Schools card above.
Census & demographics
- Census place
- Akron, OH
- County
- Summit County · 440,783 people
- City population
- 174,375
- Metro
- Akron, OH
- Population (ZIP)
- 7,547
- Household income
- $24,369
- Rent vs Own
- Severe rent burden
- 659.0
Population outlook (Summit County) Hauer SSP2
- Today (2025)
- 546,583 people
- By 2030
- 544,028 · -0.5%
- By 2040
- 531,363 · -2.8%
- By 2050
- 514,923 · -5.8%
- By 2075
- 481,765 · -11.9%
- By 2100
- 432,265 · -20.9%
Race, ethnicity, and origin ACS 2023
- Neighborhood character
- Diverse neighborhood (Simpson 0.60)
- Race & ethnicity
- White 53% Black 35% Two or more races 6% Hispanic / Latino 4% Asian 3%
- Common ancestry
- Lithuanian 2% Romanian 2% Slovak 2%
- Foreign-born
- 3% · Canada, Vietnam, Philippines
- Languages at home
- 95% English-only · Spanish 2% Other Asian/Pacific 1% Other Indo-European 1%
Political lean MEDSL · Summit
- 2024 margin
- Lean D (+7.0) · D 53.0% · R 46.0%
- 2008→2024 swing
- -9.6pp toward R · 2008: 16.6pp · 2024: 7.0pp
- All cycles
- 2024: D+7.0 2020: D+9.6 2016: D+8.2 2012: D+14.8 2008: D+16.6
Not yet ingested
- Civics
- —
Market trends
- HPI YoY
- ▼ -39.01%
- Current HPI
- 98.3809
- Rent YoY
- —
- Metro
- Akron, OH
- State GDP YoY
- ▲ 1.98%
- F500 in state
- 48
Industry mix (Fortune 500 HQ in OH)
| Industry | F500 HQs | Revenue |
|---|---|---|
| Insurance | 3 | $145B |
|
||
| Industrial Machinery | 3 | $49B |
|
||
| Financial Services | 3 | $24B |
|
||
| Consumer Goods | 2 | $93B |
|
||
| Aerospace / Defense | 2 | $47B |
|
||
| Utilities | 2 | $33B |
|
||
Price history
+480.6% since first listed15 events — show timeline
- 2026-04-01 Listed $98,700 MLSNOW
- 2026-02-25 Listing Removed — MLSNOW
- 2026-02-17 Price Changed $98,900 MLSNOW
- 2025-08-25 Listed $109,000 MLSNOW
- 2004-11-23 Sold (Public Records) $56,000 Public Records
- 2003-05-15 Listing Removed — MLSNOW
- 2003-02-08 Listed $74,800 MLSNOW
- 2002-11-15 Listing Removed — MLSNOW
- 2002-08-02 Listed $77,800 MLSNOW
- 1994-06-25 Listing Removed — MLSNOW
- 1993-09-09 Listed $42,800 MLSNOW
- 1993-07-31 Listing Removed — MLSNOW
- 1992-09-01 Listed $48,800 MLSNOW
- 1987-09-11 Sold (Public Records) $18,000 Public Records
- 1983-02-25 Sold (Public Records) $17,000 Public Records
Property tax history
+2.9%/yrLatest (2025): $1,662 · +28.9% YoY. Source: county tax records.
Cash-flow waterfall
monthlySold comps — $/sqft
last 12 mo · ≤1 miLoading sold comps…