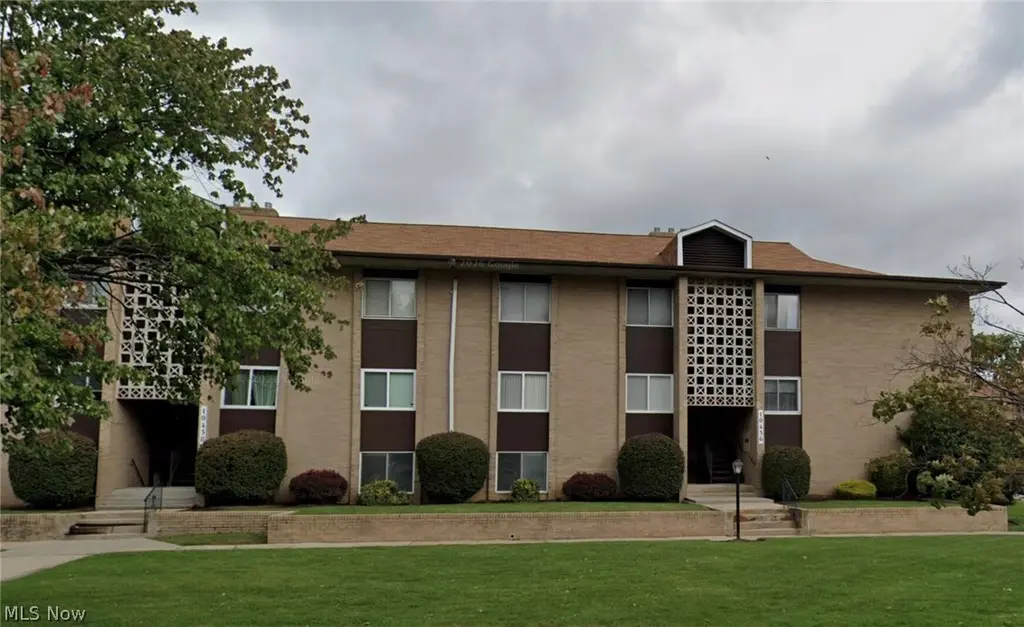
10436 N Church Dr #202 · Parma Heights, OH
Flood risk No data
- FEMA flood zone
- —
- Chance of flooding over 30 yrs
- —
- Est. flood insurance / yr
- —
Fire risk No data
- Est. fire insurance / yr
- —
Heat risk No data
- Hot days now (above threshold)
- —
- Hot days in 30 yrs
- —
Wind risk No data
- Chance of severe wind over 30 yrs
- —
Air-quality risk No data
- Unhealthy air days now
- —
- Unhealthy air days in 30 yrs
- —
Risk factors via First Street. Map © Google.
Why this score? — see what drove the D grade
The composite is a weighted blend of 9 inputs, each scored 0–100. Each bar is that input's sub-score; the figure is the points it added to the 100-point composite (weight × sub-score).
- ARV discount +11.2/15.0
- Cash flow +9.6/30.0
- 1% rule +5.9/10.0
- Schools +4.1/10.0
- Livability +3.6/5.0
- Rent growth +3.2/5.0
- DSCR +2.7/10.0
- Condition / age +2.5/5.0
- Appreciation +0.0/10.0
$90,900
🖨 Deal sheet (PDF) 📄 Offer letter ✓ Due diligence
Listing remarks MLS
Welcome to this well-maintained condo in Parma Heights offering a functional layout and comfortable living space. This unit features a spacious living area with access to natural light, a designated dining space, and a practical kitchen setup with ample cabinetry. The bedroom is generously sized with great closet space, and the full bathroom maintains its original character while remaining clean and functional. Being sold as-is. Furnace has been professionally cleaned and the motor recently replaced, providing added value for the next owner. Conveniently located near shopping, dining, and major highways, this property presents a strong opportunity for owner-occupants.
Key facts
- Ample cabinetry
- Spacious living area
- Great closet space
Tags
Neighborhood map
What this means for you Summary
Snapshot
- This is a 1-bed/1.0-bath condo listed at $91k.
Deal economics
- At list price, monthly cash flow is $-62 ($-748/yr) — negative.
- To cash-flow at today's rent, offer at most $80k (12.1% below list).
- Meets the 1% rule at list price ($994 rent vs $91k).
- Recommended offer: $80k (12.1% below list) — sets the bar for cash-flow.
Location & tenants
- Location reads 72/100 on livability (#362 in OH) — a middle-class / working-renter tenant base. Strengths: crime A+, cost of living A+, housing A+; Watch: employment C-, amenities D-, commute F.
- Parma City (suburban): math 43% / reading 52% proficiency, ranked #469 of 656 in OH (top 72%) — families likely to look elsewhere, expect single-tenant / working-renter base with shorter leases.
- Zoned schools: Pleasant Valley Elementary School (math 55% / reading 49%, grade C-, #851 of 1,584 statewide, top 56%, 722 students, 51% FRL); Greenbriar Middle School (math 39% / reading 50%, grade D, #477 of 654 statewide, top 74%, 800 students, 61% FRL); Valley Forge High School (math 32% / reading 44%, grade F, #560 of 781 statewide, top 72%, 1,409 students, 52% FRL).
- Market conditions: Rents rising (+2.7%/yr); 153 active listings in the ZIP; 8 comparable units currently listed for rent nearby; rentals leasing fast (median 0d on market — plan ~1-2 weeks tenant-placement turnaround); 1,441 units permitted in Cuyahoga County in 2024 (700 in 5+ unit buildings).
- This rent is only 17% of the median local income ($70k/yr) — well below the 30% rent-burden line; pricing power to push rent on renewal without tenant pushback.
Forward outlook
- Local home prices are declining (-3.0%/yr); year-one equity from $628 of loan paydown is wiped out by about $3k of value loss. Plan a longer hold.
- Cuyahoga County population projected to shrink 8% by 2050 — rents likely to lag national; underwrite the cash flow, not the appreciation.
Negotiation context
- It's been on market 52 days — a 3% lower offer ($88k) is reasonable based on typical stale-listing flexibility.
- 3 sale attempts since 15y ago with the ask held roughly flat each time — persistent listings suggest the price (not the market) is what's stuck; bring a comps-based counter.
- Current owner paid $65k; 40% above their basis — modest negotiation headroom, anchor on the comps not their cost.
Risks & watch-outs
- Watch-outs: HOA is 22% of rent.
Questions for the listing agent
- What do current leases actually rent for vs. the listed asking? Can we see a recent rent roll and the last 12 months of T-12 income?
- It's been on market 52 days. Have you received any prior offers? Is the seller open to a 12% concession, seller financing, or rate buy-down credit?
- Built in 1961 — when were the roof, HVAC, electrical panel, plumbing, and water heater last replaced?
- What does the HOA fee cover, when was the last increase, and are there any pending special assessments or reserve-fund shortfalls?
- Any open or pending special assessments — roof, HVAC, plumbing, elevator, façade? What's the per-unit balance and payoff schedule, and is the seller paying it off at close or rolling it to the buyer?
- Is there a deadline driving the sale (1031 exchange, divorce, estate, relocation)? That informs how much negotiation room exists.
- Schools are B-rated — typically a magnet for longer-tenancy family renters. What's the average tenant stay here, and is there a school-zone premium baked into asking?
- The area grade is low — what's the realistic commute time and amenity access for the typical tenant pool here? Any planned neighborhood developments (good or bad) we should know about?
- What's the average days-on-market for RENTAL listings here right now (not sales)? A rising rental-DOM trend means longer vacancies and softer asking-rent achievability than the comps imply.
- What's the recent tenant-quality profile in this submarket — average credit score on applications, eviction rate, late-payment / NSF rate, and stable-employment percentage? A property-management company in the area should have these aggregated.
- How much new apartment / multifamily construction is in the pipeline within 1–3 miles? Heavy new supply (>2% of stock underway) typically softens rents 12–24 months out; light construction supports rent growth.
Investment metrics
- 1% rule
- 1.09% ✓
- Cap rate
- 5.47%
- Cash-on-cash
- -2.94%
- DSCR
- 0.87
- GRM
- 7.6
CMA / ARV
- ARV (median comp)
- $99,010
- List price
- $90,900
- Delta
- -8.19%
- Verdict
- FAIR
- Comps
- 18 within 1.0 mi
Projected returns pro-forma
-3.0% appreciation · 2.69% rent growth · sell at horizon
- IRR
- -21.5%
- Equity multiple
- 0.26×
- Total profit
- $-18,859
- Equity at exit
- $13,553
- IRR
- -15.6%
- Equity multiple
- 0.13×
- Total profit
- $-22,185
- Equity at exit
- $7,859
Cash invested: $25,452 (down + closing). Projections, not guarantees.
Landlord ↔ Tenant lean methodology
- Overall (STATE)
- 73 Landlord-Friendly
- State Ohio
- 73 Landlord-Friendly · R+6
- County
- — inherits STATE
- City
- — inherits STATE
ZIP-level market 44130
- Rents YoY
- 2.7%
- Active inventory
- 153
- Price-to-rent
- 7.6×
Monthly cashflow live
- Estimated rent
- $994 high interval (Pro) →
- Mortgage (P&I)
- −$477
- Tax from tax record
- −$116 /mo · $1,393/yr
- Insurance
- −$38
- HOA
- −$217
- Vacancy / Maint / Mgmt
- −$209
- Net cashflow
- $-62
Break-even live
Sensitivity live
| Price | -10% $-11 | -5% $-37 | +0% $-62 | +5% $-88 | +10% $-114 |
|---|---|---|---|---|---|
| Rent | -10% $-141 | -5% $-102 | +0% $-62 | +5% $-23 | +10% $16 |
| Rate | -1.0pp $-17 | -0.5pp $-39 | base $-62 | +0.5pp $-86 | +1.0pp $-110 |
UW: 25.0% down · 7.5% · 30yr · 1.5% tax · 5.0% vac · 8.0% maint · 8.0% mgmt
Financing live
Cash to close
- Down payment
- $22,725
- Closing costs
- $2,727
- Reserves months
- —
- Total cash needed
- —
Loan-product check · same deal, 3 products live
Conventional
25% down · 7.5% · 30yr
- Down + closing
- —
- Monthly P&I
- —
- Monthly cashflow
- —
- DSCR
- —
- Eligible?
- —
Personal DTI + credit; lowest rate.
DSCR
20% down · 8.5% · 30yr
- Down + closing
- —
- Monthly P&I
- —
- Monthly cashflow
- —
- DSCR
- —
- Eligible?
- —
No personal income docs; deal must DSCR.
Hard money
10% down · 12.0% · 12mo
- Down + closing
- —
- Monthly P&I
- —
- Monthly cashflow
- —
- DSCR
- —
- Eligible?
- —
Short-term bridge; refi at stabilization.
Rent comps 8 comps
| Address | Beds | Baths | Sqft | Rent | $/sqft | DOM | Units | Dist |
|---|---|---|---|---|---|---|---|---|
| 6935 York Rd Parma Heights, OH | 1.0–2.0 | 1.0 | 642 | $855 | $1.33 | 0d | 11 | 0.46mi |
| 9235 N Church Dr Cleveland, OH | 1.0–3.0 | 1.0–2.0 | 814 | $860 | $1.06 | 0d | 62 | 0.57mi |
| 9231 Independence Blvd Cleveland, OH | 1.0 | 1.0 | 604 | $942 | $1.56 | 14d | 10 | 0.66mi |
| 6260 Pearl Rd Cleveland, OH | 1.0–2.0 | 1.0–2.0 | 950 | $1,205 | $1.27 | 3d | 17 | 0.69mi |
| 6340 Stumph Rd Cleveland, OH | 1.0–2.0 | 1.0–1.5 | 730 | $985 | $1.35 | 45d | 1 | 0.72mi |
| 6871 Ames Rd Cleveland, OH | 1.0–2.0 | 1.0 | 739 | $935 | $1.26 | 0d | 20 | 0.74mi |
| 6240 Stumph Rd Parma Heights, OH | 2.0 | 1.0 | 622 | $1,230 | $1.98 | 0d | 10 | 1.03mi |
| 5930 Stumph Rd Cleveland, OH | 1.0 | 1.0 | 742 | $1,272 | $1.71 | 0d | 5 | 1.47mi |
HOA detail condo
- Monthly dues
- $217 · $2,604/yr
- Assessments
- None detected in remarks — confirm with the listing agent.
Listing history 9 events
-
2026-04-04$90,900 Active 676-char remark
Show marketing remark (676 chars)
Welcome to this well-maintained condo in Parma Heights offering a functional layout and comfortable living space. This unit features a spacious living area with access to natural light, a designated dining space, and a practical kitchen setup with ample cabinetry. The bedroom is generously sized with great closet space, and the full bathroom maintains its original character while remaining clean and functional. Being sold as-is. Furnace has been professionally cleaned and the motor recently replaced, providing added value for the next owner. Conveniently located near shopping, dining, and major highways, this property presents a strong opportunity for owner-occupants.
-
2023-11-17soldstatus $65,000 Closed 160-char remark
Show marketing remark (160 chars)
PARMA HEIGHTS CONDOMINIUM, Georgetown Arms, Better than renting, own you own property at an extremely affordable price, 1 bedroom, appliances stay, central air,
-
2023-10-20status Pending 160-char remark
Show marketing remark (160 chars)
PARMA HEIGHTS CONDOMINIUM, Georgetown Arms, Better than renting, own you own property at an extremely affordable price, 1 bedroom, appliances stay, central air,
-
2023-10-12price $69,900 160-char remark
Show marketing remark (160 chars)
PARMA HEIGHTS CONDOMINIUM, Georgetown Arms, Better than renting, own you own property at an extremely affordable price, 1 bedroom, appliances stay, central air,
-
2023-10-05$72,500 Active 160-char remark
Show marketing remark (160 chars)
PARMA HEIGHTS CONDOMINIUM, Georgetown Arms, Better than renting, own you own property at an extremely affordable price, 1 bedroom, appliances stay, central air,
-
2011-03-16soldstatus $20,500
-
2011-01-31$22,300
-
2005-01-20soldstatus $44,000
-
1976-11-01soldstatus $18,500
ⓘ Source: listings_history table (triggers on properties + properties_extension) + one-shot
backfill from property_details.listing_events for pre-trigger history.
Tax reassessment forecast OH · Partial reset (capped growth)
- Current annual tax
- $1,393 · $116/mo
- Projected year-2 tax
- $1,406 · $117/mo
- Expected delta
- +$12/yr (+$1/mo · 0.9%)
ⓘ Screening estimate from a state-policy table — verify with the county assessor before closing.
Nearby sold comps map
Loading sold comps map…
Walkable amenities ~0.75 mi
Loading nearby amenities…
Taxation est. · year 1
- Rental income
- $11,929
- − Mortgage interest
- −$5,092
- − Property taxes
- −$1,393
- − Insurance
- −$454
- − Repairs & maintenance
- −$954
- − Management
- −$954
- − HOA
- −$2,604
- − Depreciation
- −$2,644
- Taxable loss
- −$2,167
- Est. tax savings @ 24.0%
- +$520
- After-tax cash flow
- $-228/yr
For passive investors: Depreciation is non-cash, so a rental often shows a tax loss while cash-flowing — sheltering income. Rental losses are passive: they offset passive income freely, and up to $25,000/yr can offset ordinary (W-2) income if you actively participate and your MAGI is under $100k (phasing out to $0 by $150k); unused losses carry forward. On sale, claimed depreciation is recaptured at up to 25%, and gains may owe capital-gains tax (a 1031 exchange can defer both). Figures are a year-1 estimate at your 24.0% rate — not tax advice; consult a CPA.
Schools (NCES district)
- District
- Parma City
- NCES district ID
- 3904463
- Math proficiency
- 43% ▼ -18.00%
- Reading proficiency
- 52% ▼ -10.00%
- Median HH income
- $50,371
- Composite
- 40.72/100
- National rank
- #3662
- State rank
- #469 of 656 in OH
Livability — Parma Heights
- Score
- 72/100
- State rank
- #362
- US rank
- #5875
Category grades
Schools grade is shown separately in the Schools card above.
Census & demographics
- Census place
- Parma Heights, OH
- County
- Cuyahoga County · 1,090,369 people
- City population
- 49,679
- Metro
- Cleveland-Elyria, OH
- Population (ZIP)
- 49,679
- Household income
- $69,655
- Rent vs Own
- Severe rent burden
- 1758.0
Population outlook (Cuyahoga County) Hauer SSP2
- Today (2025)
- 1,244,621 people
- By 2030
- 1,230,093 · -1.2%
- By 2040
- 1,189,108 · -4.5%
- By 2050
- 1,145,706 · -7.9%
- By 2075
- 1,076,557 · -13.5%
- By 2100
- 978,987 · -21.3%
Race, ethnicity, and origin ACS 2023
- Neighborhood character
- Predominantly White (78%)
- Race & ethnicity
- White 78% Black 8% Hispanic / Latino 6% Two or more races 6% Asian 4%
- Hispanic origin (detail)
- Mexican 2% Puerto Rican 3%
- Common ancestry
- Romanian 13% Lithuanian 2% Subsaharan African 2%
- Foreign-born
- 10% · Canada, India
- Languages at home
- 85% English-only · Other Indo-European 5% Spanish 3% Russian/Polish/Slavic 2%
Political lean MEDSL · Cuyahoga
- 2024 margin
- Solid D (+31.5) · D 65.4% · R 33.9%
- 2008→2024 swing
- -7.4pp toward R · 2008: 38.9pp · 2024: 31.5pp
- All cycles
- 2024: D+31.5 2020: D+34.1 2016: D+35.0 2012: D+38.7 2008: D+38.9
Not yet ingested
- Civics
- —
Market trends
- HPI YoY
- ▼ -231.10%
- Current HPI
- 188.8415
- Rent YoY
- ▲ 2.69%
- Metro
- Cleveland-Elyria, OH
- State GDP YoY
- ▲ 1.98%
- F500 in state
- 48
Industry mix (Fortune 500 HQ in OH)
| Industry | F500 HQs | Revenue |
|---|---|---|
| Insurance | 3 | $145B |
|
||
| Industrial Machinery | 3 | $49B |
|
||
| Financial Services | 3 | $24B |
|
||
| Consumer Goods | 2 | $93B |
|
||
| Aerospace / Defense | 2 | $47B |
|
||
| Utilities | 2 | $33B |
|
||
Price history
+391.4% since first listed9 events — show timeline
- 2026-04-04 Listed $90,900 MLSNOW
- 2023-11-17 Sold (MLS) $65,000 MLSNOW
- 2023-10-20 Pending — MLSNOW
- 2023-10-12 Price Changed $69,900 MLSNOW
- 2023-10-05 Listed $72,500 MLSNOW
- 2011-03-16 Sold (MLS) $20,500 MLSNOW
- 2011-01-31 Listed $22,300 MLSNOW
- 2005-01-20 Sold (Public Records) $44,000 Public Records
- 1976-11-01 Sold (Public Records) $18,500 Public Records
Property tax history
+1.0%/yrLatest (2025): $1,393 · -6.2% YoY. Source: county tax records.
Cash-flow waterfall
monthlySold comps — $/sqft
last 12 mo · ≤1 miLoading sold comps…