14856 Lovelace St · Pilot Point, TX
Flood risk No data
- FEMA flood zone
- —
- Chance of flooding over 30 yrs
- —
- Est. flood insurance / yr
- —
Fire risk No data
- Est. fire insurance / yr
- —
Heat risk No data
- Hot days now (above threshold)
- —
- Hot days in 30 yrs
- —
Wind risk No data
- Chance of severe wind over 30 yrs
- —
Air-quality risk No data
- Unhealthy air days now
- —
- Unhealthy air days in 30 yrs
- —
Risk factors via First Street. Map © Google.
Why this score? — see what drove the D- grade
The composite is a weighted blend of 9 inputs, each scored 0–100. Each bar is that input's sub-score; the figure is the points it added to the 100-point composite (weight × sub-score).
- ARV discount +15.0/15.0
- Cash flow +7.4/30.0
- Schools +5.0/10.0
- Livability +3.3/5.0
- Rent growth +2.5/5.0
- Condition / age +2.5/5.0
- 1% rule +2.4/10.0
- DSCR +1.6/10.0
- Appreciation +0.0/10.0
$336,299
🖨 Deal sheet (PDF) 📄 Offer letter ✓ Due diligence
Listing remarks
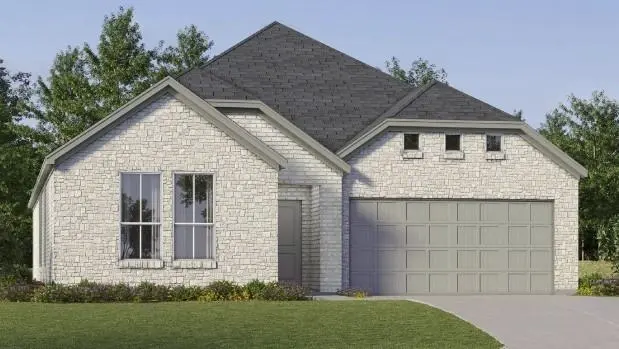
This new home offers simple living with a convenient single-level layout. An open-concept floorplan combines the kitchen, living and dining areas for simple entertaining and multitasking. Three secondary bedrooms and an office are tucked away to the side of the home, and the owner’s suite is nestled into a private rear corner, offering access to a spa-inspired bathroom and walk-in closet.
Key facts
- Walk-in closet
- Single-level layout
- 4,400 sq ft lot
Tags
Property features AI
Finance
- Other: Property in a municipal utility district; Energy-efficient features throughout (appliances, construction, doors, insulation, low-flow commode, rain/freeze sensors, thermostat, water heater, windows)
- Financial info: Accepts Cash, Conventional, FHA, USDA Loan, VA Loan; Second mortgage: No
- HOA & community: Mandatory association; Annual association fee of 850 (fee covers full use of facilities); HOA managed by Essex
Exterior
- Parking: Attached 2-car garage (garage faces front); 2 covered parking spaces
- Security: Smoke detector(s); Carbon monoxide detector(s)
- Utilities: MUD water; MUD sewer; Sidewalk
- Home design: Single family residence; Residential property; One story; New construction (incomplete, year built 2026); Not attached to another property
- Construction: Brick, frame, rock/stone, and siding exterior materials; Composition roof; Slab foundation
- Exterior features: Covered porch(es); Covered patio/porch; Wood fencing; Landscaped yard; Automatic sprinkler system
Interior
- Kitchen: Dishwasher; Disposal; Gas cooktop; Gas range; Microwave; Natural stone/granite counters; Walk-in pantry; Water line to refrigerator; Plumbed for gas in kitchen
- Bedrooms: 4 bedrooms all on the main level; Primary bedroom on the main level with walk-in closet
- Flooring: Carpet; Luxury vinyl plank
- Bathrooms: 2 full bathrooms
- Heating & cooling: Central heating (ENERGY STAR qualified equipment); Central air conditioning (ENERGY STAR qualified equipment)
- Interior features: Open floorplan; Built-in features; Decorative lighting; Cable TV available; High-speed internet available; Pantry; Walk-in closet(s); One living area; One dining area; Room count: 8; Levels: One
- Laundry & utility: Washer hookup; Electric dryer hookup
Neighborhood map
What this means for you Summary
Snapshot
- This is a 4-bed/2.0-bath single-family listed at $336k.
Deal economics
- At list price, monthly cash flow is $-432 ($-5k/yr) — negative.
- To cash-flow at today's rent, offer at most $274k (18.6% below list).
- To meet the 1% rule (rent ≥ 1% of price), the offer needs to be $248k (26.1% below list).
- Recommended offer: $248k (26.1% below list) — sets the bar for 1% rule.
Location & tenants
- Location reads 66/100 on livability (#613 in TX) — a middle-class / working-renter tenant base. Strengths: crime A+, cost of living A+, housing A+; Watch: employment C-, amenities F, commute F.
- Celina ISD (rural): math 50% / reading 61% proficiency, ranked #71 of 826 in TX (top 9%) — acceptable for families but not a draw, mixed tenant base, ~2y average lease.
- Zoned schools: Marcy B Lykins El (math 38% / reading 50%, grade F, #1,243 of 4,322 statewide, top 29%, 708 students, 22% FRL); Jerry & Linda Moore Middle (math 56% / reading 60%, grade B, #197 of 1,662 statewide, top 12%, 903 students, 20% FRL); Celina H S (math 44% / reading 72%, grade C, #320 of 1,632 statewide, top 20%, 1,074 students, 18% FRL).
- Market conditions: 491 active listings in the ZIP; 29 comparable units currently listed for rent nearby; rentals at typical pace (median 19d on market — plan ~3-4 weeks tenant-placement turnaround); 10,531 units permitted in Denton County in 2024 (2,713 in 5+ unit buildings).
Forward outlook
- Local home prices are declining (-3.0%/yr); year-one equity from $2k of loan paydown is wiped out by about $10k of value loss. Plan a longer hold.
- Denton County population projected at +66% by 2050 — long-run rental-demand tailwind backs the buy-and-hold thesis.
Negotiation context
- Only 14 days on market — expect competitive offers; lowballing is unlikely to land.
Questions for the listing agent
- What do current leases actually rent for vs. the listed asking? Can we see a recent rent roll and the last 12 months of T-12 income?
- What does the HOA fee cover, when was the last increase, and are there any pending special assessments or reserve-fund shortfalls?
- Is there a deadline driving the sale (1031 exchange, divorce, estate, relocation)? That informs how much negotiation room exists.
- Schools are D-rated, which usually means shorter tenancies and higher turnover. Who's the typical renter profile here, and what's been the actual vacancy rate?
- The area grade is low — what's the realistic commute time and amenity access for the typical tenant pool here? Any planned neighborhood developments (good or bad) we should know about?
- What's the average days-on-market for RENTAL listings here right now (not sales)? A rising rental-DOM trend means longer vacancies and softer asking-rent achievability than the comps imply.
- What's the recent tenant-quality profile in this submarket — average credit score on applications, eviction rate, late-payment / NSF rate, and stable-employment percentage? A property-management company in the area should have these aggregated.
- How much new for-sale + rental construction is in the pipeline within 1–3 miles? Heavy new supply typically softens prices + rents 12–24 months out; constrained supply supports both.
Investment metrics
- 1% rule
- 0.74% ✗
- Cap rate
- 4.75%
- Cash-on-cash
- -5.51%
- DSCR
- 0.76
- GRM
- 11.3
CMA / ARV
- ARV (median comp)
- $448,338
- List price
- $336,299
- Delta
- -24.99%
- Verdict
- UNDERPRICED
- Comps
- 20 within 1.0 mi
Show comp detail 12 sales within ~0.75 mi
| Address | Dist | Beds/Ba | Sqft | Sold | Price | $/sf | Match |
|---|---|---|---|---|---|---|---|
| 14550 Flossie St | 0.47mi | 4/3.0 | 2,140 (+4%) | 2mo | $399,990 | $187 | 66 |
| 5715 Smiley Rd | 0.37mi | 4/2.0 | 1,850 (-10%) | 2mo | $850,000 | $459 | 64 |
| 5863 Anning Way | 0.44mi | 4/3.0 | 2,098 (+2%) | 12mo | $445,000 | $212 | 63 |
| 14549 Flossie St | 0.45mi | 4/2.0 | 1,866 (-10%) | 1mo | $389,990 | $209 | 62 |
| 14551 Elion Ct | 0.51mi | 4/3.0 | 2,192 (+6%) | 2mo | $399,940 | $182 | 60 |
| 14426 Mcclint St | 0.70mi | 4/3.0 | 2,103 (+2%) | 1mo | $398,000 | $189 | 60 |
| 14498 Lovelace St | 0.55mi | 4/3.0 | 1,944 (-6%) | 5mo | $359,990 | $185 | 57 |
| 5917 Mayer Ave | 0.61mi | 3/2.0 (-1) | 1,991 (-3%) | 6mo | $334,990 | $168 | 56 |
| 14441 Mietner St | 0.69mi | 3/2.0 (-1) | 1,991 (-3%) | 5mo | $349,990 | $176 | 53 |
| 14498 Herschel St | 0.55mi | 3/2.5 (-1) | 2,240 (+9%) | 3mo | $444,950 | $199 | 50 |
| 14505 Lovelace St | 0.53mi | 4/3.0 | 2,333 (+13%) | 1mo | $424,000 | $182 | 48 |
| 14446 Mcclint St | 0.68mi | 4/3.0 | 1,944 (-6%) | 14mo | $393,905 | $203 | 43 |
Match score weights: distance 35% · size 25% · config 20% · recency 20%. Top-matched comps best support the ARV.
Projected returns pro-forma
-3.0% appreciation · 3.0% rent growth · sell at horizon
- IRR
- -25.7%
- Equity multiple
- 0.13×
- Total profit
- $-81,927
- Equity at exit
- $50,143
- IRR
- -22.0%
- Equity multiple
- -0.13×
- Total profit
- $-106,439
- Equity at exit
- $29,077
Cash invested: $94,164 (down + closing). Projections, not guarantees.
Landlord ↔ Tenant lean methodology
- Overall (STATE)
- 87 Strongly Landlord-Friendly
- State Texas
- 87 Strongly Landlord-Friendly · R+5
- County
- — inherits STATE
- City
- — inherits STATE
ZIP-level market 76258
- Home prices YoY
- -7.9%
- Active inventory
- 491
- Price-to-rent
- 11.3×
Monthly cashflow live
- Estimated rent
- $2,485 high interval (Pro) →
- Mortgage (P&I)
- −$1,764
- Tax est. 1.5%
- −$420 /mo · $5,044/yr
- Insurance
- −$140
- HOA
- −$71
- Vacancy / Maint / Mgmt
- −$522
- Net cashflow
- $-432
Break-even live
Sensitivity live
| Price | -10% $-200 | -5% $-316 | +0% $-432 | +5% $-548 | +10% $-664 |
|---|---|---|---|---|---|
| Rent | -10% $-628 | -5% $-530 | +0% $-432 | +5% $-334 | +10% $-236 |
| Rate | -1.0pp $-263 | -0.5pp $-346 | base $-432 | +0.5pp $-519 | +1.0pp $-608 |
UW: 25.0% down · 7.5% · 30yr · 1.5% tax · 5.0% vac · 8.0% maint · 8.0% mgmt
Financing live
Cash to close
- Down payment
- $84,075
- Closing costs
- $10,089
- Reserves months
- —
- Total cash needed
- —
Loan-product check · same deal, 3 products live
Conventional
25% down · 7.5% · 30yr
- Down + closing
- —
- Monthly P&I
- —
- Monthly cashflow
- —
- DSCR
- —
- Eligible?
- —
Personal DTI + credit; lowest rate.
DSCR
20% down · 8.5% · 30yr
- Down + closing
- —
- Monthly P&I
- —
- Monthly cashflow
- —
- DSCR
- —
- Eligible?
- —
No personal income docs; deal must DSCR.
Hard money
10% down · 12.0% · 12mo
- Down + closing
- —
- Monthly P&I
- —
- Monthly cashflow
- —
- DSCR
- —
- Eligible?
- —
Short-term bridge; refi at stabilization.
Rent comps 29 comps
| Address | Beds | Baths | Sqft | Rent | $/sqft | DOM | Units | Dist |
|---|---|---|---|---|---|---|---|---|
| 5928 Mustang Creek Ln Celina, TX | 3.0 | 2.5 | 1900 | $2,395 | $1.26 | 14d | 1 | 1.04mi |
| 16309 Garden Dr Celina, TX | 3.0 | 2.0 | 1803 | $2,450 | $1.36 | 45d | 1 | 1.11mi |
| 6108 Shasta Creek Rd Celina, TX | 4.0 | 2.5 | 2123 | $2,700 | $1.27 | 14d | 1 | 1.13mi |
| 6108 Shasta Creek Rd Celina, TX | 4.0 | 2.5 | 2123 | $2,650 | $1.25 | 7d | 1 | 1.13mi |
| 6124 Shasta Creek Rd Celina, TX | 4.0 | 3.0 | 2183 | $2,595 | $1.19 | 5d | 1 | 1.14mi |
| 6109 White Creek Dr Celina, TX | 4.0 | 3.0 | 2168 | $2,899 | $1.34 | 4d | 1 | 1.16mi |
| 16629 Freshwater Dr Celina, TX | 4.0 | 3.0 | 2211 | $2,600 | $1.18 | 26d | 1 | 1.18mi |
| 5901 Maddie Ann Dr Celina, TX | 4.0 | 4.0 | 2932 | $3,895 | $1.33 | 9d | 1 | 1.18mi |
| 16625 Hidden Cove Dr Celina, TX | 4.0 | 2.0 | 1962 | $2,495 | $1.27 | 26d | 1 | 1.21mi |
| 6246 Shasta Creek Rd Celina, TX | 4.0 | 3.0 | 2182 | $2,695 | $1.24 | 0d | 1 | 1.22mi |
| 14221 Donahue St Pilot Point, TX | 5.0 | 3.0 | 2609 | $2,499 | $0.96 | 20d | 1 | 1.23mi |
| 14220 Aberavon Dr Pilot Point, TX | 3.0 | 2.0 | 1654 | $2,099 | $1.27 | 5d | 1 | 1.23mi |
| 14216 Aberavon Dr Pilot Point, TX | 3.0 | 2.0 | 1801 | $2,195 | $1.22 | 45d | 1 | 1.24mi |
| 14216 Aberavon Dr Pilot Point, TX | 3.0 | 2.0 | 1801 | $2,135 | $1.19 | 14d | 1 | 1.24mi |
| 6249 White Creek Dr Celina, TX | 4.0 | 3.0 | 2168 | $2,495 | $1.15 | 12d | 1 | 1.26mi |
| 6113 Tahoe Winds Dr Celina, TX | 4.0 | 3.5 | 2174 | $2,800 | $1.29 | 26d | 1 | 1.26mi |
| 14115 Harden St Pilot Point, TX | 5.0 | 3.5 | 2534 | $2,790 | $1.10 | 45d | 1 | 1.32mi |
| 14122 Emeric St Pilot Point, TX | 4.0 | 3.0 | 2247 | $2,500 | $1.11 | 26d | 1 | 1.32mi |
| 14184 Hammersmith St Pilot Point, TX | 4.0 | 2.0 | 2062 | $2,400 | $1.16 | 0d | 1 | 1.33mi |
| 14114 Donahue St Pilot Point, TX | 3.0 | 2.0 | 1499 | $2,200 | $1.47 | 19d | 1 | 1.36mi |
| 14153 Golden Bridge Dr Pilot Point, TX | 3.0 | 2.0 | 1516 | $1,895 | $1.25 | 18d | 1 | 1.36mi |
| 3304 Lake Palestine Rd Celina, TX | 4.0 | 3.0 | 2179 | $2,650 | $1.22 | 14d | 1 | 1.38mi |
| 14174 Inglebert St Pilot Point, TX | 3.0 | 2.0 | 1455 | $1,850 | $1.27 | 45d | 1 | 1.39mi |
| 14133 Calderwood St Pilot Point, TX | 3.0 | 2.0 | 1760 | $2,280 | $1.30 | 45d | 1 | 1.42mi |
| 14149 Danesdale Dr Pilot Point, TX | 4.0 | 2.5 | 2423 | $2,395 | $0.99 | 9d | 1 | 1.42mi |
| 14112 Hammersmith St Pilot Point, TX | 3.0 | 2.0 | 1520 | $1,895 | $1.25 | 20d | 1 | 1.43mi |
| 14112 Hammersmith St Pilot Point, TX | 3.0 | 2.0 | 1520 | $1,795 | $1.18 | 9d | 1 | 1.43mi |
| 5513 Deer Run Dr Celina, TX | 4.0 | 2.0 | 2009 | $3,000 | $1.49 | 45d | 1 | 1.45mi |
| 14121 Danesdale Dr Pilot Point, TX | 4.0 | 2.0 | 1664 | $2,000 | $1.20 | 45d | 1 | 1.47mi |
HOA detail
- Monthly dues
- $71 · $852/yr
Listing history 2 events
-
2026-05-11status Pending 397-char remark
-
2026-04-27$336,299 Active 397-char remark
ⓘ Source: listings_history table (triggers on properties + properties_extension) + one-shot
backfill from property_details.listing_events for pre-trigger history.
Nearby sold comps map
Loading sold comps map…
Walkable amenities ~0.75 mi
Loading nearby amenities…
Taxation est. · year 1
- Rental income
- $29,819
- − Mortgage interest
- −$18,838
- − Property taxes
- −$5,044
- − Insurance
- −$1,681
- − Repairs & maintenance
- −$2,386
- − Management
- −$2,386
- − HOA
- −$852
- − Depreciation
- −$9,783
- Taxable loss
- −$11,151
- Est. tax savings @ 24.0%
- +$2,676
- After-tax cash flow
- $-2,508/yr
For passive investors: Depreciation is non-cash, so a rental often shows a tax loss while cash-flowing — sheltering income. Rental losses are passive: they offset passive income freely, and up to $25,000/yr can offset ordinary (W-2) income if you actively participate and your MAGI is under $100k (phasing out to $0 by $150k); unused losses carry forward. On sale, claimed depreciation is recaptured at up to 25%, and gains may owe capital-gains tax (a 1031 exchange can defer both). Figures are a year-1 estimate at your 24.0% rate — not tax advice; consult a CPA.
Schools (NCES district)
- District
- Celina ISD
- NCES district ID
- 4813290
- Math proficiency
- 50% ▼ -15.00%
- Reading proficiency
- 61% ▼ -5.00%
- Median HH income
- $83,282
- Composite
- 50.49/100
- National rank
- #1853
- State rank
- #71 of 826 in TX
Livability — Pilot Point
- Score
- 66/100
- State rank
- #613
- US rank
- #11604
Category grades
Schools grade is shown separately in the Schools card above.
Census & demographics
- Census place
- Pilot Point, TX
- Population (ZIP)
- 8,042
Population outlook (Denton County) Hauer SSP2
- Today (2025)
- 1,053,010 people
- By 2030
- 1,192,269 · +13.2%
- By 2040
- 1,472,920 · +39.9%
- By 2050
- 1,746,506 · +65.9%
- By 2075
- 2,358,497 · +124.0%
- By 2100
- 2,779,183 · +163.9%
Race, ethnicity, and origin ACS 2023
- Neighborhood character
- Majority White (64%)
- Race & ethnicity
- White 64% Hispanic / Latino 28% Two or more races 19% Black 3% Pacific Islander 1%
- Hispanic origin (detail)
- Mexican 26%
- Common ancestry
- Serbian 4% Lithuanian 1% Scottish 1%
- Foreign-born
- 11% · Canada
- Languages at home
- 73% English-only · Spanish 25% Arabic 1% Other Asian/Pacific 1%
Political lean MEDSL · Denton
- 2024 margin
- R (+13.2) · D 42.7% · R 55.8% · Other 1.5%
- 2008→2024 swing
- +11.0pp toward D · 2008: -24.2pp · 2024: -13.2pp
- All cycles
- 2024: R+13.2 2020: R+8.1 2016: R+20.2 2012: R+31.7 2008: R+24.2
Not yet ingested
- Civics
- —
Market trends
- HPI YoY
- ▼ -26.12%
- Current HPI
- 303.4015
- Rent YoY
- —
- Metro
- —
- State GDP YoY
- ▲ 3.95%
- F500 in state
- 110
Industry mix (Fortune 500 HQ in TX)
| Industry | F500 HQs | Revenue |
|---|---|---|
| Energy | 16 | $1,198B |
|
||
| Technology | 5 | $198B |
|
||
| Engineering / Construction | 4 | $72B |
|
||
| Energy Services | 3 | $60B |
|
||
| Utilities | 3 | $41B |
|
||
| Healthcare | 2 | $330B |
|
||
Price history
2 events — show timeline
- 2026-05-11 Pending — NTREIS
- 2026-04-27 Listed $336,299 NTREIS
Cash-flow waterfall
monthlySold comps — $/sqft
last 12 mo · ≤1 miLoading sold comps…