 🏷️ Likely Rental
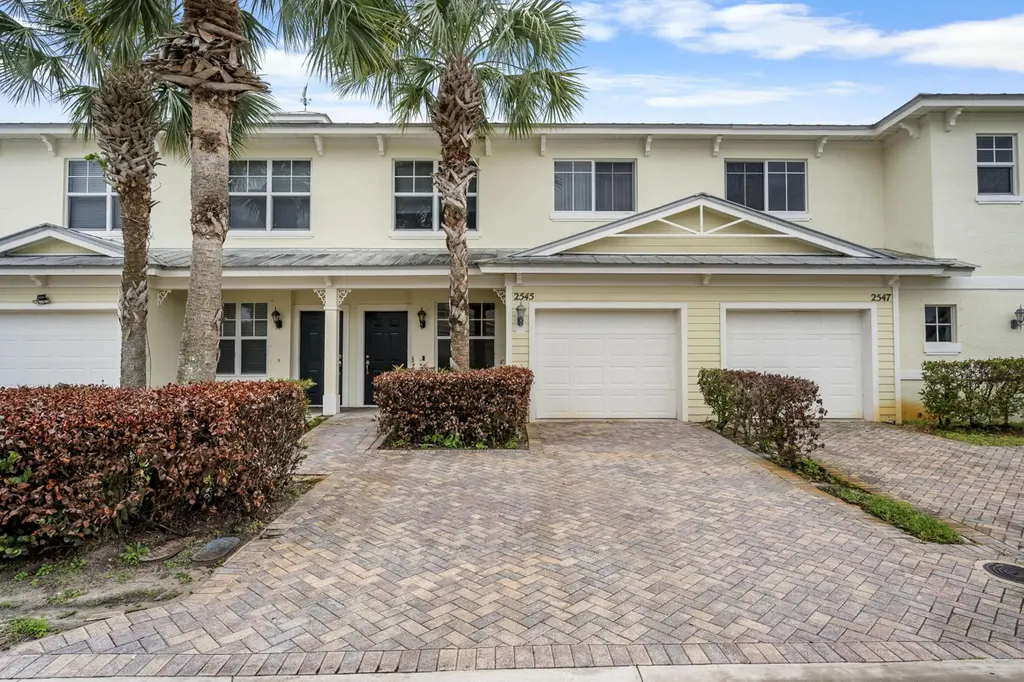
2545 Creekside Dr · Fort Pierce, FL
Flood risk 1/10 · Minimal
- FEMA flood zone
- X (unshaded)
- Chance of flooding over 30 yrs
- 0.0%
- Est. flood insurance / yr
- $507 – $1,088
Fire risk 2/10 · Minimal
- Est. fire insurance / yr
- $947 – $1,759
Heat risk 10/10 · Severe
- Hot days now (above 106°F)
- 7 days/yr
- Hot days in 30 yrs
- 22 days/yr
Wind risk 10/10 · Severe
- Chance of severe wind over 30 yrs
- 99.0%
Air-quality risk 2/10 · Minimal
- Unhealthy air days now
- 0 days/yr
- Unhealthy air days in 30 yrs
- 1 days/yr
Risk factors via First Street. Map © Google.
Why this score? — see what drove the C+ grade
The composite is a weighted blend of 9 inputs, each scored 0–100. Each bar is that input's sub-score; the figure is the points it added to the 100-point composite (weight × sub-score).
- Cash flow +21.7/30.0
- ARV discount +15.0/15.0
- DSCR +6.9/10.0
- 1% rule +6.8/10.0
- Livability +3.8/5.0
- Schools +3.7/10.0
- Rent growth +2.5/5.0
- Condition / age +2.5/5.0
- Appreciation +0.0/10.0
$243,500
🖨 Deal sheet 📄 Offer letter ✓ Due diligence
Listing remarks
This River Oaks townhome has over 1,900 feet of living area! Spacious kitchen with lots of counter tops with 4+ seat breakfast counter. 4 bedrooms 2.5 baths w/ 1 car garage(parking for 3 cars). Association fees of only $300/month. Master BR suite features private balcony & en-suite double vanity w/ separate shower & soaking tub. CBS construction. Partially furnished. The Townhomes at River Oaks have metal roofs, beautiful landscaping, street lights, brick paver driveways and a clubhouse and pool. Convenient location to schools, shopping, historic downtown Fort Pierce & beaches. CBS construction. Partially furnished. See documents tab for HOA rules and Regs, resale/lease a
Key facts
- $300 HOA
- Garage
- Community pool
Property features AI
Finance
- Financial info: Pets allowed (pet restrictions possible)
- HOA & community: HOA with clubhouse, pool, and trails; HOA fee $300 monthly (includes grounds maintenance, common areas, and pool service)
Exterior
- Parking: Three parking spaces total; Attached garage (1 space); Covered parking available; Driveway and guest parking
- Utilities: Public water; Public sewer; Electricity connected; Water connected; Sewer connected; Cable available
- Home design: Townhouse; Two stories; Faces north; Resale condition
- Construction: Cement siding; Concrete block with stucco; Metal roof; Built as a two-story building
- Exterior features: Private road frontage; Not waterfront
Interior
- Kitchen: Dishwasher; Refrigerator
- Bedrooms: Two main-level bedrooms
- Flooring: Carpet; Ceramic tile; Engineered wood
- Bathrooms: Two full bathrooms; One half bathroom
- Heating & cooling: Central individual heating; Central air conditioning
- Interior features: Roman tub; Upstairs living area; Partially furnished
- Laundry & utility: Laundry closet
Neighborhood map
What this means for you Summary
Snapshot
- This is a 4-bed/2.5-bath townhouse listed at $244k.
Deal economics
- At list price, monthly cash flow is $375 ($4k/yr) — positive.
- The deal already cash-flows at list — no discount required.
- Meets the 1% rule at list price ($3k rent vs $244k).
- Recommended offer: $229k (6.0% below list) — sets the bar for market timing.
- Cap rate 8.1% vs local median 3.7% in Fort Pierce — top-decile yield for the area; either an underpriced asset or a hidden risk that comps aren't pricing in. Stress-test before assuming the spread holds.
Location & tenants
- Location reads 76/100 on livability (#226 in FL, #3,360 nationally) — a middle-class / working-renter tenant base. Strengths: commute A+, cost of living A+, housing A+; Watch: crime D+, schools D, amenities F.
- St. Lucie (urban): math 40% / reading 48% proficiency, ranked #51 of 73 in FL (top 70%) — families likely to look elsewhere, expect single-tenant / working-renter base with shorter leases.
- Market conditions: 66 active listings in the ZIP; 7 comparable units currently listed for rent nearby; rentals at typical pace (median 23d on market — plan ~3-4 weeks tenant-placement turnaround); 4,868 units permitted in St. Lucie County in 2024 (268 in 5+ unit buildings).
Forward outlook
- Local home prices are declining (-3.0%/yr); year-one equity from $2k of loan paydown is wiped out by about $7k of value loss. Plan a longer hold.
- St. Lucie County population projected at +20% by 2050 — long-run rental-demand tailwind backs the buy-and-hold thesis.
Negotiation context
- It's been on market 86 days — a 6% lower offer ($229k) is reasonable based on typical stale-listing flexibility.
- 2 sale attempts with the ask held roughly flat each time — persistent listings suggest the price (not the market) is what's stuck; bring a comps-based counter.
Risks & watch-outs
- Climate carrying-cost: severe wind risk, 99% chance of damaging wind over 30y; extreme-heat days projected 7→22/yr by 2055 (HVAC capex compounding) — expect insurance premiums to compound above CPI over the hold.
Questions for the listing agent
- It's been on market 86 days. Have you received any prior offers? Is the seller open to a 6% concession, seller financing, or rate buy-down credit?
- What does the HOA fee cover, when was the last increase, and are there any pending special assessments or reserve-fund shortfalls?
- Why hasn't it sold? Are there any deal-killer items the seller is aware of (foundation, flood, title, zoning, code violations)?
- Is there a deadline driving the sale (1031 exchange, divorce, estate, relocation)? That informs how much negotiation room exists.
- Schools are D-rated, which usually means shorter tenancies and higher turnover. Who's the typical renter profile here, and what's been the actual vacancy rate?
- Crime grade is D in this area — have there been break-ins, vandalism, or insurance claims at this property in the last 3 years? What carrier currently insures it and at what premium?
- What's the average days-on-market for RENTAL listings here right now (not sales)? A rising rental-DOM trend means longer vacancies and softer asking-rent achievability than the comps imply.
- What's the recent tenant-quality profile in this submarket — average credit score on applications, eviction rate, late-payment / NSF rate, and stable-employment percentage? A property-management company in the area should have these aggregated.
- How much new for-sale + rental construction is in the pipeline within 1–3 miles? Heavy new supply typically softens prices + rents 12–24 months out; constrained supply supports both.
Investment metrics
- 1% rule
- 1.18% ✓
- Cap rate
- 8.14%
- Cash-on-cash
- 6.60%
- DSCR
- 1.29
- GRM
- 7.1
CMA / ARV
- ARV (on-the-fly)
- $317,196
- Comps found
- 2
Show comp detail 2 sales within ~0.75 mi
| Address | Dist | Beds/Ba | Sqft | Sold | Price | $/sf | Match |
|---|---|---|---|---|---|---|---|
| 2607 Creekside Dr | 0.07mi | 4/3.0 | 1,834 (-6%) | 19mo | $280,000 | $153 | 68 |
| 2530 Creekside Dr | 0.05mi | 4/2.5 | 1,708 (-13%) | 18mo | $276,000 | $162 | 62 |
Match score weights: distance 35% · size 25% · config 20% · recency 20%. Top-matched comps best support the ARV.
Projected returns pro-forma
-3.0% appreciation · 3.0% rent growth · sell at horizon
- IRR
- -6.1%
- Equity multiple
- 0.77×
- Total profit
- $-15,399
- Equity at exit
- $36,307
- IRR
- 3.6%
- Equity multiple
- 1.26×
- Total profit
- $18,056
- Equity at exit
- $21,053
Cash invested: $68,180 (down + closing). Projections, not guarantees.
Landlord ↔ Tenant lean methodology
- Overall (STATE)
- 87 Strongly Landlord-Friendly
- State Florida
- 87 Strongly Landlord-Friendly · R+3
- County
- — inherits STATE
- City
- — inherits STATE
ZIP-level market 34981
- Home prices YoY
- -9.7%
- Active inventory
- 66
- Price-to-rent
- 7.1×
Monthly cashflow live
- Estimated rent
- $2,876 high interval (Pro) →
- Mortgage (P&I)
- −$1,277
- Tax from tax record
- −$219 /mo · $2,622/yr
- Insurance
- −$101
- HOA
- −$300
- Vacancy / Maint / Mgmt
- −$604
- Net cashflow
- $375
Break-even live
UW: 25.0% down · 7.5% · 30yr · 1.5% tax · 5.0% vac · 8.0% maint · 8.0% mgmt
Financing live
Cash to close
- Down payment
- $60,875
- Closing costs
- $7,305
- Reserves months
- —
- Total cash needed
- —
Loan-product check · same deal, 3 products live
Conventional
25% down · 7.5% · 30yr
- Down + closing
- —
- Monthly P&I
- —
- Monthly cashflow
- —
- DSCR
- —
- Eligible?
- —
Personal DTI + credit; lowest rate.
DSCR
20% down · 8.5% · 30yr
- Down + closing
- —
- Monthly P&I
- —
- Monthly cashflow
- —
- DSCR
- —
- Eligible?
- —
No personal income docs; deal must DSCR.
Hard money
10% down · 12.0% · 12mo
- Down + closing
- —
- Monthly P&I
- —
- Monthly cashflow
- —
- DSCR
- —
- Eligible?
- —
Short-term bridge; refi at stabilization.
Rent comps 7 comps
| Address | Beds | Baths | Sqft | Rent | $/sqft | DOM | Units | Dist |
|---|---|---|---|---|---|---|---|---|
| 2601 Creekside Dr Fort Pierce, FL | 3.0 | 2.5 | 1834 | $3,000 | $1.64 | 21d | 1 | 0.06mi |
| 3343 Liberty Square Way #104 Fort Pierce, FL | 3.0 | 2.5 | 1638 | $2,300 | $1.40 | 23d | 1 | 0.82mi |
| 4220 Sunrise Blvd Fort Pierce, FL | 3.0 | 2.0 | 1870 | $10,000 | $5.35 | 23d | 1 | 1.06mi |
| 4003 Oleander Ave Fort Pierce, FL | 3.0–4.0 | 2.0 | 1765 | $3,020 | $1.71 | 13d | 1 | 1.11mi |
| 3518 Carriage Pointe Cir Fort Pierce, FL | 3.0 | 2.0 | 1594 | $3,000 | $1.88 | 23d | 1 | 1.21mi |
| 928 Fra Mar Pl Fort Pierce, FL | 3.0 | 1.0 | 1440 | $2,000 | $1.39 | 23d | 1 | 1.30mi |
| 2804 Estancia Way Fort Pierce, FL | 3.0 | 2.5 | 1516 | $2,335 | $1.54 | 13d | 3 | 1.50mi |
HOA detail
- Monthly dues
- $300 · $3,600/yr
- Likely covers
- landscapingpool
Listing history 21 events
-
2026-06-18days on market $243,500 Active 86 DOM
-
2026-06-17days on market $243,500 Active 85 DOM
-
2026-06-16days on market $243,500 Active 84 DOM
-
2026-06-15days on market $243,500 Active 83 DOM
-
2026-06-14days on market $243,500 Active 81 DOM
-
2026-06-13days on market $243,500 Active 80 DOM
-
2026-06-10days on market $243,500 Active 78 DOM
-
2026-06-09days on market $243,500 Active 77 DOM
-
2026-06-08days on market $243,500 Active 76 DOM
-
2026-06-07days on market $243,500 Active 75 DOM
-
2026-06-05days on market $243,500 Active 72 DOM
-
2026-06-03days on market $243,500 Active 71 DOM
-
2026-06-02days on market $243,500 Active 70 DOM
-
2026-06-01days on market $243,500 Active 69 DOM
-
2026-05-31days on market $243,500 Active 68 DOM
-
2026-05-30days on market $243,500 Active 67 DOM
-
2026-05-20status Active
-
2026-04-28historical Active Under Contract
-
2026-04-16price $243,500
-
2026-03-24$249,900 Active
-
2004-07-14soldstatus $2,100,000
ⓘ Source: listings_history table (triggers on properties + properties_extension) + one-shot
backfill from property_details.listing_events for pre-trigger history.
Tax reassessment forecast FL · Resets to sale price
- Current annual tax
- $2,622 · $219/mo
- Projected year-2 tax
- $2,622 · $219/mo
- Expected delta
- $0/yr ($0/mo · 0.0%)
ⓘ Screening estimate from a state-policy table — verify with the county assessor before closing.
Climate risk First Street
- Flood 1/10 Low FEMA zone X (unshaded) · 0% chance over 30 yrs
- Wildfire 2/10 Low
- Heat 10/10 Extreme 7 d/yr ≥106°F today · 22 d/yr by 30 yrs out
- Wind 10/10 Extreme 99% chance of damaging wind over 30 yrs
- Air quality 2/10 Low 0 unhealthy d/yr today · 1 by 30 yrs out
Nearby sold comps map
Loading sold comps map…
Walkable amenities ~0.75 mi
Loading nearby amenities…
Taxation est. · year 1
- Rental income
- $34,510
- − Mortgage interest
- −$13,640
- − Property taxes
- −$2,622
- − Insurance
- −$1,218
- − Repairs & maintenance
- −$2,761
- − Management
- −$2,761
- − HOA
- −$3,600
- − Depreciation
- −$7,084
- Taxable income
- $825
- Est. tax owed @ 24.0%
- −$198
- After-tax cash flow
- $4,302/yr
For passive investors: Depreciation is non-cash, so a rental often shows a tax loss while cash-flowing — sheltering income. Rental losses are passive: they offset passive income freely, and up to $25,000/yr can offset ordinary (W-2) income if you actively participate and your MAGI is under $100k (phasing out to $0 by $150k); unused losses carry forward. On sale, claimed depreciation is recaptured at up to 25%, and gains may owe capital-gains tax (a 1031 exchange can defer both). Figures are a year-1 estimate at your 24.0% rate — not tax advice; consult a CPA.
Schools (NCES district)
- District
- St. Lucie
- NCES district ID
- 1201770
- Math proficiency
- 40% ▼ -11.00%
- Reading proficiency
- 48% ▼ -4.00%
- Median HH income
- $44,737
- Composite
- 37.28/100
- National rank
- #4449
- State rank
- #51 of 73 in FL
Livability — Fort Pierce
- Score
- 76/100
- State rank
- #226
- US rank
- #3360
Category grades
Schools grade is shown separately in the Schools card above.
Census & demographics
- Census place
- Fort Pierce, FL
- City population
- 78,556
- Population (ZIP)
- 6,167
Population outlook (St. Lucie County) Hauer SSP2
- Today (2025)
- 338,016 people
- By 2030
- 355,687 · +5.2%
- By 2040
- 385,521 · +14.1%
- By 2050
- 406,106 · +20.1%
- By 2075
- 441,054 · +30.5%
- By 2100
- 436,885 · +29.2%
Race, ethnicity, and origin ACS 2023
- Neighborhood character
- Diverse neighborhood (Simpson 0.62)
- Race & ethnicity
- White 53% Black 24% Hispanic / Latino 21% Two or more races 8%
- Hispanic origin (detail)
- Mexican 4% Puerto Rican 8% Cuban 3% Dominican 1%
- Common ancestry
- Hispanic 7% Italian 4% Lithuanian 3%
- Foreign-born
- 11% · Canada
- Languages at home
- 78% English-only · French/Haitian/Cajun 9% Spanish 8% Other Indo-European 1%
Political lean MEDSL · St. Lucie
- 2024 margin
- Lean R (+9.1) · D 45.1% · R 54.2%
- 2008→2024 swing
- -21.2pp toward R · 2008: 12.1pp · 2024: -9.1pp
- All cycles
- 2024: R+9.1 2020: R+1.6 2016: R+2.5 2012: D+7.9 2008: D+12.1
Not yet ingested
- Civics
- —
Market trends
- HPI YoY
- ▼ -44.06%
- Current HPI
- 408.6633
- Rent YoY
- —
- Metro
- —
- State GDP YoY
- ▲ 3.28%
- F500 in state
- 36
Industry mix (Fortune 500 HQ in FL)
| Industry | F500 HQs | Revenue |
|---|---|---|
| Industrial Technology | 2 | $29B |
|
||
| Insurance | 2 | $17B |
|
||
| Retail | 1 | $60B |
|
||
| Technology Distribution | 1 | $58B |
|
||
| Homebuilding | 1 | $35B |
|
||
| Technology Manufacturing | 1 | $35B |
|
||
Price history
-88.4% since first listed5 events — show timeline
- 2026-05-20 Relisted — Beaches MLS
- 2026-04-28 Contingent — Beaches MLS
- 2026-04-16 Price Changed $243,500 Beaches MLS
- 2026-03-24 Listed $249,900 Beaches MLS
- 2004-07-14 Sold (Public Records) $2,100,000 Public Records
Property tax history
+3.8%/yrLatest (2025): $2,622 · +3.8% YoY. Source: county tax records.
Cash-flow waterfall
monthlySold comps — $/sqft
last 12 mo · ≤1 miLoading sold comps…