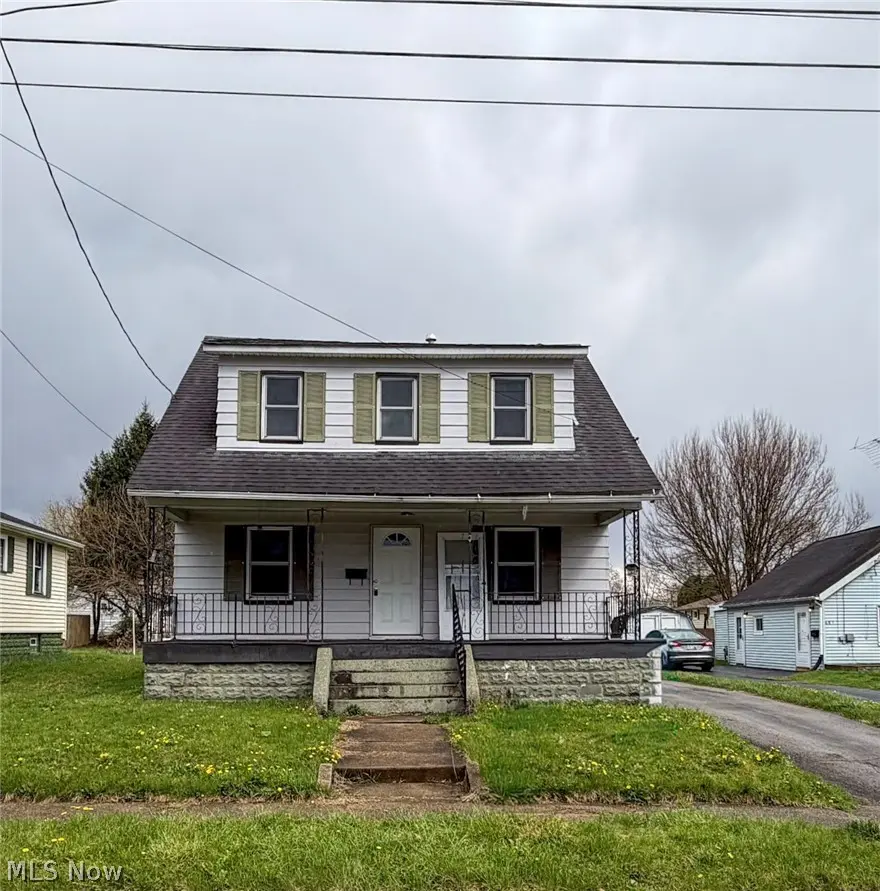
603 Belmont Ave · Niles, OH
Flood risk 1/10 · Minimal
- FEMA flood zone
- X (unshaded)
- Chance of flooding over 30 yrs
- 0.0%
- Est. flood insurance / yr
- $473 – $860
Fire risk 1/10 · Minimal
- Est. fire insurance / yr
- $713 – $1,323
Heat risk 3/10 · Minor
- Hot days now (above 97°F)
- 7 days/yr
- Hot days in 30 yrs
- 17 days/yr
Wind risk 1/10 · Minimal
- Chance of severe wind over 30 yrs
- —
Air-quality risk 3/10 · Minor
- Unhealthy air days now
- 1 days/yr
- Unhealthy air days in 30 yrs
- 4 days/yr
Risk factors via First Street. Map © Google.
Why this score? — see what drove the B grade
The composite is a weighted blend of 9 inputs, each scored 0–100. Each bar is that input's sub-score; the figure is the points it added to the 100-point composite (weight × sub-score).
- Cash flow +30.0/30.0
- ARV discount +12.8/15.0
- DSCR +10.0/10.0
- 1% rule +7.9/10.0
- Schools +3.7/10.0
- Livability +3.4/5.0
- Rent growth +2.5/5.0
- Condition / age +2.5/5.0
- Appreciation +0.0/10.0
$89,900
🖨 Deal sheet 📄 Offer letter ✓ Due diligence
Listing remarks MLS
Located in Niles, this 3-bedroom, 1-bath home offers a great opportunity for investors or buyers looking to add their own personal touch. The property features a newly updated bathroom, along with a functional layout and an additional shower in the basement, adding extra convenience and potential. While the home does need some work, it provides a solid foundation to renovate, customize, and build equity. Whether you’re looking for your next investment property or a fixer-upper to make your own, this home has plenty of potential to shine with the right vision.
Key facts
- 6,098 sq ft lot
- Built 1923
- Listed 72 days
Neighborhood map
What this means for you Summary
Snapshot
- This is a 3-bed/1.0-bath single-family listed at $90k.
Deal economics
- At list price, monthly cash flow is $341 ($4k/yr) — positive.
- The deal already cash-flows at list — no discount required.
- Meets the 1% rule at list price ($1k rent vs $90k).
- Recommended offer: $85k (6.0% below list) — sets the bar for market timing.
- Cap rate 10.8% vs local median 5.8% in Niles — top-decile yield for the area; either an underpriced asset or a hidden risk that comps aren't pricing in. Stress-test before assuming the spread holds.
Location & tenants
- Location reads 67/100 on livability (#628 in OH) — a middle-class / working-renter tenant base. Strengths: cost of living A+, housing A+; Watch: crime D+, employment D, amenities F.
- Niles City (suburban): math 37% / reading 52% proficiency, ranked #507 of 656 in OH (top 77%) — families likely to look elsewhere, expect single-tenant / working-renter base with shorter leases.
- Market conditions: 65 active listings in the ZIP; 5 comparable units currently listed for rent nearby; rentals leasing fast (median 14d on market — plan ~1-2 weeks tenant-placement turnaround); 129 units permitted in Trumbull County in 2024 (0 in 5+ unit buildings).
Forward outlook
- Local home prices are declining (-3.0%/yr); year-one equity from $622 of loan paydown is wiped out by about $3k of value loss. Plan a longer hold.
- Trumbull County population projected at -22% by 2050 — secular population decline; favor cash flow + early exit over multi-decade hold.
- At projected returns (-3.0% appreciation + 3.0% rent growth), your $25k cash investment doubles in ~8 years — after that, you're playing with house money.
Negotiation context
- It's been on market 73 days — a 6% lower offer ($85k) is reasonable based on typical stale-listing flexibility.
- 4 sale attempts since 20y ago; this cycle's ask has dropped $15k (14%) from the opening price — seller is motivated, your offer sets the floor, not the list.
- Current owner paid $49k; list at $90k implies a 83% gain — meaningful room to come down on a strong offer.
Risks & watch-outs
- Watch-outs: built in 1923 — expect roof / HVAC / electrical / plumbing capex.
Questions for the listing agent
- It's been on market 73 days. Have you received any prior offers? Is the seller open to a 6% concession, seller financing, or rate buy-down credit?
- Built in 1923 — when were the roof, HVAC, electrical panel, plumbing, and water heater last replaced?
- Why hasn't it sold? Are there any deal-killer items the seller is aware of (foundation, flood, title, zoning, code violations)?
- Is there a deadline driving the sale (1031 exchange, divorce, estate, relocation)? That informs how much negotiation room exists.
- Schools are B-rated — typically a magnet for longer-tenancy family renters. What's the average tenant stay here, and is there a school-zone premium baked into asking?
- Crime grade is D in this area — have there been break-ins, vandalism, or insurance claims at this property in the last 3 years? What carrier currently insures it and at what premium?
- What's the average days-on-market for RENTAL listings here right now (not sales)? A rising rental-DOM trend means longer vacancies and softer asking-rent achievability than the comps imply.
- What's the recent tenant-quality profile in this submarket — average credit score on applications, eviction rate, late-payment / NSF rate, and stable-employment percentage? A property-management company in the area should have these aggregated.
- How much new for-sale + rental construction is in the pipeline within 1–3 miles? Heavy new supply typically softens prices + rents 12–24 months out; constrained supply supports both.
Investment metrics
- 1% rule
- 1.29% ✓
- Cap rate
- 10.84%
- Cash-on-cash
- 16.26%
- DSCR
- 1.72
- GRM
- 6.5
CMA / ARV
- ARV (median comp)
- $101,842
- List price
- $89,900
- Delta
- -11.73%
- Verdict
- UNDERPRICED
- Comps
- 20 within 1.0 mi
Show comp detail 12 sales within ~0.75 mi
| Address | Dist | Beds/Ba | Sqft | Sold | Price | $/sf | Match |
|---|---|---|---|---|---|---|---|
| 527 Belmont Ave | 0.05mi | 2/1.5 (-1) | 1,150 (+4%) | 11mo | $106,000 | $92 | 75 |
| 723 High Ave | 0.29mi | 4/1.0 (+1) | 1,102 (-0%) | 11mo | $135,000 | $123 | 72 |
| 14 Olive St | 0.33mi | 3/1.0 | 1,176 (+6%) | 7mo | $95,000 | $81 | 68 |
| 114 Russell Ave | 0.57mi | 3/1.0 | 1,140 (+3%) | 4mo | $147,500 | $129 | 66 |
| 432 Scott Ave | 0.16mi | 2/1.5 (-1) | 1,210 (+9%) | 13mo | $107,500 | $89 | 59 |
| 213 N Bentley Ave | 0.72mi | 3/1.0 | 1,088 (-2%) | 6mo | $40,000 | $37 | 59 |
| 617 Fenton St | 0.26mi | 2/1.0 (-1) | 1,008 (-9%) | 15mo | $29,900 | $30 | 56 |
| 220 Baldwin Ave | 0.41mi | 2/2.5 (-1) | 1,096 (-1%) | 18mo | $90,000 | $82 | 54 |
| 304 Baldwin Ave | 0.38mi | 2/1.0 (-1) | 946 (-14%) | 3mo | $120,000 | $127 | 51 |
| 1023 Mason St | 0.37mi | 2/1.0 (-1) | 981 (-11%) | 13mo | $71,000 | $72 | 48 |
| 1476 Stepney St | 0.74mi | 3/2.0 | 1,055 (-5%) | 9mo | $186,850 | $177 | 46 |
| 1115 Estelle Ct | 0.63mi | 2/1.0 (-1) | 944 (-15%) | 8mo | $136,000 | $144 | 35 |
Match score weights: distance 35% · size 25% · config 20% · recency 20%. Top-matched comps best support the ARV.
Projected returns pro-forma
-3.0% appreciation · 3.0% rent growth · sell at horizon
- IRR
- 7.3%
- Equity multiple
- 1.28×
- Total profit
- $7,139
- Equity at exit
- $13,404
- IRR
- 16.6%
- Equity multiple
- 2.36×
- Total profit
- $34,135
- Equity at exit
- $7,773
Cash invested: $25,172 (down + closing). Projections, not guarantees.
Landlord ↔ Tenant lean methodology
- Overall (STATE)
- 73 Landlord-Friendly
- State Ohio
- 73 Landlord-Friendly · R+6
- County
- — inherits STATE
- City
- — inherits STATE
ZIP-level market 44446
- Home prices YoY
- -19.9%
- Active inventory
- 65
- Price-to-rent
- 6.5×
Monthly cashflow live
- Estimated rent
- $1,157 high interval (Pro) →
- Mortgage (P&I)
- −$471
- Tax from tax record
- −$64 /mo · $771/yr
- Insurance
- −$37
- HOA
- −$0
- Vacancy / Maint / Mgmt
- −$243
- Net cashflow
- $341
Break-even live
UW: 25.0% down · 7.5% · 30yr · 1.5% tax · 5.0% vac · 8.0% maint · 8.0% mgmt
Financing live
Cash to close
- Down payment
- $22,475
- Closing costs
- $2,697
- Reserves months
- —
- Total cash needed
- —
Loan-product check · same deal, 3 products live
Conventional
25% down · 7.5% · 30yr
- Down + closing
- —
- Monthly P&I
- —
- Monthly cashflow
- —
- DSCR
- —
- Eligible?
- —
Personal DTI + credit; lowest rate.
DSCR
20% down · 8.5% · 30yr
- Down + closing
- —
- Monthly P&I
- —
- Monthly cashflow
- —
- DSCR
- —
- Eligible?
- —
No personal income docs; deal must DSCR.
Hard money
10% down · 12.0% · 12mo
- Down + closing
- —
- Monthly P&I
- —
- Monthly cashflow
- —
- DSCR
- —
- Eligible?
- —
Short-term bridge; refi at stabilization.
Rent comps 5 comps
| Address | Beds | Baths | Sqft | Rent | $/sqft | DOM | Units | Dist |
|---|---|---|---|---|---|---|---|---|
| 701 Summit Ave Niles, OH | 2.0 | 1.0–2.0 | 963 | $1,220 | $1.27 | 13d | 1 | 0.41mi |
| 5 Circle St Unit 5 Niles, OH | 2.0 | 1.0 | 1200 | $850 | $0.71 | 13d | 1 | 0.74mi |
| 35 Neil St #1 Niles, OH | 2.0 | 1.0 | 1264 | $950 | $0.75 | 13d | 1 | 1.07mi |
| 1916 Youll St Niles, OH | 1.0–3.0 | 1.0–1.5 | 1216 | $1,130 | $0.93 | 13d | 1 | 1.26mi |
| 2122 Robbins Ave Niles, OH | 2.0 | 1.0 | 593 | $905 | $1.52 | 13d | 1 | 1.33mi |
Listing history 30 events
-
2026-06-19days on market $89,900 Active 73 DOM
-
2026-06-18days on market $89,900 Active 72 DOM
-
2026-06-17days on market $89,900 Active 71 DOM
-
2026-06-16days on market $89,900 Active 70 DOM
-
2026-06-15days on market $89,900 Active 69 DOM
-
2026-06-14days on market $89,900 Active 67 DOM
-
2026-06-13days on market $89,900 Active 66 DOM
-
2026-06-10days on market $89,900 Active 64 DOM
-
2026-06-09days on market $89,900 Active 63 DOM
-
2026-06-08days on market $89,900 Active 62 DOM
-
2026-06-07pricedays on market $89,900 Active 61 DOM
-
2026-06-03days on market $95,000 Active 57 DOM
-
2026-06-02days on market $95,000 Active 56 DOM
-
2026-06-01days on market $95,000 Active 55 DOM
-
2026-05-31days on market $95,000 Active 54 DOM
-
2026-05-30days on market $95,000 Active 53 DOM
-
2026-04-26price $97,000 571-char remark
Show marketing remark (571 chars)
Located in Niles, this 3-bedroom, 1-bath home offers a great opportunity for investors or buyers looking to add their own personal touch. The property features a newly updated bathroom, along with a functional layout and an additional shower in the basement, adding extra convenience and potential. While the home does need some work, it provides a solid foundation to renovate, customize, and build equity. Whether you’re looking for your next investment property or a fixer-upper to make your own, this home has plenty of potential to shine with the right vision.
-
2026-04-07$105,000 Active 571-char remark
Show marketing remark (571 chars)
Located in Niles, this 3-bedroom, 1-bath home offers a great opportunity for investors or buyers looking to add their own personal touch. The property features a newly updated bathroom, along with a functional layout and an additional shower in the basement, adding extra convenience and potential. While the home does need some work, it provides a solid foundation to renovate, customize, and build equity. Whether you’re looking for your next investment property or a fixer-upper to make your own, this home has plenty of potential to shine with the right vision.
-
2021-03-12soldstatus $49,000 Closed 225-char remark
Show marketing remark (225 chars)
Welcome to 603 Belmont! Nice 3 bedroom with 1 full bath in Niles. Property was formally a rental at $650 a month! Owners serviced furnace yearly. Updates to include roof 2008, AC 2018 and new electrical box and outlets 2015.
-
2021-03-12soldstatus $49,000
Show marketing remark (225 chars)
Welcome to 603 Belmont! Nice 3 bedroom with 1 full bath in Niles. Property was formally a rental at $650 a month! Owners serviced furnace yearly. Updates to include roof 2008, AC 2018 and new electrical box and outlets 2015.
-
2021-03-08status Pending 225-char remark
Show marketing remark (225 chars)
Welcome to 603 Belmont! Nice 3 bedroom with 1 full bath in Niles. Property was formally a rental at $650 a month! Owners serviced furnace yearly. Updates to include roof 2008, AC 2018 and new electrical box and outlets 2015.
-
2021-01-31historical Contingent 225-char remark
Show marketing remark (225 chars)
Welcome to 603 Belmont! Nice 3 bedroom with 1 full bath in Niles. Property was formally a rental at $650 a month! Owners serviced furnace yearly. Updates to include roof 2008, AC 2018 and new electrical box and outlets 2015.
-
2020-10-29price $49,900 225-char remark
Show marketing remark (225 chars)
Welcome to 603 Belmont! Nice 3 bedroom with 1 full bath in Niles. Property was formally a rental at $650 a month! Owners serviced furnace yearly. Updates to include roof 2008, AC 2018 and new electrical box and outlets 2015.
-
2020-09-30price $55,000 225-char remark
Show marketing remark (225 chars)
Welcome to 603 Belmont! Nice 3 bedroom with 1 full bath in Niles. Property was formally a rental at $650 a month! Owners serviced furnace yearly. Updates to include roof 2008, AC 2018 and new electrical box and outlets 2015.
-
2020-09-01$59,900 Active 225-char remark
Show marketing remark (225 chars)
Welcome to 603 Belmont! Nice 3 bedroom with 1 full bath in Niles. Property was formally a rental at $650 a month! Owners serviced furnace yearly. Updates to include roof 2008, AC 2018 and new electrical box and outlets 2015.
-
2019-09-10historical
-
2019-03-10$64,900 Active
-
2007-08-24soldstatus $42,000
-
2007-08-23soldstatus $43,000
-
2006-01-26$54,900
ⓘ Source: listings_history table (triggers on properties + properties_extension) + one-shot
backfill from property_details.listing_events for pre-trigger history.
Tax reassessment forecast OH · Partial reset (capped growth)
- Current annual tax
- $771 · $64/mo
- Projected year-2 tax
- $1,087 · $91/mo
- Expected delta
- +$316/yr (+$26/mo · 40.9%)
ⓘ Screening estimate from a state-policy table — verify with the county assessor before closing.
Climate risk First Street
- Flood 1/10 Low FEMA zone X (unshaded) · 0% chance over 30 yrs
- Wildfire 1/10 Low
- Heat 3/10 Moderate 7 d/yr ≥97°F today · 17 d/yr by 30 yrs out
- Wind 1/10 Low
- Air quality 3/10 Moderate 1 unhealthy d/yr today · 4 by 30 yrs out
Nearby sold comps map
Loading sold comps map…
Walkable amenities ~0.75 mi
Loading nearby amenities…
Taxation est. · year 1
- Rental income
- $13,886
- − Mortgage interest
- −$5,036
- − Property taxes
- −$771
- − Insurance
- −$450
- − Repairs & maintenance
- −$1,111
- − Management
- −$1,111
- − Depreciation
- −$2,615
- Taxable income
- $2,793
- Est. tax owed @ 24.0%
- −$670
- After-tax cash flow
- $3,422/yr
For passive investors: Depreciation is non-cash, so a rental often shows a tax loss while cash-flowing — sheltering income. Rental losses are passive: they offset passive income freely, and up to $25,000/yr can offset ordinary (W-2) income if you actively participate and your MAGI is under $100k (phasing out to $0 by $150k); unused losses carry forward. On sale, claimed depreciation is recaptured at up to 25%, and gains may owe capital-gains tax (a 1031 exchange can defer both). Figures are a year-1 estimate at your 24.0% rate — not tax advice; consult a CPA.
Schools (NCES district)
- District
- Niles City
- NCES district ID
- 3904449
- Math proficiency
- 37% ▼ -22.00%
- Reading proficiency
- 52% ▼ -11.00%
- Median HH income
- $37,965
- Composite
- 37.02/100
- National rank
- #4517
- State rank
- #507 of 656 in OH
Livability — Niles
- Score
- 67/100
- State rank
- #628
- US rank
- #11037
Category grades
Schools grade is shown separately in the Schools card above.
Census & demographics
- Census place
- Niles, OH
- County
- Trumbull County · 61,158 people
- City population
- 20,060
- Metro
- Youngstown-Warren-Boardman, OH-PA
- Population (ZIP)
- 20,060
- Household income
- $50,468
- Rent vs Own
- Severe rent burden
- 820.0
Population outlook (Trumbull County) Hauer SSP2
- Today (2025)
- 191,696 people
- By 2030
- 184,015 · -4.0%
- By 2040
- 166,810 · -13.0%
- By 2050
- 149,857 · -21.8%
- By 2075
- 115,769 · -39.6%
- By 2100
- 83,617 · -56.4%
Race, ethnicity, and origin ACS 2023
- Neighborhood character
- Predominantly White (88%)
- Race & ethnicity
- White 88% Two or more races 6% Black 4% Hispanic / Latino 3%
- Common ancestry
- Romanian 2% Slovak 1% Subsaharan African 1%
- Foreign-born
- 1%
- Languages at home
- 98% English-only · Spanish 1%
Political lean MEDSL · Trumbull
- 2024 margin
- R (+16.8) · D 41.2% · R 58.0%
- 2008→2024 swing
- -39.2pp toward R · 2008: 22.4pp · 2024: -16.8pp
- All cycles
- 2024: R+16.8 2020: R+10.6 2016: R+6.4 2012: D+22.2 2008: D+22.4
Not yet ingested
- Civics
- —
Market trends
- HPI YoY
- ▼ -49.52%
- Current HPI
- 198.7738
- Rent YoY
- —
- Metro
- Youngstown-Warren-Boardman, OH-PA
- State GDP YoY
- ▲ 1.98%
- F500 in state
- 48
Industry mix (Fortune 500 HQ in OH)
| Industry | F500 HQs | Revenue |
|---|---|---|
| Insurance | 3 | $145B |
|
||
| Industrial Machinery | 3 | $49B |
|
||
| Financial Services | 3 | $24B |
|
||
| Consumer Goods | 2 | $93B |
|
||
| Aerospace / Defense | 2 | $47B |
|
||
| Utilities | 2 | $33B |
|
||
Price history
+76.7% since first listed14 events — show timeline
- 2026-04-26 Price Changed $97,000 MLSNOW
- 2026-04-07 Listed $105,000 MLSNOW
- 2021-03-12 Sold (Public Records) $49,000 Public Records
- 2021-03-12 Sold (MLS) $49,000 MLSNOW
- 2021-03-08 Pending — MLSNOW
- 2021-01-31 Contingent — MLSNOW
- 2020-10-29 Price Changed $49,900 MLSNOW
- 2020-09-30 Price Changed $55,000 MLSNOW
- 2020-09-01 Listed $59,900 MLSNOW
- 2019-09-10 Listing Removed — MLSNOW
- 2019-03-10 Listed $64,900 MLSNOW
- 2007-08-24 Sold (Public Records) $42,000 Public Records
- 2007-08-23 Sold (MLS) $43,000 MLSNOW
- 2006-01-26 Listed $54,900 MLSNOW
Property tax history
+2.9%/yrLatest (2025): $771 · +0.9% YoY. Source: county tax records.
Cash-flow waterfall
monthlySold comps — $/sqft
last 12 mo · ≤1 miLoading sold comps…