 🏗️ New Construction
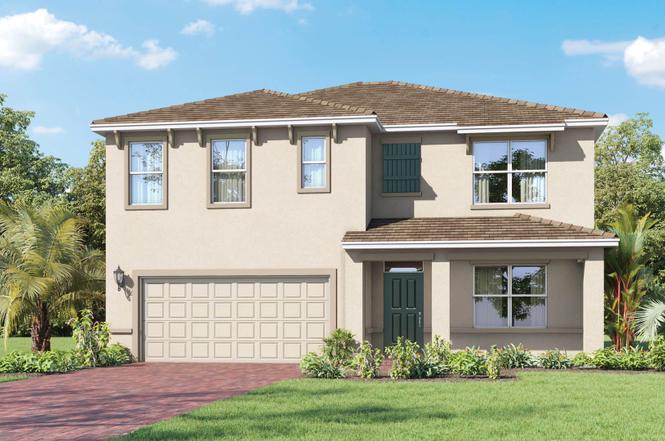
Hayden Plan · Palm Bay, FL
Flood risk No data
- FEMA flood zone
- —
- Chance of flooding over 30 yrs
- —
- Est. flood insurance / yr
- —
Fire risk No data
- Est. fire insurance / yr
- —
Heat risk No data
- Hot days now (above threshold)
- —
- Hot days in 30 yrs
- —
Wind risk No data
- Chance of severe wind over 30 yrs
- —
Air-quality risk No data
- Unhealthy air days now
- —
- Unhealthy air days in 30 yrs
- —
Risk factors via First Street. Map © Google.
Why this score? — see what drove the D grade
The composite is a weighted blend of 9 inputs, each scored 0–100. Each bar is that input's sub-score; the figure is the points it added to the 100-point composite (weight × sub-score).
- Appreciation +10.0/10.0
- ARV discount +7.5/15.0
- Cash flow +6.6/30.0
- Schools +4.7/10.0
- Livability +3.6/5.0
- Rent growth +3.4/5.0
- Condition / age +2.5/5.0
- 1% rule +1.7/10.0
- DSCR +0.8/10.0
$394,990
🖨 Deal sheet (PDF) 📄 Offer letter ✓ Due diligence
Listing remarks
Find all the space you need in our popular two-story Hayden floorplan in Cypress Bay West, one of our communities in Palm Bay, Florida. Inside this 5-bedroom, 3-bathroom home, you'll find 2,601 square feet of flexible living space and a two-car garage. Step thru the front foyer and you're greeted with a flex room designed for work or play. Make your way to the kitchen on the first floor, which overlooks the living, dining room and slider to the backyard patio. The kitchen features a center island with room for seating, plentiful cabinetry, quartz countertops, stainless steel appliances and a walk-in pantry which are sure to both turn heads and make meal prep easy. Guests can pull up a seat
Key facts
- En suite bathroom
- Flex room
- Granite countertops
Tags
Property features AI
Finance
- Financial info: List price $394,990
Exterior
- Home design: Single-family plan home; Listing status: Active
- Construction: New construction (Hayden plan)
- Exterior features: Located at 4081 Hollingsworth Dr SE, Palm Bay, FL 32909; Living area approximately 2601
Interior
- Bedrooms: 5 bedrooms
- Bathrooms: 3 full bathrooms
- Interior features: Plan: Hayden (new construction plan)
Neighborhood map
What this means for you Summary
Snapshot
- This is a 5-bed/3.0-bath single-family listed at $395k.
Deal economics
- At list price, monthly cash flow is $-654 ($-8k/yr) — negative.
- To cash-flow at today's rent, offer at most $300k (24.0% below list).
- To meet the 1% rule (rent ≥ 1% of price), the offer needs to be $263k (33.5% below list).
- Recommended offer: $263k (33.5% below list) — sets the bar for 1% rule.
Location & tenants
- Location reads 72/100 on livability (#366 in FL) — a middle-class / working-renter tenant base. Strengths: cost of living A+, housing A+; Watch: employment D+, amenities F, health & safety D-.
- Brevard (suburban): math 53% / reading 57% proficiency, ranked #19 of 73 in FL (top 26%) — acceptable for families but not a draw, mixed tenant base, ~2y average lease.
- Zoned schools: Sunrise Elementary School (math 52% / reading 57%, grade C, #892 of 2,144 statewide, top 44%, 759 students, 58% FRL); Southwest Middle School (math 40% / reading 39%, grade F, #373 of 571 statewide, top 66%, 920 students, 58% FRL); Bayside High School (math 27% / reading 40%, grade F, #400 of 667 statewide, top 61%, 1,854 students, 51% FRL).
- Zoned-school proficiency averages 42% at this address vs 55% district-wide (-12 pts) — the specific schools serving this property underperform the Brevard average; the district grade overstates school quality for this exact location.
- Market conditions: Rents rising (+3.7%/yr); 1123 active listings in the ZIP; 11 comparable units currently listed for rent nearby; rentals at typical pace (median 25d on market — plan ~3-4 weeks tenant-placement turnaround); solid renter incomes; 4,602 units permitted in Brevard County in 2024 (702 in 5+ unit buildings).
- This rent runs 39% of the median local income ($80k/yr) — at the standard rent-burdened threshold; future hikes will face affordability resistance.
Forward outlook
- In year one you build about $42k of equity ($3k loan paydown + $39k appreciation (10.0% local appreciation)).
- Brevard County population projected at +15% by 2050 — modest demand growth; plan on rents tracking national, not racing it.
- By year 2, paydown + projected appreciation supports a ~$68k cash-out refi (75% LTV) — recoverable capital for the next deal without selling this one.
Negotiation context
- It's been on market 424 days — a 12% lower offer ($348k) is reasonable based on typical stale-listing flexibility.
Questions for the listing agent
- What do current leases actually rent for vs. the listed asking? Can we see a recent rent roll and the last 12 months of T-12 income?
- It's been on market 424 days. Have you received any prior offers? Is the seller open to a 33% concession, seller financing, or rate buy-down credit?
- Why hasn't it sold? Are there any deal-killer items the seller is aware of (foundation, flood, title, zoning, code violations)?
- Is there a deadline driving the sale (1031 exchange, divorce, estate, relocation)? That informs how much negotiation room exists.
- The area grade is low — what's the realistic commute time and amenity access for the typical tenant pool here? Any planned neighborhood developments (good or bad) we should know about?
- What's the average days-on-market for RENTAL listings here right now (not sales)? A rising rental-DOM trend means longer vacancies and softer asking-rent achievability than the comps imply.
- What's the recent tenant-quality profile in this submarket — average credit score on applications, eviction rate, late-payment / NSF rate, and stable-employment percentage? A property-management company in the area should have these aggregated.
- How much new for-sale + rental construction is in the pipeline within 1–3 miles? Heavy new supply typically softens prices + rents 12–24 months out; constrained supply supports both.
Investment metrics
- 1% rule
- 0.67% ✗
- Cap rate
- 4.30%
- Cash-on-cash
- -7.10%
- DSCR
- 0.68
- GRM
- 12.5
CMA / ARV
No comps found within radius.
Projected returns pro-forma
10.0% appreciation · 3.67% rent growth · sell at horizon
- IRR
- 19.4%
- Equity multiple
- 2.58×
- Total profit
- $175,266
- Equity at exit
- $355,838
- IRR
- 18.0%
- Equity multiple
- 6.00×
- Total profit
- $552,703
- Equity at exit
- $767,379
Cash invested: $110,597 (down + closing). Projections, not guarantees.
Landlord ↔ Tenant lean methodology
- Overall (STATE)
- 87 Strongly Landlord-Friendly
- State Florida
- 87 Strongly Landlord-Friendly · R+3
- County
- — inherits STATE
- City
- — inherits STATE
ZIP-level market 32909
- Home prices YoY
- 6.0%
- Rents YoY
- 3.7%
- Active inventory
- 1123
- Price-to-rent
- 12.5×
Monthly cashflow live
- Estimated rent
- $2,627 high interval (Pro) →
- Mortgage (P&I)
- −$2,071
- Tax est. 1.5%
- −$494 /mo · $5,925/yr
- Insurance
- −$165
- HOA
- −$0
- Vacancy / Maint / Mgmt
- −$552
- Net cashflow
- $-654
Break-even live
Sensitivity live
| Price | -10% $-381 | -5% $-518 | +0% $-654 | +5% $-791 | +10% $-927 |
|---|---|---|---|---|---|
| Rent | -10% $-862 | -5% $-758 | +0% $-654 | +5% $-551 | +10% $-447 |
| Rate | -1.0pp $-455 | -0.5pp $-554 | base $-654 | +0.5pp $-757 | +1.0pp $-861 |
UW: 25.0% down · 7.5% · 30yr · 1.5% tax · 5.0% vac · 8.0% maint · 8.0% mgmt
Financing live
Cash to close
- Down payment
- $98,748
- Closing costs
- $11,850
- Reserves months
- —
- Total cash needed
- —
Loan-product check · same deal, 3 products live
Conventional
25% down · 7.5% · 30yr
- Down + closing
- —
- Monthly P&I
- —
- Monthly cashflow
- —
- DSCR
- —
- Eligible?
- —
Personal DTI + credit; lowest rate.
DSCR
20% down · 8.5% · 30yr
- Down + closing
- —
- Monthly P&I
- —
- Monthly cashflow
- —
- DSCR
- —
- Eligible?
- —
No personal income docs; deal must DSCR.
Hard money
10% down · 12.0% · 12mo
- Down + closing
- —
- Monthly P&I
- —
- Monthly cashflow
- —
- DSCR
- —
- Eligible?
- —
Short-term bridge; refi at stabilization.
Rent comps 11 comps
| Address | Beds | Baths | Sqft | Rent | $/sqft | DOM | Units | Dist |
|---|---|---|---|---|---|---|---|---|
| 1566 Criswell Ln SE Palm Bay, FL | 4.0 | 2.0 | 2046 | $2,400 | $1.17 | 25d | 1 | 0.08mi |
| 1394 Garabaldi Cir SE Palm Bay, FL | 4.0 | 2.0 | 1876 | $2,500 | $1.33 | 20d | 1 | 0.32mi |
| 925 Dugan Cir SE Palm Bay, FL | 4.0 | 2.0 | 1830 | $2,295 | $1.25 | 15d | 1 | 0.39mi |
| 3636 Aberdeen Dr SE Palm Bay, FL | 4.0 | 2.0 | 1830 | $2,295 | $1.25 | 20d | 1 | 0.43mi |
| 3517 Rixford Way SE Palm Bay, FL | 4.0 | 3.0 | 2562 | $2,800 | $1.09 | 25d | 1 | 0.52mi |
| 1843 Middlebury Dr SE Palm Bay, FL | 4.0 | 2.0 | 1822 | $2,200 | $1.21 | 25d | 1 | 0.56mi |
| 1783 Dittmer Cir SE Palm Bay, FL | 4.0 | 2.0 | 2207 | $2,100 | $0.95 | 25d | 1 | 0.66mi |
| 1046 Grantham Ln SE Palm Bay, FL | 4.0 | 2.5 | 2405 | $3,100 | $1.29 | 25d | 1 | 0.80mi |
| 1496 Dittmer Cir SE Palm Bay, FL | 4.0 | 2.0 | 2187 | $2,440 | $1.12 | 15d | 1 | 0.81mi |
| 2073 Farmhouse Rd SE Palm Bay, FL | 4.0 | 2.0 | 1830 | $2,133 | $1.17 | 25d | 1 | 1.00mi |
| 3004 Suntan Ct SE Palm Bay, FL | 4.0 | 2.0 | 2388 | $2,900 | $1.21 | 25d | 1 | 1.39mi |
Listing history 14 events
-
2026-06-22days on market $394,990 Active 424 DOM
-
2026-06-18days on market $394,990 Active 421 DOM
-
2026-06-17days on market $394,990 Active 420 DOM
-
2026-06-16days on market $394,990 Active 419 DOM
-
2026-06-15days on market $394,990 Active 418 DOM
-
2026-06-14days on market $394,990 Active 416 DOM
-
2026-06-10days on market $394,990 Active 413 DOM
-
2026-06-08days on market $394,990 Active 411 DOM
-
2026-06-07days on market $394,990 Active 410 DOM
-
2026-06-05days on market $394,990 Active 407 DOM
-
2026-06-03days on market $394,990 Active 406 DOM
-
2026-06-02days on market $394,990 Active 405 DOM
-
2026-06-01days on market $394,990 Active 404 DOM
-
2026-05-31days on market $394,990 Active 403 DOM
ⓘ Source: listings_history table (triggers on properties + properties_extension) + one-shot
backfill from property_details.listing_events for pre-trigger history.
Nearby sold comps map
Loading sold comps map…
Walkable amenities ~0.75 mi
Loading nearby amenities…
Taxation est. · year 1
- Rental income
- $31,524
- − Mortgage interest
- −$22,126
- − Property taxes
- −$5,925
- − Insurance
- −$1,975
- − Repairs & maintenance
- −$2,522
- − Management
- −$2,522
- − Depreciation
- −$11,491
- Taxable loss
- −$15,036
- Est. tax savings @ 24.0%
- +$3,609
- After-tax cash flow
- $-4,244/yr
For passive investors: Depreciation is non-cash, so a rental often shows a tax loss while cash-flowing — sheltering income. Rental losses are passive: they offset passive income freely, and up to $25,000/yr can offset ordinary (W-2) income if you actively participate and your MAGI is under $100k (phasing out to $0 by $150k); unused losses carry forward. On sale, claimed depreciation is recaptured at up to 25%, and gains may owe capital-gains tax (a 1031 exchange can defer both). Figures are a year-1 estimate at your 24.0% rate — not tax advice; consult a CPA.
Schools (NCES district)
- District
- Brevard
- NCES district ID
- 1200150
- Math proficiency
- 53% ▼ -9.00%
- Reading proficiency
- 57% ▼ -4.00%
- Median HH income
- $49,426
- Composite
- 46.86/100
- National rank
- #2370
- State rank
- #19 of 73 in FL
Livability — Palm Bay
- Score
- 72/100
- State rank
- #366
- US rank
- #6458
Category grades
Schools grade is shown separately in the Schools card above.
Census & demographics
- Census place
- Palm Bay, FL
- County
- Brevard County · 602,871 people
- City population
- 132,211
- Metro
- Palm Bay-Melbourne-Titusville, FL
- Population (ZIP)
- 41,804
- Household income
- $79,977
- Rent vs Own
- Severe rent burden
- 697.0
Population outlook (Brevard County) Hauer SSP2
- Today (2025)
- 623,254 people
- By 2030
- 648,420 · +4.0%
- By 2040
- 690,009 · +10.7%
- By 2050
- 715,669 · +14.8%
- By 2075
- 775,744 · +24.5%
- By 2100
- 776,687 · +24.6%
Race, ethnicity, and origin ACS 2023
- Neighborhood character
- Diverse neighborhood (Simpson 0.70)
- Race & ethnicity
- White 46% Black 21% Hispanic / Latino 20% Two or more races 16% Asian 4%
- Hispanic origin (detail)
- Mexican 2% Puerto Rican 8% Cuban 5%
- Common ancestry
- Hispanic 3% Slovak 2% Lithuanian 2%
- Foreign-born
- 17% · Canada, China, Jamaica
- Languages at home
- 84% English-only · Spanish 9% French/Haitian/Cajun 4% Chinese 1%
Political lean MEDSL · Brevard
- 2024 margin
- Strong R (+20.8) · D 39.1% · R 59.9% · Other 1.0%
- 2008→2024 swing
- -10.4pp toward R · 2008: -10.4pp · 2024: -20.8pp
- All cycles
- 2024: R+20.8 2020: R+16.4 2016: R+19.8 2012: R+12.7 2008: R+10.4
Not yet ingested
- Civics
- —
Market trends
- HPI YoY
- ▲ 18.81%
- Current HPI
- 330.8595
- Rent YoY
- ▲ 3.67%
- Metro
- Palm Bay-Melbourne-Titusville, FL
- State GDP YoY
- ▲ 3.28%
- F500 in state
- 36
Industry mix (Fortune 500 HQ in FL)
| Industry | F500 HQs | Revenue |
|---|---|---|
| Industrial Technology | 2 | $29B |
|
||
| Insurance | 2 | $17B |
|
||
| Retail | 1 | $60B |
|
||
| Technology Distribution | 1 | $58B |
|
||
| Homebuilding | 1 | $35B |
|
||
| Technology Manufacturing | 1 | $35B |
|
||
Cash-flow waterfall
monthlySold comps — $/sqft
last 12 mo · ≤1 miLoading sold comps…