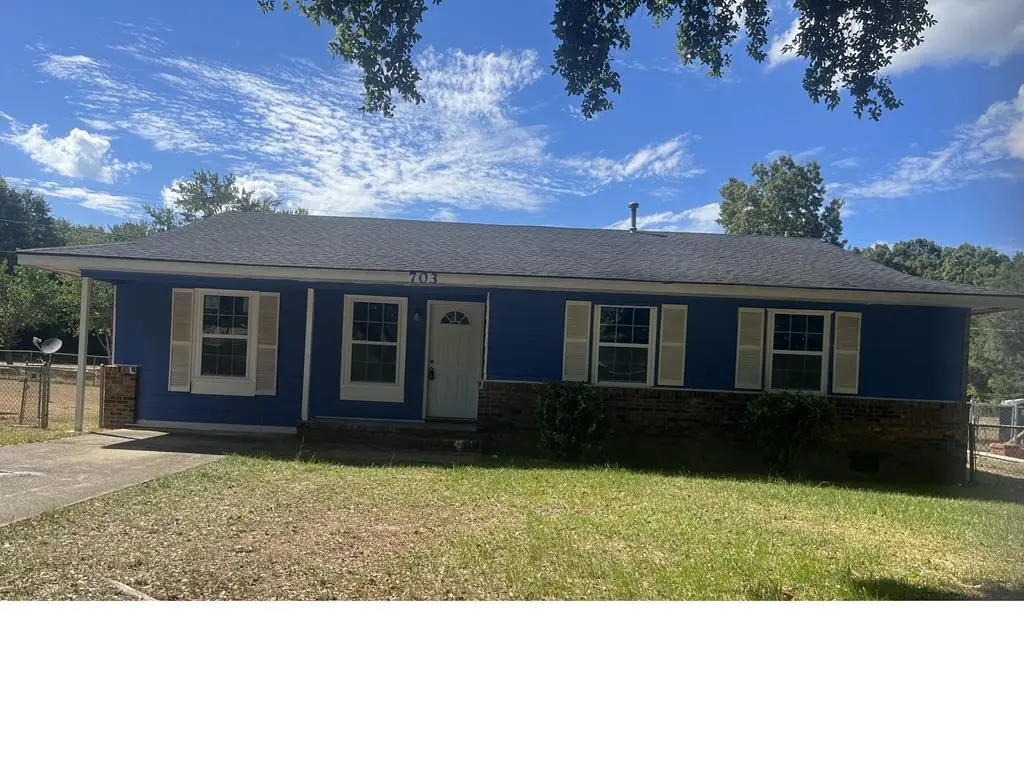
703 Goodall Ave · Albany, GA
Flood risk 6/10 · Moderate
- FEMA flood zone
- D
- Chance of flooding over 30 yrs
- 0.74%
- Est. flood insurance / yr
- $544 – $1,084
Fire risk 3/10 · Minor
- Est. fire insurance / yr
- $963 – $1,789
Heat risk 8/10 · Major
- Hot days now (above 110°F)
- 7 days/yr
- Hot days in 30 yrs
- 19 days/yr
Wind risk 8/10 · Major
- Chance of severe wind over 30 yrs
- 97.0%
Air-quality risk 4/10 · Minor
- Unhealthy air days now
- 5 days/yr
- Unhealthy air days in 30 yrs
- 5 days/yr
Risk factors via First Street. Map © Google.
Why this score? — see what drove the C grade
The composite is a weighted blend of 9 inputs, each scored 0–100. Each bar is that input's sub-score; the figure is the points it added to the 100-point composite (weight × sub-score).
- Cash flow +27.3/30.0
- DSCR +9.5/10.0
- 1% rule +7.6/10.0
- Rent growth +4.5/5.0
- Livability +3.0/5.0
- Condition / age +2.5/5.0
- Schools +1.1/10.0
- ARV discount +0.0/15.0
- Appreciation +0.0/10.0
$89,900
🖨 Deal sheet (PDF) 📄 Offer letter ✓ Due diligence
Listing remarks MLS
Handyman Special! Great investment opportunity to add to your portfolio. Lots of potential that could be a great rehab. Don't miss out on the opportunity. Handyman Special! Great investment opportunity to add to your portfolio. Lots of potential that could be a great rehab. Don't miss out on the opportunity. The property is being sold as-is. If you would like to schedule a viewing, please contact a Realtor
Key facts
- Renovated
- New flooring
- New paint
Tags
Property features AI
Exterior
- Parking: 2 parking spaces
- Utilities: Sewer connected
- Home design: Single-family detached residence; 1 story
- Construction: Brick and frame construction; Shingle roof; Slab foundation; Built on a 0.19-acre lot
- Exterior features: Patio; Chain link fencing; Storage structure
Interior
- Kitchen: Dishwasher
- Flooring: Ceramic tile; Laminate
- Bathrooms: 2 full bathrooms
- Heating & cooling: Electric central heating
- Interior features: Dishwasher; Electric water heater; Laundry room
- Laundry & utility: Laundry room; Electric water heater
Neighborhood map
What this means for you Summary
Snapshot
- This is a 3-bed/2.0-bath single-family listed at $90k.
Deal economics
- At list price, monthly cash flow is $259 ($3k/yr) — positive.
- The deal already cash-flows at list — no discount required.
- Meets the 1% rule at list price ($1k rent vs $90k).
- Recommended offer: $87k (3.0% below list) — sets the bar for market timing.
- Cap rate 9.7% vs local median 5.0% in Albany — top-decile yield for the area; either an underpriced asset or a hidden risk that comps aren't pricing in. Stress-test before assuming the spread holds.
Location & tenants
- Location reads 60/100 on livability (#371 in GA) — a middle-class / working-renter tenant base. Strengths: cost of living A+, housing A-, health & safety B+; Watch: schools F, crime F, amenities F.
- Dougherty County (urban): math 12% / reading 16% proficiency, ranked #163 of 174 in GA (top 94%) — low school quality limits family demand, transient renter base, plan for 1-2y turnover; 79% free/reduced lunch — lower-income household profile, screen leases tightly.
- Market conditions: Rents rising fast (+8.1%/yr); 128 active listings in the ZIP; 1 comparable units currently listed for rent nearby; lower-income renter base — watch delinquency; 45 units permitted in Dougherty County in 2024 (20 in 5+ unit buildings).
- This rent runs 32% of the median local income ($43k/yr) — at the standard rent-burdened threshold; future hikes will face affordability resistance.
Forward outlook
- Local home prices are declining (-3.0%/yr); year-one equity from $622 of loan paydown is wiped out by about $3k of value loss. Plan a longer hold.
- Dougherty County population projected at -24% by 2050 — secular population decline; favor cash flow + early exit over multi-decade hold.
- At projected returns (-3.0% appreciation + 8.0% rent growth), your $25k cash investment doubles in ~7 years — after that, you're playing with house money.
Negotiation context
- It's been on market 36 days — a 3% lower offer ($87k) is reasonable based on typical stale-listing flexibility.
- 10 sale attempts since 3y ago with the ask held roughly flat each time — persistent listings suggest the price (not the market) is what's stuck; bring a comps-based counter.
- Current owner paid $58k; list at $90k implies a 54% gain — meaningful room to come down on a strong offer.
Risks & watch-outs
- Climate carrying-cost: major flood risk; severe wind risk, 97% chance of damaging wind over 30y; extreme-heat days projected 7→19/yr by 2055 (HVAC capex compounding) — expect insurance premiums to compound above CPI over the hold.
Questions for the listing agent
- It's been on market 36 days. Have you received any prior offers? Is the seller open to a 3% concession, seller financing, or rate buy-down credit?
- Built in 1973 — when were the roof, HVAC, electrical panel, plumbing, and water heater last replaced?
- Is there a deadline driving the sale (1031 exchange, divorce, estate, relocation)? That informs how much negotiation room exists.
- Schools are F-rated, which usually means shorter tenancies and higher turnover. Who's the typical renter profile here, and what's been the actual vacancy rate?
- Crime grade is F in this area — have there been break-ins, vandalism, or insurance claims at this property in the last 3 years? What carrier currently insures it and at what premium?
- What's the average days-on-market for RENTAL listings here right now (not sales)? A rising rental-DOM trend means longer vacancies and softer asking-rent achievability than the comps imply.
- What's the recent tenant-quality profile in this submarket — average credit score on applications, eviction rate, late-payment / NSF rate, and stable-employment percentage? A property-management company in the area should have these aggregated.
- How much new for-sale + rental construction is in the pipeline within 1–3 miles? Heavy new supply typically softens prices + rents 12–24 months out; constrained supply supports both.
Investment metrics
- 1% rule
- 1.26% ✓
- Cap rate
- 9.75%
- Cash-on-cash
- 12.35%
- DSCR
- 1.55
- GRM
- 6.6
CMA / ARV
- ARV (on-the-fly)
- $74,613
- Comps found
- 1
Show comp detail 1 sale within ~0.75 mi
| Address | Dist | Beds/Ba | Sqft | Sold | Price | $/sf | Match |
|---|---|---|---|---|---|---|---|
| 704 E Town Rd | 0.23mi | 3/2.0 | 1,463 (0%) | 23mo | $75,000 | $51 | 70 |
Match score weights: distance 35% · size 25% · config 20% · recency 20%. Top-matched comps best support the ARV.
Projected returns pro-forma
-3.0% appreciation · 8.0% rent growth · sell at horizon
- IRR
- 7.6%
- Equity multiple
- 1.32×
- Total profit
- $7,959
- Equity at exit
- $13,404
- IRR
- 20.9%
- Equity multiple
- 3.21×
- Total profit
- $55,611
- Equity at exit
- $7,773
Cash invested: $25,172 (down + closing). Projections, not guarantees.
Landlord ↔ Tenant lean methodology
- Overall (STATE)
- 90 Strongly Landlord-Friendly
- State Georgia
- 90 Strongly Landlord-Friendly · R+3
- County
- — inherits STATE
- City
- — inherits STATE
ZIP-level market 31705
- Home prices YoY
- -20.1%
- Rents YoY
- 8.1%
- Active inventory
- 128
- Price-to-rent
- 6.6×
Monthly cashflow live
- Estimated rent
- $1,136 medium interval (Pro) →
- Mortgage (P&I)
- −$471
- Tax from tax record
- −$130 /mo · $1,556/yr
- Insurance
- −$37
- HOA
- −$0
- Vacancy / Maint / Mgmt
- −$239
- Net cashflow
- $259
Break-even live
Sensitivity live
| Price | -10% $310 | -5% $284 | +0% $259 | +5% $234 | +10% $208 |
|---|---|---|---|---|---|
| Rent | -10% $169 | -5% $214 | +0% $259 | +5% $304 | +10% $349 |
| Rate | -1.0pp $304 | -0.5pp $282 | base $259 | +0.5pp $236 | +1.0pp $212 |
UW: 25.0% down · 7.5% · 30yr · 1.5% tax · 5.0% vac · 8.0% maint · 8.0% mgmt
Financing live
Cash to close
- Down payment
- $22,475
- Closing costs
- $2,697
- Reserves months
- —
- Total cash needed
- —
Loan-product check · same deal, 3 products live
Conventional
25% down · 7.5% · 30yr
- Down + closing
- —
- Monthly P&I
- —
- Monthly cashflow
- —
- DSCR
- —
- Eligible?
- —
Personal DTI + credit; lowest rate.
DSCR
20% down · 8.5% · 30yr
- Down + closing
- —
- Monthly P&I
- —
- Monthly cashflow
- —
- DSCR
- —
- Eligible?
- —
No personal income docs; deal must DSCR.
Hard money
10% down · 12.0% · 12mo
- Down + closing
- —
- Monthly P&I
- —
- Monthly cashflow
- —
- DSCR
- —
- Eligible?
- —
Short-term bridge; refi at stabilization.
Rent comps 1 comps
| Address | Beds | Baths | Sqft | Rent | $/sqft | DOM | Units | Dist |
|---|---|---|---|---|---|---|---|---|
| 1508 E Society Ave Unit B Albany, GA | 2.0 | 1.0 | 1180 | $550 | $0.47 | 22d | 1 | 1.22mi |
Listing history 22 events
-
2026-05-20status Pending
-
2026-04-13$89,900 Active
-
2026-01-19historical $1,300
-
2025-12-02$1,300
-
2025-11-09historical $1,300
-
2025-11-01$1,300
-
2024-09-15historical $1,300
-
2024-09-06$1,300
-
2024-09-06historical $1,300
-
2024-08-24$1,300
-
2024-08-23historical $1,300
-
2024-08-07$1,300
-
2024-08-07historical $1,300
-
2024-08-06$1,300
-
2024-08-03historical $1,300
-
2024-07-24$1,300
-
2024-07-24historical $1,300
-
2024-07-22$1,300
-
2023-10-02soldstatus $58,400
-
2023-09-30soldstatus $58,400 Sold 409-char remark
Show marketing remark (409 chars)
Handyman Special! Great investment opportunity to add to your portfolio. Lots of potential that could be a great rehab. Don't miss out on the opportunity. Handyman Special! Great investment opportunity to add to your portfolio. Lots of potential that could be a great rehab. Don't miss out on the opportunity. The property is being sold as-is. If you would like to schedule a viewing, please contact a Realtor
-
2023-09-16status Under Contract 409-char remark
Show marketing remark (409 chars)
Handyman Special! Great investment opportunity to add to your portfolio. Lots of potential that could be a great rehab. Don't miss out on the opportunity. Handyman Special! Great investment opportunity to add to your portfolio. Lots of potential that could be a great rehab. Don't miss out on the opportunity. The property is being sold as-is. If you would like to schedule a viewing, please contact a Realtor
-
2023-07-24$59,900 New 409-char remark
Show marketing remark (409 chars)
Handyman Special! Great investment opportunity to add to your portfolio. Lots of potential that could be a great rehab. Don't miss out on the opportunity. Handyman Special! Great investment opportunity to add to your portfolio. Lots of potential that could be a great rehab. Don't miss out on the opportunity. The property is being sold as-is. If you would like to schedule a viewing, please contact a Realtor
ⓘ Source: listings_history table (triggers on properties + properties_extension) + one-shot
backfill from property_details.listing_events for pre-trigger history.
Tax reassessment forecast GA · Resets to sale price
- Current annual tax
- $1,556 · $130/mo
- Projected year-2 tax
- $1,556 · $130/mo
- Expected delta
- $0/yr ($0/mo · 0.0%)
ⓘ Screening estimate from a state-policy table — verify with the county assessor before closing.
Climate risk First Street
- Flood 6/10 Major FEMA zone D · 74% chance over 30 yrs
- Wildfire 3/10 Moderate
- Heat 8/10 Severe 7 d/yr ≥110°F today · 19 d/yr by 30 yrs out
- Wind 8/10 Severe 97% chance of damaging wind over 30 yrs
- Air quality 4/10 Moderate 5 unhealthy d/yr today · 5 by 30 yrs out
Nearby sold comps map
Loading sold comps map…
Walkable amenities ~0.75 mi
Loading nearby amenities…
Taxation est. · year 1
- Rental income
- $13,633
- − Mortgage interest
- −$5,036
- − Property taxes
- −$1,556
- − Insurance
- −$450
- − Repairs & maintenance
- −$1,091
- − Management
- −$1,091
- − Depreciation
- −$2,615
- Taxable income
- $1,796
- Est. tax owed @ 24.0%
- −$431
- After-tax cash flow
- $2,677/yr
For passive investors: Depreciation is non-cash, so a rental often shows a tax loss while cash-flowing — sheltering income. Rental losses are passive: they offset passive income freely, and up to $25,000/yr can offset ordinary (W-2) income if you actively participate and your MAGI is under $100k (phasing out to $0 by $150k); unused losses carry forward. On sale, claimed depreciation is recaptured at up to 25%, and gains may owe capital-gains tax (a 1031 exchange can defer both). Figures are a year-1 estimate at your 24.0% rate — not tax advice; consult a CPA.
Schools (NCES district)
- District
- Dougherty County
- NCES district ID
- 1301830
- Math proficiency
- 12% ▼ -15.00%
- Reading proficiency
- 16% ▼ -9.00%
- Median HH income
- $33,105
- Composite
- 11.31/100
- National rank
- #9716
- State rank
- #163 of 174 in GA
Livability — Albany
- Score
- 60/100
- State rank
- #371
- US rank
- #18903
Category grades
Schools grade is shown separately in the Schools card above.
Census & demographics
- Census place
- Albany, GA
- County
- Dougherty County · 89,040 people
- City population
- 89,040
- Metro
- Albany, GA
- Population (ZIP)
- 30,791
- Household income
- $42,972
- Rent vs Own
- Severe rent burden
- 1933.0
Population outlook (Dougherty County) Hauer SSP2
- Today (2025)
- 84,551 people
- By 2030
- 80,637 · -4.6%
- By 2040
- 72,090 · -14.7%
- By 2050
- 64,056 · -24.2%
- By 2075
- 46,332 · -45.2%
- By 2100
- 33,127 · -60.8%
Race, ethnicity, and origin ACS 2023
- Neighborhood character
- Predominantly Black (68%)
- Race & ethnicity
- Black 68% White 23% Hispanic / Latino 6% Two or more races 4%
- Hispanic origin (detail)
- Mexican 2% Puerto Rican 1%
- Common ancestry
- Lithuanian 1%
- Foreign-born
- 3% · Canada
- Languages at home
- 94% English-only · Spanish 5% Other Asian/Pacific 1%
Political lean MEDSL · Dougherty
- 2024 margin
- Solid D (+41.1) · D 70.4% · R 29.3%
- 2008→2024 swing
- +6.2pp toward D · 2008: 35.0pp · 2024: 41.1pp
- All cycles
- 2024: D+41.1 2020: D+40.0 2016: D+38.3 2012: D+39.0 2008: D+35.0
Not yet ingested
- Civics
- —
Market trends
- HPI YoY
- ▼ -38.46%
- Current HPI
- 152.4574
- Rent YoY
- ▲ 8.10%
- Metro
- Albany, GA
- State GDP YoY
- ▲ 2.66%
- F500 in state
- 28
Industry mix (Fortune 500 HQ in GA)
| Industry | F500 HQs | Revenue |
|---|---|---|
| Paper / Packaging | 2 | $29B |
|
||
| Retail | 1 | $160B |
|
||
| Transportation / Logistics | 1 | $91B |
|
||
| Airlines | 1 | $62B |
|
||
| Consumer Goods | 1 | $47B |
|
||
| Utilities | 1 | $25B |
|
||
Price history
+50.1% since first listed22 events — show timeline
- 2026-05-20 Pending — SWGABOR
- 2026-04-13 Listed $89,900 SWGABOR
- 2026-01-19 Rental Removed $1,300 RENTALBEAST
- 2025-12-02 Listed for Rent $1,300 RENTALBEAST
- 2025-11-09 Rental Removed $1,300 RENTALBEAST
- 2025-11-01 Listed for Rent $1,300 RENTALBEAST
- 2024-09-15 Rental Removed $1,300 RENTALBEAST
- 2024-09-06 Listed for Rent $1,300 RENTALBEAST
- 2024-09-06 Rental Removed $1,300 LEASESTAR
- 2024-08-24 Listed for Rent $1,300 LEASESTAR
- 2024-08-23 Rental Removed $1,300 RENTALBEAST
- 2024-08-07 Listed for Rent $1,300 RENTALBEAST
- 2024-08-07 Rental Removed $1,300 LEASESTAR
- 2024-08-06 Listed for Rent $1,300 LEASESTAR
- 2024-08-03 Rental Removed $1,300 RENTALBEAST
- 2024-07-24 Listed for Rent $1,300 RENTALBEAST
- 2024-07-24 Rental Removed $1,300 LEASESTAR
- 2024-07-22 Listed for Rent $1,300 LEASESTAR
- 2023-10-02 Sold (Public Records) $58,400 Public Records
- 2023-09-30 Sold (MLS) $58,400 GAMLS
- 2023-09-16 Pending — GAMLS
- 2023-07-24 Listed $59,900 GAMLS
Property tax history
+5.3%/yrLatest (2025): $1,556 · +201.9% YoY. Source: county tax records.
Cash-flow waterfall
monthlySold comps — $/sqft
last 12 mo · ≤1 miLoading sold comps…