 Multi-family
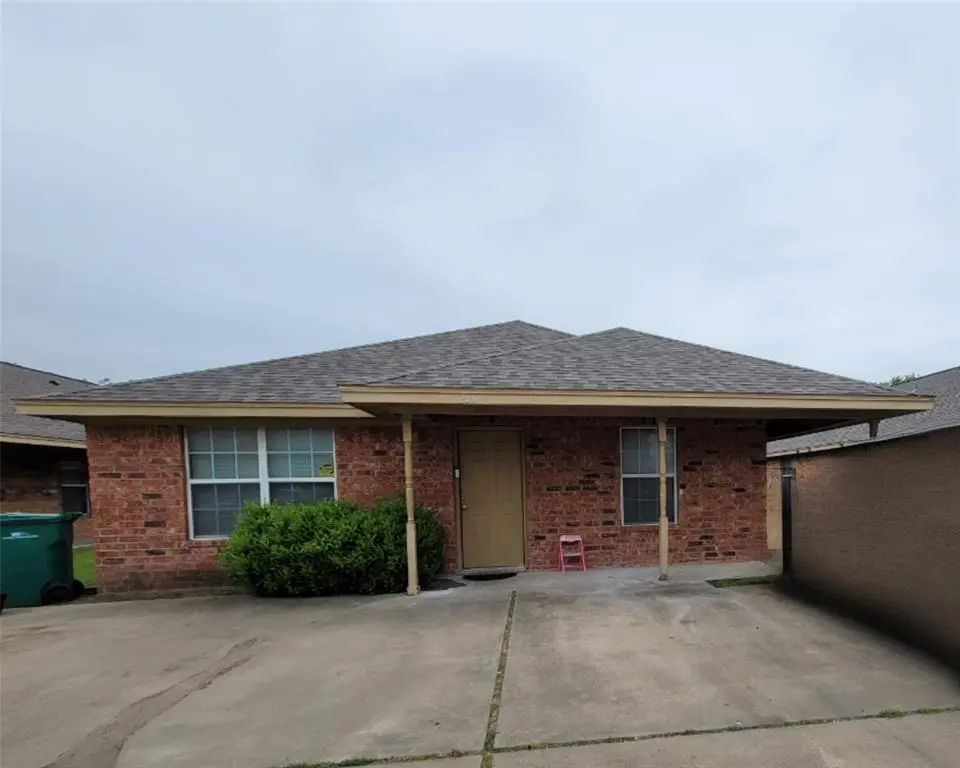
231-233 E Craven Ave · Lacy-Lakeview, TX
Flood risk 1/10 · Minimal
- FEMA flood zone
- X (unshaded)
- Chance of flooding over 30 yrs
- 0.0%
- Est. flood insurance / yr
- $507 – $1,088
Fire risk 4/10 · Minor
- Est. fire insurance / yr
- $1,222 – $2,270
Heat risk 7/10 · Major
- Hot days now (above 110°F)
- 7 days/yr
- Hot days in 30 yrs
- 24 days/yr
Wind risk 6/10 · Moderate
- Chance of severe wind over 30 yrs
- 59.0%
Air-quality risk 2/10 · Minimal
- Unhealthy air days now
- 0 days/yr
- Unhealthy air days in 30 yrs
- 1 days/yr
Risk factors via First Street. Map © Google.
Why this score? — see what drove the B- grade
The composite is a weighted blend of 9 inputs, each scored 0–100. Each bar is that input's sub-score; the figure is the points it added to the 100-point composite (weight × sub-score).
- Cash flow +30.0/30.0
- DSCR +10.0/10.0
- 1% rule +8.1/10.0
- ARV discount +7.5/15.0
- Rent growth +3.1/5.0
- Livability +2.5/5.0
- Condition / age +2.5/5.0
- Schools +1.7/10.0
- Appreciation +0.0/10.0
$231,250
🖨 Deal sheet 📄 Offer letter ✓ Due diligence
Multi-family units
County records classify this as Multi-Family (2-4 Unit). Listing-text estimate: 1 unit. estimate disagrees with records
Listing remarks
Investment Opportunity - Duplex in Lacy Lakeview, Waco Area Don't miss this fantastic duplex in the heart of Lacy Lakeview, offering two spacious 3-bedroom, 2-bathroom units — ideal for investors or owner-occupants looking to offset their mortgage. Each unit features a comfortable, functional layout with plenty of living space to attract quality tenants. Residents will love the convenience of off-street parking and a fenced backyard — sought-after extras that set this property apart. Situated with easy access to major highways, everything the Waco area has to offer is just minutes away, including a thriving downtown, the iconic Magnolia Silos, and an ever-growing lineup of re
Key facts
- Off-street parking
- Fenced backyard
- New roof
Tags
Property features AI
Finance
- Financial info: Acceptable financing: Cash, Conventional, Other; No second mortgage
- HOA & community: No association
Exterior
- Parking: No garage or carport; Driveway and off-street parking on asphalt
- Utilities: City water with individual water meter; City sewer; Electricity connected; Cable available; Phone available; Underground utilities
- Home design: Single-family residence; One story; Residential property; Subdivision: Lacy Summit
- Construction: Brick construction; Shingle roof; Built in 2004
- Exterior features: Covered patio/porch; Chain link fencing; Asphalt driveway; Off-street parking
Interior
- Kitchen: Dishwasher; Electric range
- Bedrooms: 6 bedrooms (primary bedroom on level 1 with ensuite bath and walk-in closet)
- Flooring: Luxury vinyl plank; Tile
- Bathrooms: 4 bathrooms
- Heating & cooling: Central heating (electric); Central air conditioning; Ceiling fans
- Interior features: Cable TV available; High-speed internet available; Window coverings; Other
- Laundry & utility: Full-size washer/dryer area; Washer hookup; Electric dryer hookup; Utility room; Electric water heater
Neighborhood map
What this means for you Summary
Snapshot
- This is a 2-bed/1.0-bath multifamily listed at $231k.
Deal economics
- At list price, monthly cash flow is $869 ($10k/yr) — positive.
- The deal already cash-flows at list — no discount required.
- Meets the 1% rule at list price ($3k rent vs $231k).
- Cap rate 10.8% vs local median 5.1% in Lacy-Lakeview — top-decile yield for the area; either an underpriced asset or a hidden risk that comps aren't pricing in. Stress-test before assuming the spread holds.
Location & tenants
- Location reads: area grade B — affects rentability + tenant quality, not the cash-flow math above.
- Connally ISD (suburban): math 16% / reading 25% proficiency, ranked #781 of 826 in TX (top 95%) — low school quality limits family demand, transient renter base, plan for 1-2y turnover; 68% free/reduced lunch — lower-income household profile, screen leases tightly.
- Zoned schools: Connally El (math 13% / reading 22%, grade F, #3,805 of 4,322 statewide, top 89%, 374 students, 87% FRL) — zoned schools average 87% FRL vs 68% district-wide (19 pts higher); higher-poverty schools than district average — tighter screening recommended.
- Market conditions: Rents rising (+2.2%/yr); 297 active listings in the ZIP; 2 comparable units currently listed for rent nearby; 1,014 units permitted in McLennan County in 2024 (200 in 5+ unit buildings).
- At $3,027/mo this rent would consume 62% of the median local household income ($58k/yr) (locally 668% of renters already pay >50% of income on rent) — very limited rent-growth headroom before tenants either downsize or default.
Forward outlook
- Local home prices are declining (-3.0%/yr); year-one equity from $2k of loan paydown is wiped out by about $7k of value loss. Plan a longer hold.
- McLennan County population projected at +17% by 2050 — long-run rental-demand tailwind backs the buy-and-hold thesis.
- At projected returns (-3.0% appreciation + 2.2% rent growth), your $65k cash investment doubles in ~8 years — after that, you're playing with house money.
Negotiation context
- Only 12 days on market — expect competitive offers; lowballing is unlikely to land.
Risks & watch-outs
- Climate carrying-cost: major wind risk, 59% chance of damaging wind over 30y; extreme-heat days projected 7→24/yr by 2055 (HVAC capex compounding) — expect insurance premiums to compound above CPI over the hold.
Questions for the listing agent
- Is there a deadline driving the sale (1031 exchange, divorce, estate, relocation)? That informs how much negotiation room exists.
- What's the average days-on-market for RENTAL listings here right now (not sales)? A rising rental-DOM trend means longer vacancies and softer asking-rent achievability than the comps imply.
- What's the recent tenant-quality profile in this submarket — average credit score on applications, eviction rate, late-payment / NSF rate, and stable-employment percentage? A property-management company in the area should have these aggregated.
- How much new apartment / multifamily construction is in the pipeline within 1–3 miles? Heavy new supply (>2% of stock underway) typically softens rents 12–24 months out; light construction supports rent growth.
Investment metrics
- 1% rule
- 1.31% ✓
- Cap rate
- 10.80%
- Cash-on-cash
- 16.10%
- DSCR
- 1.72
- GRM
- 6.4
CMA / ARV
No comps found within radius.
Projected returns pro-forma
-3.0% appreciation · 2.2% rent growth · sell at horizon
- IRR
- 6.2%
- Equity multiple
- 1.24×
- Total profit
- $15,443
- Equity at exit
- $34,480
- IRR
- 14.9%
- Equity multiple
- 2.16×
- Total profit
- $74,935
- Equity at exit
- $19,994
Cash invested: $64,750 (down + closing). Projections, not guarantees.
Landlord ↔ Tenant lean methodology
- Overall (STATE)
- 87 Strongly Landlord-Friendly
- State Texas
- 87 Strongly Landlord-Friendly · R+5
- County
- — inherits STATE
- City
- — inherits STATE
ZIP-level market 76705
- Home prices YoY
- -29.6%
- Rents YoY
- 2.2%
- Active inventory
- 297
- Price-to-rent
- 12.7×
Monthly cashflow live
- Estimated rent
- $3,027 high interval (Pro) →
- Mortgage (P&I)
- −$1,213
- Tax from tax record
- −$213 /mo · $2,562/yr
- Insurance
- −$96
- HOA
- −$0
- Vacancy / Maint / Mgmt
- −$636
- Net cashflow
- $869
Break-even live
2-unit breakdown (identical units grouped — click to expand)
| Units | Beds | Baths | Est. rent |
|---|---|---|---|
| 2× units | 3 | 2 | $3,028 |
| #1 | 3 | 2 | $1,514 |
| #2 | 3 | 2 | $1,514 |
| Total (2 units) | $3,027 | ||
UW: 25.0% down · 7.5% · 30yr · 1.5% tax · 5.0% vac · 8.0% maint · 8.0% mgmt
Financing live
Cash to close
- Down payment
- $57,812
- Closing costs
- $6,938
- Reserves months
- —
- Total cash needed
- —
Loan-product check · same deal, 3 products live
Conventional
25% down · 7.5% · 30yr
- Down + closing
- —
- Monthly P&I
- —
- Monthly cashflow
- —
- DSCR
- —
- Eligible?
- —
Personal DTI + credit; lowest rate.
DSCR
20% down · 8.5% · 30yr
- Down + closing
- —
- Monthly P&I
- —
- Monthly cashflow
- —
- DSCR
- —
- Eligible?
- —
No personal income docs; deal must DSCR.
Hard money
10% down · 12.0% · 12mo
- Down + closing
- —
- Monthly P&I
- —
- Monthly cashflow
- —
- DSCR
- —
- Eligible?
- —
Short-term bridge; refi at stabilization.
Rent comps 2 comps
| Address | Beds | Baths | Sqft | Rent | $/sqft | DOM | Units | Dist |
|---|---|---|---|---|---|---|---|---|
| 326 S Barbara St Waco, TX | 3.0 | 2.0 | 1722 | $2,300 | $1.34 | 13d | 1 | 0.84mi |
| 209 S Rita St Waco, TX | 3.0 | 2.0 | 1692 | $1,575 | $0.93 | 13d | 1 | 1.00mi |
Listing history 9 events
-
2026-06-09status $231,250 Pending 12 DOM
-
2026-06-08days on market $231,250 Active 12 DOM
-
2026-06-07days on market $231,250 Active 11 DOM
-
2026-06-05days on market $231,250 Active 8 DOM
-
2026-06-02days on market $231,250 Active 6 DOM
-
2026-06-01days on market $231,250 Active 5 DOM
-
2026-05-31days on market $231,250 Active 4 DOM
-
2026-05-30days on market $231,250 Active 3 DOM
-
2026-05-26$231,250 Active
ⓘ Source: listings_history table (triggers on properties + properties_extension) + one-shot
backfill from property_details.listing_events for pre-trigger history.
Tax reassessment forecast TX · Resets to sale price
- Current annual tax
- $2,562 · $213/mo
- Projected year-2 tax
- $4,232 · $353/mo
- Expected delta
- +$1,670/yr (+$139/mo · 65.2%)
ⓘ Screening estimate from a state-policy table — verify with the county assessor before closing.
Climate risk First Street
- Flood 1/10 Low FEMA zone X (unshaded) · 0% chance over 30 yrs
- Wildfire 4/10 Moderate
- Heat 7/10 Severe 7 d/yr ≥110°F today · 24 d/yr by 30 yrs out
- Wind 6/10 Major 59% chance of damaging wind over 30 yrs
- Air quality 2/10 Low 0 unhealthy d/yr today · 1 by 30 yrs out
Nearby sold comps map
Loading sold comps map…
Walkable amenities ~0.75 mi
Loading nearby amenities…
Taxation est. · year 1
- Rental income
- $36,324
- − Mortgage interest
- −$12,954
- − Property taxes
- −$2,562
- − Insurance
- −$1,156
- − Repairs & maintenance
- −$2,906
- − Management
- −$2,906
- − Depreciation
- −$6,727
- Taxable income
- $7,113
- Est. tax owed @ 24.0%
- −$1,707
- After-tax cash flow
- $8,718/yr
For passive investors: Depreciation is non-cash, so a rental often shows a tax loss while cash-flowing — sheltering income. Rental losses are passive: they offset passive income freely, and up to $25,000/yr can offset ordinary (W-2) income if you actively participate and your MAGI is under $100k (phasing out to $0 by $150k); unused losses carry forward. On sale, claimed depreciation is recaptured at up to 25%, and gains may owe capital-gains tax (a 1031 exchange can defer both). Figures are a year-1 estimate at your 24.0% rate — not tax advice; consult a CPA.
Schools (NCES district)
- District
- Connally ISD
- NCES district ID
- 4814970
- Math proficiency
- 16% ▼ -10.00%
- Reading proficiency
- 25% ▼ -5.00%
- Median HH income
- $35,388
- Composite
- 16.9/100
- National rank
- #9141
- State rank
- #781 of 826 in TX
Livability — Lacy-Lakeview
No livability data for this city. (Only ~50 U.S. cities are tracked.)
Census & demographics
- Census place
- Lacy-Lakeview, TX
- County
- McLennan County · 213,088 people
- City population
- 31,616
- Metro
- Waco, TX
- Population (ZIP)
- 31,616
- Household income
- $58,236
- Rent vs Own
- Severe rent burden
- 668.0
Population outlook (McLennan County) Hauer SSP2
- Today (2025)
- 264,191 people
- By 2030
- 273,578 · +3.6%
- By 2040
- 291,506 · +10.3%
- By 2050
- 308,044 · +16.6%
- By 2075
- 349,648 · +32.3%
- By 2100
- 364,779 · +38.1%
Race, ethnicity, and origin ACS 2023
- Neighborhood character
- Diverse neighborhood (Simpson 0.68)
- Race & ethnicity
- White 43% Hispanic / Latino 32% Two or more races 20% Black 18% Native American 1% Asian 1%
- Hispanic origin (detail)
- Mexican 31%
- Common ancestry
- Slovak 2% Lithuanian 1% Serbian 1%
- Foreign-born
- 13% · Canada, Vietnam
- Languages at home
- 73% English-only · Spanish 24% Other Indo-European 1% German/W. Germanic 1%
Political lean MEDSL · McLennan
- 2024 margin
- Solid R (+30.9) · D 34.0% · R 64.9% · Other 1.0%
- 2008→2024 swing
- -7.0pp toward R · 2008: -23.9pp · 2024: -30.9pp
- All cycles
- 2024: R+30.9 2020: R+23.4 2016: R+27.1 2012: R+29.8 2008: R+23.9
Not yet ingested
- Civics
- —
Market trends
- HPI YoY
- ▼ -91.45%
- Current HPI
- 217.9429
- Rent YoY
- ▲ 2.20%
- Metro
- Waco, TX
- State GDP YoY
- ▲ 3.95%
- F500 in state
- 110
Industry mix (Fortune 500 HQ in TX)
| Industry | F500 HQs | Revenue |
|---|---|---|
| Energy | 16 | $1,198B |
|
||
| Technology | 5 | $198B |
|
||
| Engineering / Construction | 4 | $72B |
|
||
| Energy Services | 3 | $60B |
|
||
| Utilities | 3 | $41B |
|
||
| Healthcare | 2 | $330B |
|
||
Price history
1 event — show timeline
- 2026-05-26 Listed $231,250 NTREIS
Property tax history
-7.2%/yrLatest (2025): $2,562 · -14.3% YoY. Source: county tax records.
Cash-flow waterfall
monthlySold comps — $/sqft
last 12 mo · ≤1 miLoading sold comps…