11609 Sugarloaf Peak Ct · Spanish Springs, NV
Flood risk No data
- FEMA flood zone
- —
- Chance of flooding over 30 yrs
- —
- Est. flood insurance / yr
- —
Fire risk No data
- Est. fire insurance / yr
- —
Heat risk No data
- Hot days now (above threshold)
- —
- Hot days in 30 yrs
- —
Wind risk No data
- Chance of severe wind over 30 yrs
- —
Air-quality risk No data
- Unhealthy air days now
- —
- Unhealthy air days in 30 yrs
- —
Risk factors via First Street. Map © Google.
Why this score? — see what drove the F grade
The composite is a weighted blend of 9 inputs, each scored 0–100. Each bar is that input's sub-score; the figure is the points it added to the 100-point composite (weight × sub-score).
- Cash flow +13.0/30.0
- DSCR +3.9/10.0
- 1% rule +3.7/10.0
- Livability +3.4/5.0
- Schools +3.2/10.0
- Rent growth +2.5/5.0
- Condition / age +2.5/5.0
- ARV discount +0.0/15.0
- Appreciation +0.0/10.0
$906,340
🖨 Deal sheet (PDF) 📄 Offer letter ✓ Due diligence
Listing remarks
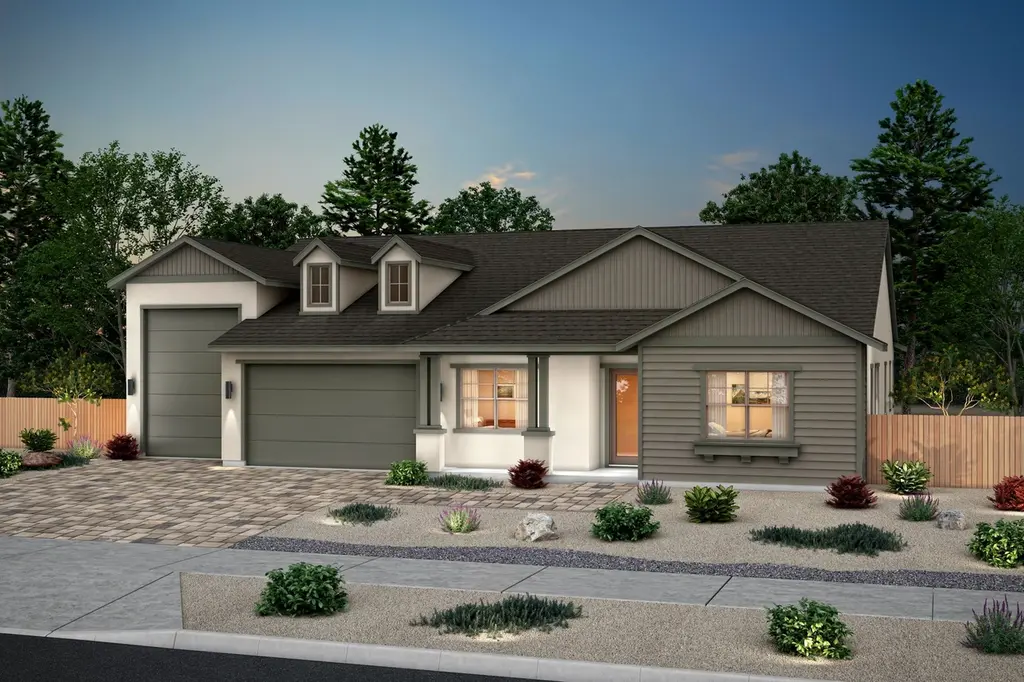
Homesite 160 showcases Plan 2 in the bold American Contemporary style with Color Scheme 2, situated on an expansive 10,298 sq. ft. lot. Highlights include a Western corner stacking slider with screens to give a seamless transition between indoor and outdoor living. The garage has been upgraded to our RV garage with a 10' wide door and a 8' x 8' rear garage door. The great room features a traditional style fireplace. We have included a luxury freestanding tub in the primary bathroom for that extra touch of elegance. The laundry features a white cast iron sink.
Key facts
- 10 wide door
- Rv garage
- White cast iron sink
Tags
Property features AI
Finance
- Other: Living area listed as 2811; List price available
- HOA & community: Association fee: $31 (period not specified)
Exterior
- Parking: 4 parking spaces
- Utilities: Electric service; Natural gas; Public/central cooling (Central Air)
- Home design: Spec new construction, Plan 2 (American)
Interior
- Kitchen: Dishwasher; Disposal; Microwave
- Bedrooms: 3 bedrooms
- Bathrooms: 3 full bathrooms; 1 half bathroom
- Heating & cooling: Forced air heating (electric and natural gas); Central air conditioning
- Interior features: Dishwasher; Disposal; Microwave
Neighborhood map
What this means for you Summary
Snapshot
- This is a 3-bed/3.5-bath single-family listed at $906k.
Deal economics
- At list price, monthly cash flow is $-54 ($-642/yr) — negative.
- To cash-flow at today's rent, offer at most $899k (0.9% below list).
- To meet the 1% rule (rent ≥ 1% of price), the offer needs to be $790k (12.8% below list).
- Recommended offer: $790k (12.8% below list) — sets the bar for 1% rule.
- Cap rate 6.2% vs local median 3.2% in Spanish Springs — top-decile yield for the area; either an underpriced asset or a hidden risk that comps aren't pricing in. Stress-test before assuming the spread holds.
Location & tenants
- Location reads 67/100 on livability (#35 in NV) — a middle-class / working-renter tenant base. Strengths: employment A+, housing A+, crime A; Watch: amenities F, commute F, cost of living F.
- Washoe County School District (urban): math 30% / reading 44% proficiency, ranked #6 of 17 in NV (top 35%) — families likely to look elsewhere, expect single-tenant / working-renter base with shorter leases.
- Zoned schools: Alyce Taylor Elementary (math 54% / reading 55%, grade C, #42 of 402 statewide, top 10%, 452 students, 27% FRL); Yvonne Shaw Middle School (math 33% / reading 57%, grade D, #14 of 109 statewide, top 13%, 712 students, 20% FRL); Spanish Springs High School (math 18% / reading 41%, grade F, #67 of 131 statewide, top 53%, 2,057 students, 17% FRL) — zoned schools average 22% FRL vs 42% district-wide (20 pts lower); this property's tenant base skews higher-income than the district average.
- Market conditions: 143 active listings in the ZIP; 1 comparable units currently listed for rent nearby; 4,085 units permitted in Washoe County in 2024 (1,634 in 5+ unit buildings).
Forward outlook
- Local home prices are declining (-3.0%/yr); year-one equity from $6k of loan paydown is wiped out by about $27k of value loss. Plan a longer hold.
- Washoe County population projected at +19% by 2050 — long-run rental-demand tailwind backs the buy-and-hold thesis.
Negotiation context
- Only 9 days on market — expect competitive offers; lowballing is unlikely to land.
Questions for the listing agent
- What do current leases actually rent for vs. the listed asking? Can we see a recent rent roll and the last 12 months of T-12 income?
- What does the HOA fee cover, when was the last increase, and are there any pending special assessments or reserve-fund shortfalls?
- Is there a deadline driving the sale (1031 exchange, divorce, estate, relocation)? That informs how much negotiation room exists.
- The area grade is low — what's the realistic commute time and amenity access for the typical tenant pool here? Any planned neighborhood developments (good or bad) we should know about?
- What's the average days-on-market for RENTAL listings here right now (not sales)? A rising rental-DOM trend means longer vacancies and softer asking-rent achievability than the comps imply.
- What's the recent tenant-quality profile in this submarket — average credit score on applications, eviction rate, late-payment / NSF rate, and stable-employment percentage? A property-management company in the area should have these aggregated.
- How much new for-sale + rental construction is in the pipeline within 1–3 miles? Heavy new supply typically softens prices + rents 12–24 months out; constrained supply supports both.
Investment metrics
- 1% rule
- 0.87% ✗
- Cap rate
- 6.22%
- Cash-on-cash
- -0.25%
- DSCR
- 0.99
- GRM
- 9.6
CMA / ARV
- ARV (on-the-fly)
- $753,348
- Comps found
- 12
Show comp detail 12 sales within ~0.75 mi
| Address | Dist | Beds/Ba | Sqft | Sold | Price | $/sf | Match |
|---|---|---|---|---|---|---|---|
| 11568 W Spanish Rnch Dr | 0.18mi | 3/3.5 | 2,811 (0%) | 4mo | $739,990 | $263 | 88 |
| 510 La Tray Dr Unit Magnolia 83 | 0.13mi | 4/3.0 (+1) | 2,729 (-3%) | 2mo | $725,000 | $266 | 80 |
| 450 Hutchinson Dr Unit Willows 105 | 0.18mi | 3/2.5 | 2,709 (-4%) | 4mo | $771,990 | $285 | 78 |
| 433 Pah Rah Ridge Dr Unit Willows 110 | 0.24mi | 3/2.5 | 2,704 (-4%) | 4mo | $750,000 | $277 | 75 |
| 420 Pah Rah Ridge Dr | 0.25mi | 4/3.5 (+1) | 2,930 (+4%) | 3mo | $930,000 | $317 | 74 |
| 11602 Vinegar Peak Dr | 0.31mi | 3/2.5 | 2,704 (-4%) | 3mo | $795,970 | $294 | 73 |
| 11565 Vinegar Peak Dr Unit Willows 118 | 0.31mi | 4/3.5 (+1) | 2,933 (+4%) | 3mo | $795,000 | $271 | 71 |
| 11640 Crosby Ranch Dr | 0.21mi | 4/4.5 (+1) | 3,007 (+7%) | 3mo | $768,000 | $255 | 67 |
| 520 La Tray Dr Unit Magnolia 82 | 0.14mi | 3/2.5 | 2,389 (-15%) | 3mo | $640,000 | $268 | 62 |
| 415 Pah Rah Rdg Dr Unit Harris 107 | 0.21mi | 4/3.5 (+1) | 3,206 (+14%) | 5mo | $850,000 | $265 | 58 |
| 11557 Vinegar Peak Dr Unit Harris 116 | 0.32mi | 4/3.5 (+1) | 3,206 (+14%) | 3mo | $800,000 | $250 | 54 |
| 11691 Hacienda Ridge Way | 0.56mi | 4/2.5 (+1) | 3,035 (+8%) | 4mo | $750,000 | $247 | 48 |
Match score weights: distance 35% · size 25% · config 20% · recency 20%. Top-matched comps best support the ARV.
Projected returns pro-forma
-3.0% appreciation · 3.0% rent growth · sell at horizon
- IRR
- -16.7%
- Equity multiple
- 0.41×
- Total profit
- $-150,136
- Equity at exit
- $135,138
- IRR
- -8.5%
- Equity multiple
- 0.47×
- Total profit
- $-134,563
- Equity at exit
- $78,364
Cash invested: $253,775 (down + closing). Projections, not guarantees.
Landlord ↔ Tenant lean methodology
- Overall (STATE)
- 71 Landlord-Friendly
- State Nevada
- 71 Landlord-Friendly · R+1
- County
- — inherits STATE
- City
- — inherits STATE
ZIP-level market 89441
- Home prices YoY
- -18.5%
- Active inventory
- 143
- Price-to-rent
- 9.6×
Monthly cashflow live
- Estimated rent
- $7,900 medium interval (Pro) →
- Mortgage (P&I)
- −$4,753
- Tax est. 1.5%
- −$1,133 /mo · $13,595/yr
- Insurance
- −$378
- HOA
- −$31
- Vacancy / Maint / Mgmt
- −$1,659
- Net cashflow
- $-54
Break-even live
Sensitivity live
| Price | -10% $573 | -5% $260 | +0% $-54 | +5% $-367 | +10% $-680 |
|---|---|---|---|---|---|
| Rent | -10% $-678 | -5% $-366 | +0% $-54 | +5% $259 | +10% $571 |
| Rate | -1.0pp $403 | -0.5pp $177 | base $-54 | +0.5pp $-288 | +1.0pp $-527 |
UW: 25.0% down · 7.5% · 30yr · 1.5% tax · 5.0% vac · 8.0% maint · 8.0% mgmt
Financing live
Cash to close
- Down payment
- $226,585
- Closing costs
- $27,190
- Reserves months
- —
- Total cash needed
- —
Loan-product check · same deal, 3 products live
Conventional
25% down · 7.5% · 30yr
- Down + closing
- —
- Monthly P&I
- —
- Monthly cashflow
- —
- DSCR
- —
- Eligible?
- —
Personal DTI + credit; lowest rate.
DSCR
20% down · 8.5% · 30yr
- Down + closing
- —
- Monthly P&I
- —
- Monthly cashflow
- —
- DSCR
- —
- Eligible?
- —
No personal income docs; deal must DSCR.
Hard money
10% down · 12.0% · 12mo
- Down + closing
- —
- Monthly P&I
- —
- Monthly cashflow
- —
- DSCR
- —
- Eligible?
- —
Short-term bridge; refi at stabilization.
Rent comps 1 comps
| Address | Beds | Baths | Sqft | Rent | $/sqft | DOM | Units | Dist |
|---|---|---|---|---|---|---|---|---|
| 430 Calle de la Plata Sparks, NV | 3.0 | 2.0 | 2056 | $7,900 | $3.84 | 25d | 1 | 0.95mi |
HOA detail
- Monthly dues
- $31 · $372/yr
Listing history 7 events
-
2026-06-22days on market $906,340 Active 9 DOM
-
2026-06-18days on market $906,340 Active 6 DOM
-
2026-06-17days on market $906,340 Active 5 DOM
-
2026-06-16days on market $906,340 Active 4 DOM
-
2026-06-15days on market $906,340 Active 3 DOM
-
2026-06-14remarks 565-char remark
-
2026-06-14$906,340 Active 1 DOM
ⓘ Source: listings_history table (triggers on properties + properties_extension) + one-shot
backfill from property_details.listing_events for pre-trigger history.
Nearby sold comps map
Loading sold comps map…
Walkable amenities ~0.75 mi
Loading nearby amenities…
Taxation est. · year 1
- Rental income
- $94,800
- − Mortgage interest
- −$50,769
- − Property taxes
- −$13,595
- − Insurance
- −$4,532
- − Repairs & maintenance
- −$7,584
- − Management
- −$7,584
- − HOA
- −$372
- − Depreciation
- −$26,366
- Taxable loss
- −$16,002
- Est. tax savings @ 24.0%
- +$3,841
- After-tax cash flow
- $3,198/yr
For passive investors: Depreciation is non-cash, so a rental often shows a tax loss while cash-flowing — sheltering income. Rental losses are passive: they offset passive income freely, and up to $25,000/yr can offset ordinary (W-2) income if you actively participate and your MAGI is under $100k (phasing out to $0 by $150k); unused losses carry forward. On sale, claimed depreciation is recaptured at up to 25%, and gains may owe capital-gains tax (a 1031 exchange can defer both). Figures are a year-1 estimate at your 24.0% rate — not tax advice; consult a CPA.
Schools (NCES district)
- District
- Washoe County School District
- NCES district ID
- 3200480
- Math proficiency
- 30% ▼ -9.00%
- Reading proficiency
- 44% ▼ -4.00%
- Median HH income
- $55,025
- Composite
- 32.44/100
- National rank
- #5721
- State rank
- #6 of 17 in NV
Livability — Spanish Springs
- Score
- 67/100
- State rank
- #35
- US rank
- #11102
Category grades
Schools grade is shown separately in the Schools card above.
Census & demographics
- Census place
- Spanish Springs, NV
- City population
- 13,854
- Population (ZIP)
- 13,854
Population outlook (Washoe County) Hauer SSP2
- Today (2025)
- 499,260 people
- By 2030
- 523,429 · +4.8%
- By 2040
- 564,420 · +13.1%
- By 2050
- 595,548 · +19.3%
- By 2075
- 652,375 · +30.7%
- By 2100
- 661,518 · +32.5%
Race, ethnicity, and origin ACS 2023
- Neighborhood character
- Predominantly White (74%)
- Race & ethnicity
- White 74% Hispanic / Latino 13% Two or more races 10% Native American 5% Asian 1%
- Hispanic origin (detail)
- Mexican 7%
- Common ancestry
- Italian 5% Lithuanian 3% Slovak 2%
- Foreign-born
- 3% · Canada, South Korea
- Languages at home
- 94% English-only · Spanish 3% Other Indo-European 1%
Political lean MEDSL · Washoe
- 2024 margin
- Toss-up / Even · D 49.3% · R 48.3% · Other 2.4%
- 2008→2024 swing
- -11.7pp toward R · 2008: 12.7pp · 2024: 1.0pp
- All cycles
- 2024: D+1.0 2020: D+4.5 2016: D+1.2 2012: D+3.6 2008: D+12.7
Not yet ingested
- Civics
- —
Market trends
- HPI YoY
- ▼ -74.99%
- Current HPI
- 330.2277
- Rent YoY
- —
- Metro
- —
- State GDP YoY
- ▲ 3.08%
- F500 in state
- 6
Industry mix (Fortune 500 HQ in NV)
| Industry | F500 HQs | Revenue |
|---|---|---|
| Hotels / Casinos | 3 | $36B |
|
||
Cash-flow waterfall
monthlySold comps — $/sqft
last 12 mo · ≤1 miLoading sold comps…