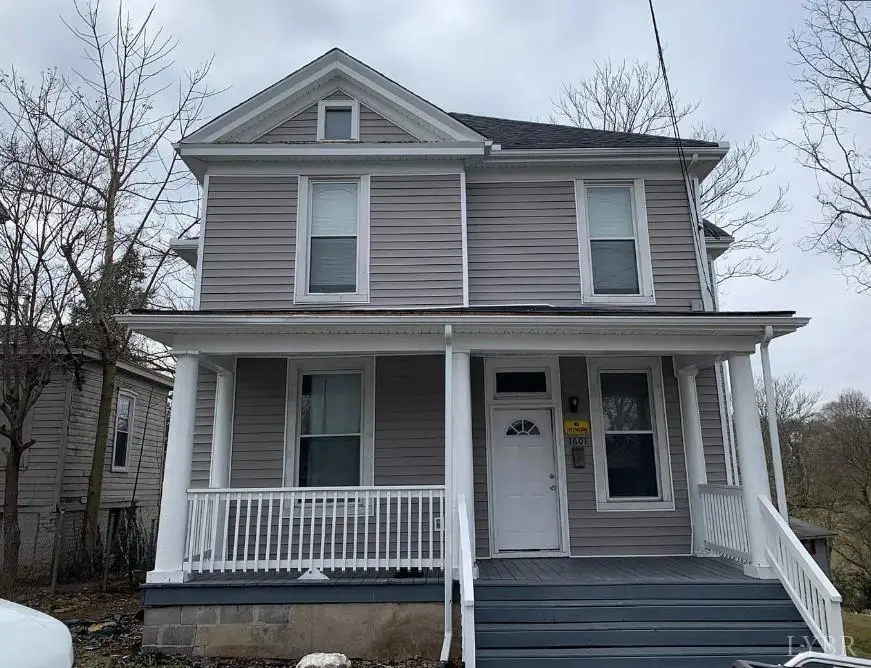
1601 Union St · Lynchburg, VA
Flood risk 1/10 · Minimal
- FEMA flood zone
- X (unshaded)
- Chance of flooding over 30 yrs
- 0.0%
- Est. flood insurance / yr
- $507 – $1,088
Fire risk 3/10 · Minor
- Est. fire insurance / yr
- $666 – $1,236
Heat risk 6/10 · Moderate
- Hot days now (above 102°F)
- 7 days/yr
- Hot days in 30 yrs
- 18 days/yr
Wind risk 2/10 · Minimal
- Chance of severe wind over 30 yrs
- 2.0%
Air-quality risk 2/10 · Minimal
- Unhealthy air days now
- 0 days/yr
- Unhealthy air days in 30 yrs
- 1 days/yr
Risk factors via First Street. Map © Google.
Why this score? — see what drove the B grade
The composite is a weighted blend of 9 inputs, each scored 0–100. Each bar is that input's sub-score; the figure is the points it added to the 100-point composite (weight × sub-score).
- Cash flow +30.0/30.0
- DSCR +10.0/10.0
- 1% rule +9.3/10.0
- ARV discount +7.7/15.0
- Livability +4.5/5.0
- Schools +4.0/10.0
- Rent growth +3.6/5.0
- Condition / age +2.5/5.0
- Appreciation +0.0/10.0
$110,000
🖨 Deal sheet 📄 Offer letter ✓ Due diligence
Listing remarks MLS
Pleasant two story home on a corner lot, within walking distance to Main Street in Lynchburg. Home is currently being rented out per room and brings in $2200/month, with one room currently vacant. Home has been updated in the last five years with new roof, windows, natural gas furnace, vinyl siding and more. Call today from more information!
Key facts
- Mostly new windows
- Recent upgrades
- Complete repipe
Tags
Property features AI
Finance
- Other: Listing broker: XRealty.net LLC; Listing agent: Norman Domingo
Exterior
- Utilities: Public water; Public sewer
- Home design: Single-family residential; 2-story
- Exterior features: Approximately 0.1274-acre lot; Subdivision: White Rock; Directions: 1601 Union Street, Lynchburg, VA 24504
Interior
- Kitchen: Gas range; Refrigerator; Dishwasher
- Flooring: Wood
- Bathrooms: 2 full bathrooms
- Heating & cooling: Window unit(s) for cooling
- Interior features: Electric water heater; Wood flooring
- Laundry & utility: Washer and dryer; Laundry located in basement
Neighborhood map
What this means for you Summary
Snapshot
- This is a 3-bed/2.0-bath single-family listed at $110k.
Deal economics
- At list price, monthly cash flow is $504 ($6k/yr) — positive.
- The deal already cash-flows at list — no discount required.
- Meets the 1% rule at list price ($2k rent vs $110k).
- Recommended offer: $108k (1.5% below list) — sets the bar for market timing.
- Cap rate 11.8% vs local median 4.0% in Lynchburg — top-decile yield for the area; either an underpriced asset or a hidden risk that comps aren't pricing in. Stress-test before assuming the spread holds.
Location & tenants
- Location reads 91/100 on livability (#1 in VA, #58 nationally) — a professional / high-income tenant draw. Strengths: amenities A+, commute A+, cost of living A+; Watch: crime C-, employment D+.
- Lynchburg City Public School District (urban): math 36% / reading 61% proficiency, ranked #104 of 131 in VA (top 79%) — families likely to look elsewhere, expect single-tenant / working-renter base with shorter leases; 61% free/reduced lunch — lower-income household profile, screen leases tightly.
- Market conditions: Rents rising fast (+4.6%/yr); 105 active listings in the ZIP; 20 comparable units currently listed for rent nearby; rentals at typical pace (median 21d on market — plan ~3-4 weeks tenant-placement turnaround); 472 units permitted in Lynchburg city in 2024 (240 in 5+ unit buildings).
- This rent runs 36% of the median local income ($53k/yr) — at the standard rent-burdened threshold; future hikes will face affordability resistance.
Forward outlook
- Local home prices are declining (-3.0%/yr); year-one equity from $761 of loan paydown is wiped out by about $3k of value loss. Plan a longer hold.
- Lynchburg County population projected at +37% by 2050 — long-run rental-demand tailwind backs the buy-and-hold thesis.
- At projected returns (-3.0% appreciation + 4.6% rent growth), your $31k cash investment doubles in ~6 years — after that, you're playing with house money.
Negotiation context
- It's been on market 15 days — a 2% lower offer ($108k) is reasonable based on typical stale-listing flexibility.
- 3 sale attempts since 6y ago with the ask held roughly flat each time — persistent listings suggest the price (not the market) is what's stuck; bring a comps-based counter.
Risks & watch-outs
- Watch-outs: built in 1907 — expect roof / HVAC / electrical / plumbing capex.
- Climate carrying-cost: extreme-heat days projected 7→18/yr by 2055 (HVAC capex compounding) — expect insurance premiums to compound above CPI over the hold.
Questions for the listing agent
- Built in 1907 — when were the roof, HVAC, electrical panel, plumbing, and water heater last replaced?
- Is there a deadline driving the sale (1031 exchange, divorce, estate, relocation)? That informs how much negotiation room exists.
- Schools are A-rated — typically a magnet for longer-tenancy family renters. What's the average tenant stay here, and is there a school-zone premium baked into asking?
- What's the average days-on-market for RENTAL listings here right now (not sales)? A rising rental-DOM trend means longer vacancies and softer asking-rent achievability than the comps imply.
- What's the recent tenant-quality profile in this submarket — average credit score on applications, eviction rate, late-payment / NSF rate, and stable-employment percentage? A property-management company in the area should have these aggregated.
- How much new for-sale + rental construction is in the pipeline within 1–3 miles? Heavy new supply typically softens prices + rents 12–24 months out; constrained supply supports both.
Investment metrics
- 1% rule
- 1.43% ✓
- Cap rate
- 11.80%
- Cash-on-cash
- 19.66%
- DSCR
- 1.87
- GRM
- 5.8
CMA / ARV
- ARV (median comp)
- $110,491
- List price
- $110,000
- Delta
- -0.44%
- Verdict
- FAIR
- Comps
- 20 within 1.0 mi
Show comp detail 12 sales within ~0.75 mi
| Address | Dist | Beds/Ba | Sqft | Sold | Price | $/sf | Match |
|---|---|---|---|---|---|---|---|
| 509 Franklin St St | 0.07mi | 3/2.0 | 1,860 (+0%) | 2mo | $180,000 | $97 | 94 |
| 1706 Union St | 0.05mi | 3/2.0 | 1,720 (-7%) | 6mo | $85,000 | $49 | 81 |
| 1021 Harrison St | 0.46mi | 3/2.0 | 1,942 (+5%) | 2mo | $250,000 | $129 | 68 |
| 1603 Taylor St | 0.43mi | 3/1.5 | 1,948 (+5%) | 6mo | $90,500 | $46 | 64 |
| 1009 16th St. St | 0.33mi | 3/1.0 | 1,730 (-6%) | 8mo | $189,900 | $110 | 64 |
| 1321 Taylor St | 0.48mi | 4/2.0 (+1) | 1,806 (-2%) | 6mo | $136,000 | $75 | 63 |
| 713 Polk St | 0.74mi | 3/2.0 | 1,838 (-1%) | 3mo | $105,000 | $57 | 62 |
| 110 Emmit Dr | 0.60mi | 4/2.5 (+1) | 1,903 (+3%) | 2mo | $345,447 | $182 | 58 |
| 1109 Harrison St | 0.41mi | 3/1.0 | 1,650 (-11%) | 4mo | $265,000 | $161 | 55 |
| 1434 Augusta St | 0.75mi | 3/2.0 | 1,976 (+7%) | 2mo | $182,000 | $92 | 52 |
| 1206 10th St | 0.65mi | 4/2.5 (+1) | 1,605 (-13%) | 6mo | $199,900 | $125 | 36 |
| 614 7th St | 0.70mi | 3/3.0 | 2,125 (+15%) | 10mo | $297,000 | $140 | 31 |
Match score weights: distance 35% · size 25% · config 20% · recency 20%. Top-matched comps best support the ARV.
Projected returns pro-forma
-3.0% appreciation · 4.56% rent growth · sell at horizon
- IRR
- 13.4%
- Equity multiple
- 1.55×
- Total profit
- $16,816
- Equity at exit
- $16,401
- IRR
- 23.4%
- Equity multiple
- 3.16×
- Total profit
- $66,648
- Equity at exit
- $9,511
Cash invested: $30,800 (down + closing). Projections, not guarantees.
Landlord ↔ Tenant lean methodology
- Overall (STATE)
- 55 Moderately Landlord-Leaning
- State Virginia
- 55 Moderately Landlord-Leaning · D+2
- County
- — inherits STATE
- City
- — inherits STATE
ZIP-level market 24504
- Home prices YoY
- -12.7%
- Rents YoY
- 4.6%
- Active inventory
- 105
- Price-to-rent
- 5.8×
Monthly cashflow live
- Estimated rent
- $1,569 high interval (Pro) →
- Mortgage (P&I)
- −$577
- Tax from tax record
- −$113 /mo · $1,352/yr
- Insurance
- −$46
- HOA
- −$0
- Vacancy / Maint / Mgmt
- −$330
- Net cashflow
- $504
Break-even live
UW: 25.0% down · 7.5% · 30yr · 1.5% tax · 5.0% vac · 8.0% maint · 8.0% mgmt
Financing live
Cash to close
- Down payment
- $27,500
- Closing costs
- $3,300
- Reserves months
- —
- Total cash needed
- —
Loan-product check · same deal, 3 products live
Conventional
25% down · 7.5% · 30yr
- Down + closing
- —
- Monthly P&I
- —
- Monthly cashflow
- —
- DSCR
- —
- Eligible?
- —
Personal DTI + credit; lowest rate.
DSCR
20% down · 8.5% · 30yr
- Down + closing
- —
- Monthly P&I
- —
- Monthly cashflow
- —
- DSCR
- —
- Eligible?
- —
No personal income docs; deal must DSCR.
Hard money
10% down · 12.0% · 12mo
- Down + closing
- —
- Monthly P&I
- —
- Monthly cashflow
- —
- DSCR
- —
- Eligible?
- —
Short-term bridge; refi at stabilization.
Rent comps 20 comps
| Address | Beds | Baths | Sqft | Rent | $/sqft | DOM | Units | Dist |
|---|---|---|---|---|---|---|---|---|
| 1500 Main St Lynchburg, VA | 1.0–2.0 | 1.0 | 1182 | $1,600 | $1.35 | 13d | 6 | 0.25mi |
| 1701 Grace St Lynchburg, VA | 4.0 | 2.0 | 2173 | $1,495 | $0.69 | 13d | 1 | 0.28mi |
| 1316 Harrison St Lynchburg, VA | 3.0 | 1.5 | 1535 | $1,500 | $0.98 | 43d | 1 | 0.30mi |
| 1521 Taylor St Lynchburg, VA | 3.0 | 1.0 | 1337 | $1,195 | $0.89 | 21d | 1 | 0.44mi |
| 1308 16th St Lynchburg, VA | 3.0 | 2.0 | 1380 | $1,800 | $1.30 | 13d | 1 | 0.50mi |
| 1415 Floyd St Lynchburg, VA | 3.0 | 2.0 | 1300 | $1,800 | $1.38 | 21d | 1 | 0.59mi |
| 1518 Fillmore St Lynchburg, VA | 3.0 | 2.5 | 1560 | $1,800 | $1.15 | 13d | 1 | 0.60mi |
| 1110 11th St Lynchburg, VA | 3.0 | 1.5 | 2000 | $1,450 | $0.72 | 13d | 1 | 0.60mi |
| 1514 Fillmore St Lynchburg, VA | 3.0 | 2.5 | 1560 | $1,800 | $1.15 | 13d | 1 | 0.60mi |
| 1008 8th St Lynchburg, VA | 3.0 | 2.0 | 1316 | $1,795 | $1.36 | 21d | 1 | 0.74mi |
| 812 Taylor St Lynchburg, VA | 3.0 | 2.0 | 1872 | $1,950 | $1.04 | 13d | 1 | 0.75mi |
| 1105 Fillmore St Unit B Lynchburg, VA | 3.0 | 1.0 | 1300 | $1,250 | $0.96 | 43d | 1 | 0.75mi |
| 512 Polk St Lynchburg, VA | 3.0 | 1.0 | 1340 | $1,295 | $0.97 | 21d | 1 | 0.90mi |
| 800 Pierce St Lynchburg, VA | 4.0 | 1.0 | 1714 | $1,295 | $0.76 | 43d | 1 | 0.93mi |
| 1009 4th St Apt 1 Lynchburg, VA | 2.0 | 1.0 | 2607 | $795 | $0.30 | 43d | 1 | 1.02mi |
| 710 Grady St Unit B Lynchburg, VA | 2.0 | 1.0 | 1872 | $795 | $0.42 | 13d | 1 | 1.20mi |
| 403 Grove St Lynchburg, VA | 3.0 | 2.0 | 1400 | $1,600 | $1.14 | 43d | 1 | 1.35mi |
| 507 Victoria Ave Unit 507 Lynchburg, VA | 4.0 | 2.0 | 1480 | $1,700 | $1.15 | 21d | 1 | 1.35mi |
| 209 Munford St Lynchburg, VA | 3.0 | 2.5 | 1420 | $1,497 | $1.05 | 44d | 1 | 1.40mi |
| 630 Park Ln Lynchburg, VA | 4.0 | 1.5 | 1434 | $1,895 | $1.32 | 13d | 1 | 1.42mi |
Listing history 12 events
-
2026-05-11$110,000 Active 246-char remark
-
2022-04-26historical 343-char remark
Show marketing remark (343 chars)
Pleasant two story home on a corner lot, within walking distance to Main Street in Lynchburg. Home is currently being rented out per room and brings in $2200/month, with one room currently vacant. Home has been updated in the last five years with new roof, windows, natural gas furnace, vinyl siding and more. Call today from more information!
-
2022-04-25status Pending 343-char remark
Show marketing remark (343 chars)
Pleasant two story home on a corner lot, within walking distance to Main Street in Lynchburg. Home is currently being rented out per room and brings in $2200/month, with one room currently vacant. Home has been updated in the last five years with new roof, windows, natural gas furnace, vinyl siding and more. Call today from more information!
-
2022-04-25soldstatus $146,000 Closed 343-char remark
Show marketing remark (343 chars)
Pleasant two story home on a corner lot, within walking distance to Main Street in Lynchburg. Home is currently being rented out per room and brings in $2200/month, with one room currently vacant. Home has been updated in the last five years with new roof, windows, natural gas furnace, vinyl siding and more. Call today from more information!
-
2022-04-22soldstatus $146,000
-
2022-02-10historical 343-char remark
Show marketing remark (343 chars)
Pleasant two story home on a corner lot, within walking distance to Main Street in Lynchburg. Home is currently being rented out per room and brings in $2200/month, with one room currently vacant. Home has been updated in the last five years with new roof, windows, natural gas furnace, vinyl siding and more. Call today from more information!
-
2022-02-07$144,900 343-char remark
Show marketing remark (343 chars)
Pleasant two story home on a corner lot, within walking distance to Main Street in Lynchburg. Home is currently being rented out per room and brings in $2200/month, with one room currently vacant. Home has been updated in the last five years with new roof, windows, natural gas furnace, vinyl siding and more. Call today from more information!
-
2020-07-21soldstatus $70,000
Show marketing remark (406 chars)
Nice looking home on a corner lot! 3 BR/2 BA single family home currently rented out by the room bringing in $2,100 per month. 4 rooms currently rented. LR & DR are set up as BR's to make 5 total BR's. Roof, windows & gas furnace replaced 3-5 years ago, vinyl siding & front porch decking & paint replaced 1 year ago. Hardwood flooring and vinyl throughout home. SOLD AS IS WHERE IS
-
2020-01-30$69,900
Show marketing remark (406 chars)
Nice looking home on a corner lot! 3 BR/2 BA single family home currently rented out by the room bringing in $2,100 per month. 4 rooms currently rented. LR & DR are set up as BR's to make 5 total BR's. Roof, windows & gas furnace replaced 3-5 years ago, vinyl siding & front porch decking & paint replaced 1 year ago. Hardwood flooring and vinyl throughout home. SOLD AS IS WHERE IS
-
2004-01-08soldstatus $60,000
-
2002-01-28soldstatus $25,000
ⓘ Source: listings_history table (triggers on properties + properties_extension) + one-shot
backfill from property_details.listing_events for pre-trigger history.
Tax reassessment forecast VA · Resets to sale price
- Current annual tax
- $1,352 · $113/mo
- Projected year-2 tax
- $1,352 · $113/mo
- Expected delta
- $0/yr ($0/mo · 0.0%)
ⓘ Screening estimate from a state-policy table — verify with the county assessor before closing.
Climate risk First Street
- Flood 1/10 Low FEMA zone X (unshaded) · 0% chance over 30 yrs
- Wildfire 3/10 Moderate
- Heat 6/10 Major 7 d/yr ≥102°F today · 18 d/yr by 30 yrs out
- Wind 2/10 Low 2% chance of damaging wind over 30 yrs
- Air quality 2/10 Low 0 unhealthy d/yr today · 1 by 30 yrs out
Nearby sold comps map
Loading sold comps map…
Walkable amenities ~0.75 mi
Loading nearby amenities…
Taxation est. · year 1
- Rental income
- $18,833
- − Mortgage interest
- −$6,162
- − Property taxes
- −$1,352
- − Insurance
- −$550
- − Repairs & maintenance
- −$1,507
- − Management
- −$1,507
- − Depreciation
- −$3,200
- Taxable income
- $4,556
- Est. tax owed @ 24.0%
- −$1,093
- After-tax cash flow
- $4,960/yr
For passive investors: Depreciation is non-cash, so a rental often shows a tax loss while cash-flowing — sheltering income. Rental losses are passive: they offset passive income freely, and up to $25,000/yr can offset ordinary (W-2) income if you actively participate and your MAGI is under $100k (phasing out to $0 by $150k); unused losses carry forward. On sale, claimed depreciation is recaptured at up to 25%, and gains may owe capital-gains tax (a 1031 exchange can defer both). Figures are a year-1 estimate at your 24.0% rate — not tax advice; consult a CPA.
Schools (NCES district)
- District
- Lynchburg City Public School District
- NCES district ID
- 5102340
- Math proficiency
- 36% ▼ -38.00%
- Reading proficiency
- 61% ▼ -8.00%
- Median HH income
- $39,097
- Composite
- 40.4/100
- National rank
- #3730
- State rank
- #104 of 131 in VA
Livability — Lynchburg
- Score
- 91/100
- State rank
- #1
- US rank
- #58
Category grades
Schools grade is shown separately in the Schools card above.
Census & demographics
- Census place
- Lynchburg, VA
- County
- Lynchburg City · 97,036 people
- City population
- 97,036
- Metro
- Lynchburg, VA
- Population (ZIP)
- 9,632
- Household income
- $52,571
- Rent vs Own
- Severe rent burden
- 552.0
Population outlook (Lynchburg County) Hauer SSP2
- Today (2025)
- 87,977 people
- By 2030
- 93,626 · +6.4%
- By 2040
- 106,145 · +20.7%
- By 2050
- 120,783 · +37.3%
- By 2075
- 162,249 · +84.4%
- By 2100
- 191,358 · +117.5%
Race, ethnicity, and origin ACS 2023
- Neighborhood character
- Diverse neighborhood (Simpson 0.57)
- Race & ethnicity
- White 51% Black 40% Two or more races 6% Hispanic / Latino 4%
- Common ancestry
- Italian 3% Lithuanian 1% Serbian 1%
- Foreign-born
- 4% · Canada, China
- Languages at home
- 95% English-only · Spanish 3% Chinese 1%
Political lean MEDSL · Lynchburg
- 2024 margin
- Lean R (+7.9) · D 45.4% · R 53.3% · Other 1.3%
- 2008→2024 swing
- -3.9pp toward R · 2008: -4.0pp · 2024: -7.9pp
- All cycles
- 2024: R+7.9 2020: D+2.6 2016: R+9.0 2012: R+10.6 2008: R+4.0
Not yet ingested
- Civics
- —
Market trends
- HPI YoY
- ▼ -33.39%
- Current HPI
- 229.4423
- Rent YoY
- ▲ 4.56%
- Metro
- Lynchburg, VA
- State GDP YoY
- ▲ 2.40%
- F500 in state
- 50
Industry mix (Fortune 500 HQ in VA)
| Industry | F500 HQs | Revenue |
|---|---|---|
| Aerospace / Defense | 4 | $236B |
|
||
| Technology / Defense | 3 | $32B |
|
||
| Financial Services | 2 | $176B |
|
||
| Utilities | 2 | $27B |
|
||
| Insurance | 2 | $25B |
|
||
| Technology | 2 | $15B |
|
||
Price history
+340.0% since first listed12 events — show timeline
- 2026-05-11 Listed $110,000 LMLS
- 2022-04-26 Delisted — LMLS
- 2022-04-25 Pending — LMLS
- 2022-04-25 Sold (MLS) $146,000 LMLS
- 2022-04-25 Sold (MLS) $146,000 LMLS
- 2022-04-22 Sold (Public Records) $146,000 Public Records
- 2022-02-10 Delisted — LMLS
- 2022-02-07 Listed $144,900 LMLS
- 2020-07-21 Sold (MLS) $70,000 LMLS
- 2020-01-30 Listed $69,900 LMLS
- 2004-01-08 Sold (Public Records) $60,000 Public Records
- 2002-01-28 Sold (Public Records) $25,000 Public Records
Property tax history
+9.0%/yrLatest (2025): $1,352 · +9.7% YoY. Source: county tax records.
Cash-flow waterfall
monthlySold comps — $/sqft
last 12 mo · ≤1 miLoading sold comps…