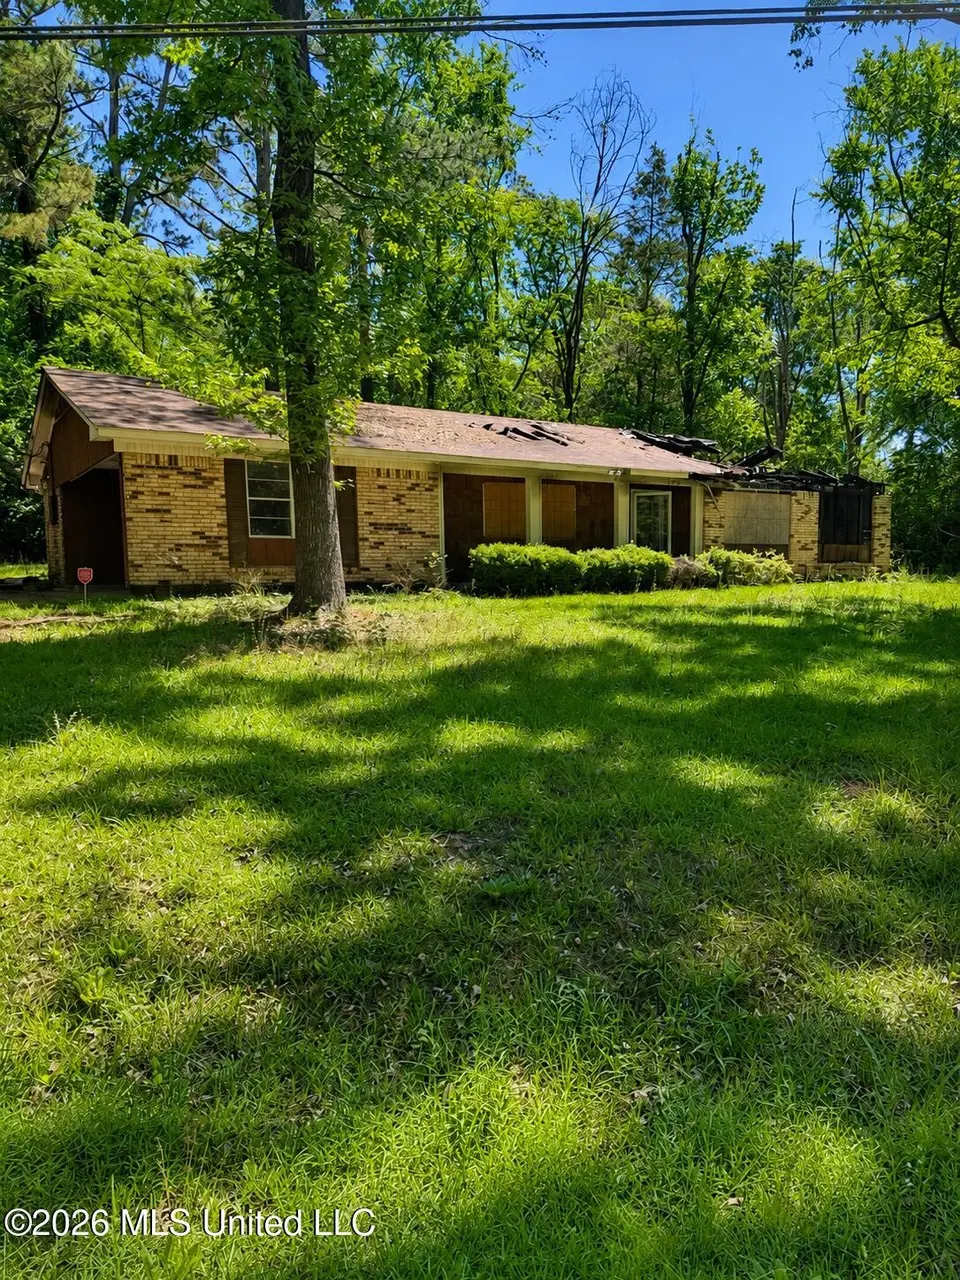
5506 Concord Dr · Jackson, MS
Flood risk 1/10 · Minimal
- FEMA flood zone
- X (unshaded)
- Chance of flooding over 30 yrs
- 0.0%
- Est. flood insurance / yr
- $507 – $1,088
Fire risk 1/10 · Minimal
- Est. fire insurance / yr
- $1,241 – $2,305
Heat risk 7/10 · Major
- Hot days now (above 108°F)
- 7 days/yr
- Hot days in 30 yrs
- 20 days/yr
Wind risk 8/10 · Major
- Chance of severe wind over 30 yrs
- 80.0%
Air-quality risk 2/10 · Minimal
- Unhealthy air days now
- 0 days/yr
- Unhealthy air days in 30 yrs
- 1 days/yr
Risk factors via First Street. Map © Google.
Why this score? — see what drove the D grade
The composite is a weighted blend of 9 inputs, each scored 0–100. Each bar is that input's sub-score; the figure is the points it added to the 100-point composite (weight × sub-score).
- Cash flow +15.0/30.0
- ARV discount +7.5/15.0
- 1% rule +5.0/10.0
- DSCR +5.0/10.0
- Rent growth +4.5/5.0
- Livability +3.4/5.0
- Condition / age +2.5/5.0
- Schools +1.1/10.0
- Appreciation +0.0/10.0
$30,000
🖨 Deal sheet 📄 Offer letter ✓ Due diligence
Listing remarks MLS
Home is being sold AS IS due to complete fire damage. **The house cannot be entered for viewing until after Tuesday, September 3rd.**
Key facts
- Covered carport
- Private neighborhood
- Spacious lot
Tags
Property features AI
Exterior
- Parking: Carport with 2 spaces; Driveway parking; Total parking for 6 vehicles
- Utilities: Public water; Public sewer
- Home design: Single-family house; One level
- Construction: Brick construction; Slab foundation; Built year sourced from public records
- Exterior features: Approximately 0.55-acre lot
Interior
- Bathrooms: 2 full bathrooms
- Heating & cooling: No central cooling indicated
- Interior features: One-story layout
Neighborhood map
What this means for you Summary
Snapshot
- This is a 3-bed/2.0-bath single-family listed at $30k.
Deal economics
- At list price, monthly cash flow is $1k ($13k/yr) — positive.
- The deal already cash-flows at list — no discount required.
- Meets the 1% rule at list price ($2k rent vs $30k).
- Cap rate 50.7% vs local median 9.9% in Jackson — top-decile yield for the area; either an underpriced asset or a hidden risk that comps aren't pricing in. Stress-test before assuming the spread holds.
Location & tenants
- Location reads 68/100 on livability (#66 in MS) — a middle-class / working-renter tenant base. Strengths: commute A+, cost of living A+, housing A+; Watch: amenities F, employment F, health & safety F.
- Jackson Public School District (urban): math 9% / reading 18% proficiency, ranked #112 of 130 in MS (top 86%) — low school quality limits family demand, transient renter base, plan for 1-2y turnover; 88% free/reduced lunch — lower-income household profile, screen leases tightly.
- Zoned schools: North Jackson Elementary School (math 7% / reading 25%, grade F, #270 of 375 statewide, top 72%, 383 students, 100% FRL).
- Market conditions: Rents rising fast (+7.9%/yr); 221 active listings in the ZIP; 15 comparable units currently listed for rent nearby; rentals at typical pace (median 24d on market — plan ~3-4 weeks tenant-placement turnaround); 167 units permitted in Hinds County in 2024 (0 in 5+ unit buildings).
Forward outlook
- Local home prices are declining (-3.0%/yr); year-one equity from $207 of loan paydown is wiped out by about $900 of value loss. Plan a longer hold.
- Hinds County population projected to shrink 6% by 2050 — rents likely to lag national; underwrite the cash flow, not the appreciation.
- At projected returns (-3.0% appreciation + 7.9% rent growth), your $8k cash investment doubles in ~1 year — after that, you're playing with house money.
Negotiation context
- Only 3 days on market — expect competitive offers; lowballing is unlikely to land.
- 4 sale attempts since 3y ago with the ask held roughly flat each time — persistent listings suggest the price (not the market) is what's stuck; bring a comps-based counter.
Risks & watch-outs
- Climate carrying-cost: severe wind risk, 80% chance of damaging wind over 30y; extreme-heat days projected 7→20/yr by 2055 (HVAC capex compounding) — expect insurance premiums to compound above CPI over the hold.
Questions for the listing agent
- Built in 1962 — when were the roof, HVAC, electrical panel, plumbing, and water heater last replaced?
- Is there a deadline driving the sale (1031 exchange, divorce, estate, relocation)? That informs how much negotiation room exists.
- Schools are F-rated, which usually means shorter tenancies and higher turnover. Who's the typical renter profile here, and what's been the actual vacancy rate?
- The area grade is low — what's the realistic commute time and amenity access for the typical tenant pool here? Any planned neighborhood developments (good or bad) we should know about?
- What's the average days-on-market for RENTAL listings here right now (not sales)? A rising rental-DOM trend means longer vacancies and softer asking-rent achievability than the comps imply.
- What's the recent tenant-quality profile in this submarket — average credit score on applications, eviction rate, late-payment / NSF rate, and stable-employment percentage? A property-management company in the area should have these aggregated.
- How much new for-sale + rental construction is in the pipeline within 1–3 miles? Heavy new supply typically softens prices + rents 12–24 months out; constrained supply supports both.
Investment metrics
- 1% rule
- 5.55% ✓
- Cap rate
- 50.65%
- Cash-on-cash
- 158.43%
- DSCR
- 8.05
- GRM
- 1.5
CMA / ARV
- ARV (median comp)
- $168,106
- List price
- $30,000
- Delta
- -77.69%
- Verdict
- UNDERPRICED
- Comps
- 20 within 1.0 mi
Show comp detail 12 sales within ~0.75 mi
| Address | Dist | Beds/Ba | Sqft | Sold | Price | $/sf | Match |
|---|---|---|---|---|---|---|---|
| 5506 Concord Dr | 0.00mi | 3/2.0 | 1,540 (0%) | 1mo | $30,000 | $19 | 99 |
| 404 Colonial Cir | 0.17mi | 3/2.0 | 1,689 (+10%) | 1mo | $185,000 | $110 | 75 |
| 316 Colonial Cir | 0.13mi | 3/1.0 | 1,407 (-9%) | 4mo | $165,000 | $117 | 72 |
| 223 S Park Dr | 0.19mi | 4/2.0 (+1) | 1,665 (+8%) | 2mo | $160,000 | $96 | 71 |
| 213 S Park Dr | 0.29mi | 3/2.0 | 1,674 (+9%) | 4mo | $159,900 | $96 | 68 |
| 5828 Clubview Dr | 0.64mi | 3/2.0 | 1,544 (+0%) | 3mo | $219,000 | $142 | 68 |
| 1237 Springdale Dr | 0.37mi | 3/2.0 | 1,408 (-9%) | 2mo | $103,500 | $74 | 66 |
| 1250 Summer Ln | 0.43mi | 4/2.0 (+1) | 1,615 (+5%) | 4mo | $101,000 | $63 | 64 |
| 5307 Pine Lane Dr | 0.72mi | 3/2.0 | 1,500 (-3%) | 1mo | $169,000 | $113 | 61 |
| 5247 Suffolk Cir | 0.53mi | 3/2.0 | 1,691 (+10%) | 0mo | $262,500 | $155 | 59 |
| 1218 Plantation Blvd | 0.70mi | 3/2.0 | 1,650 (+7%) | 1mo | $145,000 | $88 | 55 |
| 1810 Lake Trace Dr | 0.73mi | 3/2.0 | 1,702 (+10%) | 2mo | $240,000 | $141 | 47 |
Match score weights: distance 35% · size 25% · config 20% · recency 20%. Top-matched comps best support the ARV.
Projected returns pro-forma
-3.0% appreciation · 7.9% rent growth · sell at horizon
- IRR
- —
- Equity multiple
- 9.86×
- Total profit
- $74,416
- Equity at exit
- $4,473
- IRR
- —
- Equity multiple
- 24.22×
- Total profit
- $195,007
- Equity at exit
- $2,594
Cash invested: $8,400 (down + closing). Projections, not guarantees.
Landlord ↔ Tenant lean methodology
- Overall (STATE)
- 90 Strongly Landlord-Friendly
- State Mississippi
- 90 Strongly Landlord-Friendly · R+11
- County
- — inherits STATE
- City
- — inherits STATE
ZIP-level market 39211
- Rents YoY
- 7.9%
- Active inventory
- 221
- Price-to-rent
- 1.5×
Monthly cashflow live
- Estimated rent
- $1,666 high interval (Pro) →
- Mortgage (P&I)
- −$157
- Tax est. 1.5%
- −$38 /mo · $450/yr
- Insurance
- −$12
- HOA
- −$0
- Vacancy / Maint / Mgmt
- −$350
- Net cashflow
- $1,109
Break-even live
UW: 25.0% down · 7.5% · 30yr · 1.5% tax · 5.0% vac · 8.0% maint · 8.0% mgmt
Financing live
Cash to close
- Down payment
- $7,500
- Closing costs
- $900
- Reserves months
- —
- Total cash needed
- —
Loan-product check · same deal, 3 products live
Conventional
25% down · 7.5% · 30yr
- Down + closing
- —
- Monthly P&I
- —
- Monthly cashflow
- —
- DSCR
- —
- Eligible?
- —
Personal DTI + credit; lowest rate.
DSCR
20% down · 8.5% · 30yr
- Down + closing
- —
- Monthly P&I
- —
- Monthly cashflow
- —
- DSCR
- —
- Eligible?
- —
No personal income docs; deal must DSCR.
Hard money
10% down · 12.0% · 12mo
- Down + closing
- —
- Monthly P&I
- —
- Monthly cashflow
- —
- DSCR
- —
- Eligible?
- —
Short-term bridge; refi at stabilization.
Rent comps 15 comps
| Address | Beds | Baths | Sqft | Rent | $/sqft | DOM | Units | Dist |
|---|---|---|---|---|---|---|---|---|
| 120 Parkway Dr Jackson, MS | 1.0–3.0 | 1.0–2.0 | 1076 | $2,255 | $2.10 | 13d | 15 | 0.46mi |
| 5538 Pine Lane Dr Jackson, MS | 3.0 | 2.0 | 1627 | $1,465 | $0.90 | 43d | 1 | 0.69mi |
| 5544 Wayneland Dr Jackson, MS | 3.0 | 2.0 | 1800 | $1,831 | $1.02 | 43d | 1 | 0.75mi |
| 119 S Canton Club Cir Jackson, MS | 3.0 | 2.0 | 1444 | $1,595 | $1.10 | 23d | 1 | 0.76mi |
| 5301 Ridgewood Rd Jackson, MS | 3.0 | 2.0 | 1482 | $1,850 | $1.25 | 43d | 1 | 0.82mi |
| 5855 Canton Park Dr Jackson, MS | 4.0 | 2.0 | 1955 | $1,675 | $0.86 | 23d | 1 | 0.82mi |
| 2009 Lake Trace Dr Jackson, MS | 4.0 | 2.0 | 2028 | $1,950 | $0.96 | 13d | 1 | 0.98mi |
| 212 Pimlico Pl Jackson, MS | 3.0 | 2.0 | 1600 | $900 | $0.56 | 13d | 1 | 1.00mi |
| 5125 Old Canton Rd Jackson, MS | 3.0 | 3.0 | 2025 | $2,100 | $1.04 | 23d | 1 | 1.00mi |
| 5000 Ridgewood Rd Jackson, MS | 2.0 | 2.0 | 1093 | $1,279 | $1.17 | 44d | 1 | 1.06mi |
| 3001 Jamestown Way Jackson, MS | 2.0 | 1.5 | 1200 | $1,100 | $0.92 | 23d | 1 | 1.09mi |
| 1702 Jamestown Way Unit 1702 Jackson, MS | 3.0 | 2.0 | 1465 | $1,495 | $1.02 | 43d | 1 | 1.11mi |
| 492 E Beasley Rd Jackson, MS | 1.0–3.0 | 1.0–2.0 | 1133 | $1,440 | $1.27 | 13d | 8 | 1.23mi |
| 214 Foxboro Dr Jackson, MS | 3.0 | 2.0 | 1224 | $1,395 | $1.14 | 13d | 1 | 1.46mi |
| 51 Northtown Dr Unit 001G Jackson, MS | 3.0 | 2.0 | 1260 | $1,449 | $1.15 | 13d | 1 | 1.47mi |
Listing history 17 events
-
2026-05-15status Pending 939-char remark
-
2026-05-12$30,000 Active 939-char remark
-
2026-05-05historical
-
2026-04-29price $37,500
-
2026-04-16$45,000 Active
-
2024-10-09soldstatus
-
2024-09-13soldstatus Closed
Show marketing remark (136 chars)
Home is being sold AS IS due to complete fire damage. **The house cannot be entered for viewing until after Tuesday, September 3rd.**
-
2024-09-12soldstatus
-
2024-09-04status Pending
Show marketing remark (136 chars)
Home is being sold AS IS due to complete fire damage. **The house cannot be entered for viewing until after Tuesday, September 3rd.**
-
2024-08-27$25,000 Active
Show marketing remark (136 chars)
Home is being sold AS IS due to complete fire damage. **The house cannot be entered for viewing until after Tuesday, September 3rd.**
-
2024-01-27historical $1,495
-
2024-01-04price $1,495
-
2023-12-15price $1,535
-
2023-12-14price $1,590
-
2023-11-15$1,630
-
2019-12-23soldstatus
-
1965-04-27soldstatus
ⓘ Source: listings_history table (triggers on properties + properties_extension) + one-shot
backfill from property_details.listing_events for pre-trigger history.
Climate risk First Street
- Flood 1/10 Low FEMA zone X (unshaded) · 0% chance over 30 yrs
- Wildfire 1/10 Low
- Heat 7/10 Severe 7 d/yr ≥108°F today · 20 d/yr by 30 yrs out
- Wind 8/10 Severe 80% chance of damaging wind over 30 yrs
- Air quality 2/10 Low 0 unhealthy d/yr today · 1 by 30 yrs out
Nearby sold comps map
Loading sold comps map…
Walkable amenities ~0.75 mi
Loading nearby amenities…
Taxation est. · year 1
- Rental income
- $19,995
- − Mortgage interest
- −$1,680
- − Property taxes
- −$450
- − Insurance
- −$150
- − Repairs & maintenance
- −$1,600
- − Management
- −$1,600
- − Depreciation
- −$873
- Taxable income
- $13,642
- Est. tax owed @ 24.0%
- −$3,274
- After-tax cash flow
- $10,034/yr
For passive investors: Depreciation is non-cash, so a rental often shows a tax loss while cash-flowing — sheltering income. Rental losses are passive: they offset passive income freely, and up to $25,000/yr can offset ordinary (W-2) income if you actively participate and your MAGI is under $100k (phasing out to $0 by $150k); unused losses carry forward. On sale, claimed depreciation is recaptured at up to 25%, and gains may owe capital-gains tax (a 1031 exchange can defer both). Figures are a year-1 estimate at your 24.0% rate — not tax advice; consult a CPA.
Schools (NCES district)
- District
- Jackson Public School District
- NCES district ID
- 2802190
- Math proficiency
- 9% ▼ -14.00%
- Reading proficiency
- 18% ▼ -7.00%
- Median HH income
- $33,234
- Composite
- 10.89/100
- National rank
- #9755
- State rank
- #112 of 130 in MS
Livability — Jackson
- Score
- 68/100
- State rank
- #66
- US rank
- #9695
Category grades
Schools grade is shown separately in the Schools card above.
Census & demographics
- Census place
- Jackson, MS
- County
- Hinds County · 167,040 people
- City population
- 140,204
- Metro
- Jackson, MS
- Population (ZIP)
- 23,838
- Household income
- $69,426
- Rent vs Own
- Severe rent burden
- 736.0
Population outlook (Hinds County) Hauer SSP2
- Today (2025)
- 242,528 people
- By 2030
- 241,113 · -0.6%
- By 2040
- 235,557 · -2.9%
- By 2050
- 226,946 · -6.4%
- By 2075
- 199,995 · -17.5%
- By 2100
- 164,165 · -32.3%
Race, ethnicity, and origin ACS 2023
- Neighborhood character
- Majority Black (59%)
- Race & ethnicity
- Black 59% White 36% Hispanic / Latino 3% Two or more races 2%
- Common ancestry
- Serbian 2% Italian 2% Slovak 1%
- Foreign-born
- 2% · Canada, China
- Languages at home
- 96% English-only · Spanish 3% Chinese 1%
Political lean MEDSL · Hinds
- 2024 margin
- Solid D (+46.1) · D 72.4% · R 26.3% · Other 1.4%
- 2008→2024 swing
- +7.1pp toward D · 2008: 39.0pp · 2024: 46.1pp
- All cycles
- 2024: D+46.1 2020: D+48.3 2016: D+43.7 2012: D+45.1 2008: D+39.0
Not yet ingested
- Civics
- —
Market trends
- HPI YoY
- ▼ -135.99%
- Current HPI
- 145.5192
- Rent YoY
- ▲ 7.90%
- Metro
- Jackson, MS
- State GDP YoY
- —
- F500 in state
- 0
Price history
+1740.5% since first listed18 events — show timeline
- 2026-05-26 Sold (MLS) — MLSU
- 2026-05-15 Pending — MLSU
- 2026-05-12 Listed $30,000 MLSU
- 2026-05-05 Listing Removed — MLSU
- 2026-04-29 Price Changed $37,500 MLSU
- 2026-04-16 Listed $45,000 MLSU
- 2024-10-09 Sold (Public Records) — Public Records
- 2024-09-13 Sold (MLS) — MLSU
- 2024-09-12 Sold (Public Records) — Public Records
- 2024-09-04 Pending — MLSU
- 2024-08-27 Listed $25,000 MLSU
- 2024-01-27 Rental Removed $1,495 RENTLY
- 2024-01-04 Price Changed $1,495 RENTLY
- 2023-12-15 Price Changed $1,535 RENTLY
- 2023-12-14 Price Changed $1,590 RENTLY
- 2023-11-15 Listed for Rent $1,630 RENTLY
- 2019-12-23 Sold (Public Records) — Public Records
- 1965-04-27 Sold (Public Records) — Public Records
Property tax history
+24.6%/yrLatest (2025): $2,693 · +1.9% YoY. Source: county tax records.
Cash-flow waterfall
monthlySold comps — $/sqft
last 12 mo · ≤1 miLoading sold comps…