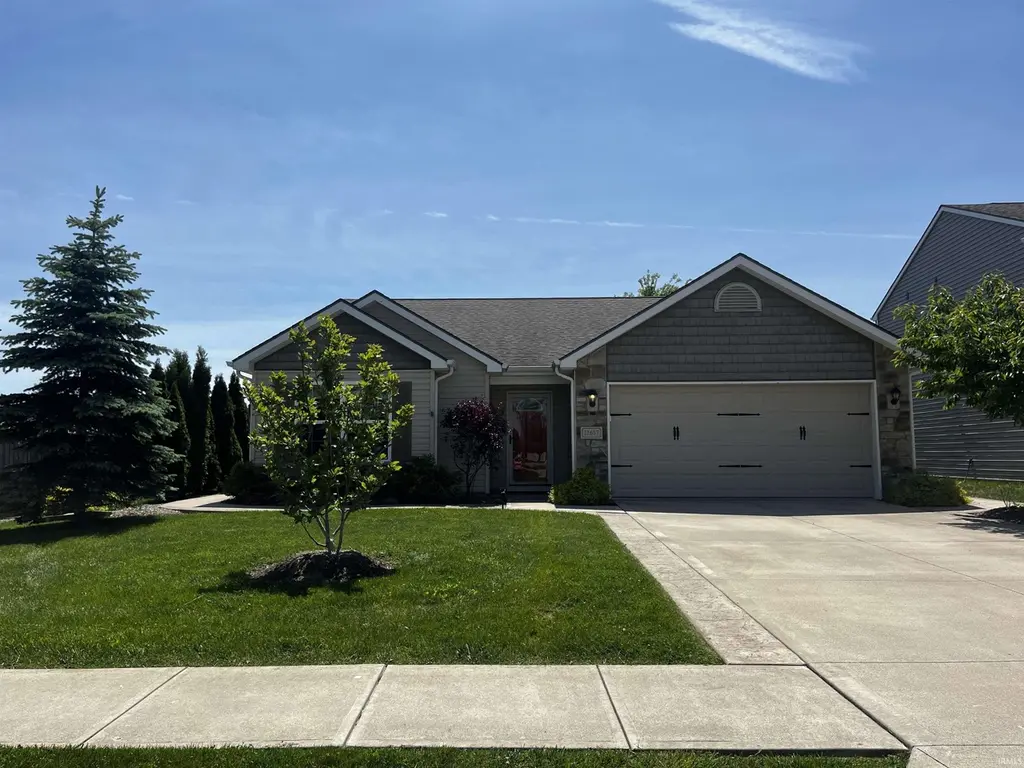
12687 Shearwater Run · Huntertown, IN
Flood risk 1/10 · Minimal
- FEMA flood zone
- X (unshaded)
- Chance of flooding over 30 yrs
- 0.0%
- Est. flood insurance / yr
- $507 – $1,088
Fire risk 1/10 · Minimal
- Est. fire insurance / yr
- $717 – $1,331
Heat risk 3/10 · Minor
- Hot days now (above 101°F)
- 7 days/yr
- Hot days in 30 yrs
- 17 days/yr
Wind risk 2/10 · Minimal
- Chance of severe wind over 30 yrs
- —
Air-quality risk 2/10 · Minimal
- Unhealthy air days now
- 2 days/yr
- Unhealthy air days in 30 yrs
- 2 days/yr
Risk factors via First Street. Map © Google.
Why this score? — see what drove the D grade
The composite is a weighted blend of 9 inputs, each scored 0–100. Each bar is that input's sub-score; the figure is the points it added to the 100-point composite (weight × sub-score).
- ARV discount +11.4/15.0
- Cash flow +10.4/30.0
- Rent growth +5.0/5.0
- Schools +4.9/10.0
- Livability +3.5/5.0
- DSCR +3.0/10.0
- Condition / age +2.5/5.0
- 1% rule +2.1/10.0
- Appreciation +0.0/10.0
$289,000
🖨 Deal sheet 📄 Offer letter ✓ Due diligence
Listing remarks MLS
Better than new split bedroom ranch with 1,526 sq. ft. of living space and an additional 195 sq. ft. of enclosed Eze Breeze porch. This well-maintained home is loaded with upgrades starting with the laminate flooring throughout the main living area of the home. The Great Room is open to the Kitchen which features an island with seating, stainless steel appliances that all remain with the home, subway tile backsplash. A warm and inviting family room just off the eating area overlooks the nature reserve behind the home for plenty of privacy. Enjoy the outdoors in the enclosed porch that opens to screened windows in the summer. Also outside is the oversized 15x13 patio in the vinyl fenced back yard and walkway to the front of the home. Master Bedroom features a large walk-in closet featuring closet organizers and a master bath. The other two bedrooms also have closet organizers. Separate laundry area with more organizers for plenty of storage and also in the garage. This is truly a WOW home! Just move in and enjoy the yard coming to life in the spring!
Key facts
- Three-season room
- Sun room
- Large patio
Tags
Property features AI
Finance
- HOA & community: Homeowners association with an annual fee of $202 (about $16.83/month)
Exterior
- Parking: Attached garage with 2 spaces; Garage door opener; Concrete driveway
- Security: Smoke detector(s)
- Utilities: Public water; Public sewer
- Home design: Single-family, site-built home; One-story
- Construction: Stone and vinyl siding exterior; Slab foundation; Built as site-built construction
- Exterior features: Patio; Privacy vinyl fencing; Landscaped, level lot
Interior
- Kitchen: Dishwasher; Microwave; Refrigerator; Electric range; Kitchen island
- Bedrooms: Bedrooms located on main level
- Flooring: Carpet; Vinyl
- Bathrooms: Two full bathrooms, both on the main level
- Heating & cooling: Forced air heating; Central air; Ceiling fans
- Interior features: Walk-in closet(s); Entrance foyer; Ceiling fan(s); Kitchen island; Open floorplan; Window treatments; Living room fireplace
- Laundry & utility: Washer and dryer included; Main-level laundry; Owned water softener
Neighborhood map
What this means for you Summary
Snapshot
- This is a 3-bed/2.0-bath single-family listed at $289k.
Deal economics
- At list price, monthly cash flow is $-154 ($-2k/yr) — negative.
- To cash-flow at today's rent, offer at most $262k (9.4% below list).
- To meet the 1% rule (rent ≥ 1% of price), the offer needs to be $206k (28.6% below list).
- Recommended offer: $206k (28.6% below list) — sets the bar for 1% rule.
- Cap rate 5.7% vs local median 4.1% in Huntertown — top-decile yield for the area; either an underpriced asset or a hidden risk that comps aren't pricing in. Stress-test before assuming the spread holds.
Location & tenants
- Location reads 70/100 on livability (#159 in IN) — a middle-class / working-renter tenant base. Strengths: employment A+, cost of living A+, housing A+; Watch: amenities F, commute F, health & safety F.
- Northwest Allen County Schools (rural): math 51% / reading 58% proficiency, ranked #25 of 301 in IN (top 8%) — acceptable for families but not a draw, mixed tenant base, ~2y average lease; only 11% free/reduced lunch — higher-income household profile.
- Zoned schools: Eel River Elementary School (math 56% / reading 41%, grade D, #304 of 994 statewide, top 31%, 412 students, 29% FRL); Carroll Middle School (math 39% / reading 55%, grade D+, #65 of 330 statewide, top 21%, 994 students, 29% FRL); Carroll High School (math 59% / reading 86%, grade B+, #10 of 369 statewide, top 3%, 2,554 students, 21% FRL) — zoned schools average 26% FRL vs 11% district-wide (15 pts higher); higher-poverty schools than district average — tighter screening recommended.
- Market conditions: Rents rising fast (+10.5%/yr); 220 active listings in the ZIP; 2 comparable units currently listed for rent nearby; high-income renter base; 1,861 units permitted in Allen County in 2024 (576 in 5+ unit buildings).
Forward outlook
- Local home prices are declining (-3.0%/yr); year-one equity from $2k of loan paydown is wiped out by about $9k of value loss. Plan a longer hold.
- Allen County population projected at +10% by 2050 — modest demand growth; plan on rents tracking national, not racing it.
Negotiation context
- Only 3 days on market — expect competitive offers; lowballing is unlikely to land.
- 5 sale attempts since 12y ago with the ask held roughly flat each time — persistent listings suggest the price (not the market) is what's stuck; bring a comps-based counter.
- Current owner paid $238k; 21% above their basis — modest negotiation headroom, anchor on the comps not their cost.
Questions for the listing agent
- What do current leases actually rent for vs. the listed asking? Can we see a recent rent roll and the last 12 months of T-12 income?
- What does the HOA fee cover, when was the last increase, and are there any pending special assessments or reserve-fund shortfalls?
- Is there a deadline driving the sale (1031 exchange, divorce, estate, relocation)? That informs how much negotiation room exists.
- The area grade is low — what's the realistic commute time and amenity access for the typical tenant pool here? Any planned neighborhood developments (good or bad) we should know about?
- What's the average days-on-market for RENTAL listings here right now (not sales)? A rising rental-DOM trend means longer vacancies and softer asking-rent achievability than the comps imply.
- What's the recent tenant-quality profile in this submarket — average credit score on applications, eviction rate, late-payment / NSF rate, and stable-employment percentage? A property-management company in the area should have these aggregated.
- How much new for-sale + rental construction is in the pipeline within 1–3 miles? Heavy new supply typically softens prices + rents 12–24 months out; constrained supply supports both.
Investment metrics
- 1% rule
- 0.71% ✗
- Cap rate
- 5.65%
- Cash-on-cash
- -2.28%
- DSCR
- 0.90
- GRM
- 11.7
CMA / ARV
- ARV (on-the-fly)
- $316,710
- Comps found
- 12
Show comp detail 12 sales within ~0.75 mi
| Address | Dist | Beds/Ba | Sqft | Sold | Price | $/sf | Match |
|---|---|---|---|---|---|---|---|
| 13221 Delano Cv | 0.35mi | 3/2.0 | 1,460 (-5%) | 2mo | $301,500 | $207 | 74 |
| 1774 Breckenridge Pass | 0.51mi | 3/2.0 | 1,533 (+0%) | 9mo | $325,000 | $212 | 68 |
| 13227 Delano Cv | 0.36mi | 3/2.0 | 1,405 (-8%) | 2mo | $285,000 | $203 | 68 |
| 1603 Bear Claw Ln | 0.54mi | 3/2.5 | 1,546 (+1%) | 4mo | $247,000 | $160 | 68 |
| 12331 Jacobas Pl | 0.23mi | 3/2.0 | 1,340 (-12%) | 7mo | $239,900 | $179 | 63 |
| 13635 Copper Strike Pass | 0.68mi | 3/2.0 | 1,449 (-5%) | 4mo | $308,500 | $213 | 56 |
| 12477 Gondola Pkwy | 0.61mi | 3/2.0 | 1,670 (+9%) | 1mo | $370,000 | $222 | 56 |
| 1231 Bluff Pointe Way | 0.75mi | 3/2.0 | 1,569 (+2%) | 7mo | $285,600 | $182 | 56 |
| 1622 Tara Bella Ln | 0.39mi | 3/2.0 | 1,744 (+14%) | 4mo | $320,000 | $183 | 55 |
| 14146 Hughies Cv | 0.74mi | 3/2.0 | 1,674 (+9%) | 1mo | $412,400 | $246 | 49 |
| 13715 Copper Strike Pass | 0.74mi | 3/2.0 | 1,449 (-5%) | 9mo | $303,000 | $209 | 49 |
| 1326 Bluff Pointe Way | 0.67mi | 3/2.5 | 1,700 (+11%) | 6mo | $299,900 | $176 | 43 |
Match score weights: distance 35% · size 25% · config 20% · recency 20%. Top-matched comps best support the ARV.
Projected returns pro-forma
-3.0% appreciation · 8.0% rent growth · sell at horizon
- IRR
- -15.3%
- Equity multiple
- 0.43×
- Total profit
- $-45,815
- Equity at exit
- $43,091
- IRR
- -0.5%
- Equity multiple
- 0.96×
- Total profit
- $-3,253
- Equity at exit
- $24,987
Cash invested: $80,920 (down + closing). Projections, not guarantees.
Landlord ↔ Tenant lean methodology
- Overall (STATE)
- 90 Strongly Landlord-Friendly
- State Indiana
- 90 Strongly Landlord-Friendly · R+11
- County
- — inherits STATE
- City
- — inherits STATE
ZIP-level market 46845
- Home prices YoY
- -34.6%
- Rents YoY
- 10.5%
- Active inventory
- 220
- Price-to-rent
- 11.7×
Monthly cashflow live
- Estimated rent
- $2,065 medium interval (Pro) →
- Mortgage (P&I)
- −$1,516
- Tax from tax record
- −$132 /mo · $1,582/yr
- Insurance
- −$120
- HOA
- −$17
- Vacancy / Maint / Mgmt
- −$434
- Net cashflow
- $-154
Break-even live
UW: 25.0% down · 7.5% · 30yr · 1.5% tax · 5.0% vac · 8.0% maint · 8.0% mgmt
Financing live
Cash to close
- Down payment
- $72,250
- Closing costs
- $8,670
- Reserves months
- —
- Total cash needed
- —
Loan-product check · same deal, 3 products live
Conventional
25% down · 7.5% · 30yr
- Down + closing
- —
- Monthly P&I
- —
- Monthly cashflow
- —
- DSCR
- —
- Eligible?
- —
Personal DTI + credit; lowest rate.
DSCR
20% down · 8.5% · 30yr
- Down + closing
- —
- Monthly P&I
- —
- Monthly cashflow
- —
- DSCR
- —
- Eligible?
- —
No personal income docs; deal must DSCR.
Hard money
10% down · 12.0% · 12mo
- Down + closing
- —
- Monthly P&I
- —
- Monthly cashflow
- —
- DSCR
- —
- Eligible?
- —
Short-term bridge; refi at stabilization.
Rent comps 2 comps
| Address | Beds | Baths | Sqft | Rent | $/sqft | DOM | Units | Dist |
|---|---|---|---|---|---|---|---|---|
| 1527 Flint Lock Ln Fort Wayne, IN | 3.0 | 2.5 | 1570 | $1,950 | $1.24 | 43d | 1 | 0.40mi |
| 14784 Gul St Fort Wayne, IN | 3.0 | 2.5 | 1459 | $1,895 | $1.30 | 13d | 4 | 1.32mi |
HOA detail
- Monthly dues
- $17 · $204/yr
Listing history 8 events
-
2026-05-22$289,000 Active
-
2021-03-11soldstatus $238,000 1065-char remark
Show marketing remark (1065 chars)
Better than new split bedroom ranch with 1,526 sq. ft. of living space and an additional 195 sq. ft. of enclosed Eze Breeze porch. This well-maintained home is loaded with upgrades starting with the laminate flooring throughout the main living area of the home. The Great Room is open to the Kitchen which features an island with seating, stainless steel appliances that all remain with the home, subway tile backsplash. A warm and inviting family room just off the eating area overlooks the nature reserve behind the home for plenty of privacy. Enjoy the outdoors in the enclosed porch that opens to screened windows in the summer. Also outside is the oversized 15x13 patio in the vinyl fenced back yard and walkway to the front of the home. Master Bedroom features a large walk-in closet featuring closet organizers and a master bath. The other two bedrooms also have closet organizers. Separate laundry area with more organizers for plenty of storage and also in the garage. This is truly a WOW home! Just move in and enjoy the yard coming to life in the spring!
-
2021-02-06$234,900 1065-char remark
Show marketing remark (1065 chars)
Better than new split bedroom ranch with 1,526 sq. ft. of living space and an additional 195 sq. ft. of enclosed Eze Breeze porch. This well-maintained home is loaded with upgrades starting with the laminate flooring throughout the main living area of the home. The Great Room is open to the Kitchen which features an island with seating, stainless steel appliances that all remain with the home, subway tile backsplash. A warm and inviting family room just off the eating area overlooks the nature reserve behind the home for plenty of privacy. Enjoy the outdoors in the enclosed porch that opens to screened windows in the summer. Also outside is the oversized 15x13 patio in the vinyl fenced back yard and walkway to the front of the home. Master Bedroom features a large walk-in closet featuring closet organizers and a master bath. The other two bedrooms also have closet organizers. Separate laundry area with more organizers for plenty of storage and also in the garage. This is truly a WOW home! Just move in and enjoy the yard coming to life in the spring!
-
2019-05-10soldstatus $227,000
-
2018-05-23$235,000
-
2017-10-06$249,900
-
2014-11-21soldstatus $147,300
-
2014-07-09$149,900
ⓘ Source: listings_history table (triggers on properties + properties_extension) + one-shot
backfill from property_details.listing_events for pre-trigger history.
Tax reassessment forecast IN · Partial reset (capped growth)
- Current annual tax
- $1,582 · $132/mo
- Projected year-2 tax
- $2,019 · $168/mo
- Expected delta
- +$437/yr (+$36/mo · 27.6%)
ⓘ Screening estimate from a state-policy table — verify with the county assessor before closing.
Climate risk First Street
- Flood 1/10 Low FEMA zone X (unshaded) · 0% chance over 30 yrs
- Wildfire 1/10 Low
- Heat 3/10 Moderate 7 d/yr ≥101°F today · 17 d/yr by 30 yrs out
- Wind 2/10 Low
- Air quality 2/10 Low 2 unhealthy d/yr today · 2 by 30 yrs out
Nearby sold comps map
Loading sold comps map…
Walkable amenities ~0.75 mi
Loading nearby amenities…
Taxation est. · year 1
- Rental income
- $24,775
- − Mortgage interest
- −$16,188
- − Property taxes
- −$1,582
- − Insurance
- −$1,445
- − Repairs & maintenance
- −$1,982
- − Management
- −$1,982
- − HOA
- −$204
- − Depreciation
- −$8,407
- Taxable loss
- −$7,016
- Est. tax savings @ 24.0%
- +$1,684
- After-tax cash flow
- $-162/yr
For passive investors: Depreciation is non-cash, so a rental often shows a tax loss while cash-flowing — sheltering income. Rental losses are passive: they offset passive income freely, and up to $25,000/yr can offset ordinary (W-2) income if you actively participate and your MAGI is under $100k (phasing out to $0 by $150k); unused losses carry forward. On sale, claimed depreciation is recaptured at up to 25%, and gains may owe capital-gains tax (a 1031 exchange can defer both). Figures are a year-1 estimate at your 24.0% rate — not tax advice; consult a CPA.
Schools (NCES district)
- District
- Northwest Allen County Schools
- NCES district ID
- 1808250
- Math proficiency
- 51% ▼ -6.00%
- Reading proficiency
- 58% ▼ -5.00%
- Median HH income
- $78,952
- Composite
- 49.26/100
- National rank
- #2027
- State rank
- #25 of 301 in IN
Livability — Huntertown
- Score
- 70/100
- State rank
- #159
- US rank
- #7771
Category grades
Schools grade is shown separately in the Schools card above.
Census & demographics
- Census place
- Huntertown, IN
- County
- Allen County · 326,813 people
- Metro
- Fort Wayne, IN
- Population (ZIP)
- 29,583
- Household income
- $112,676
- Rent vs Own
- Severe rent burden
- 467.0
Population outlook (Allen County) Hauer SSP2
- Today (2025)
- 394,020 people
- By 2030
- 405,128 · +2.8%
- By 2040
- 423,476 · +7.5%
- By 2050
- 435,137 · +10.4%
- By 2075
- 450,293 · +14.3%
- By 2100
- 424,101 · +7.6%
Race, ethnicity, and origin ACS 2023
- Neighborhood character
- Predominantly White (86%)
- Race & ethnicity
- White 86% Asian 4% Two or more races 4% Hispanic / Latino 3% Black 3%
- Common ancestry
- Italian 4% Romanian 3% Lithuanian 3%
- Foreign-born
- 5% · Vietnam, Canada, China
- Languages at home
- 93% English-only · Spanish 2% Chinese 1% Vietnamese 1%
Political lean MEDSL · Allen
- 2024 margin
- R (+12.5) · D 42.9% · R 55.4% · Other 1.7%
- 2008→2024 swing
- -8.1pp toward R · 2008: -4.3pp · 2024: -12.5pp
- All cycles
- 2024: R+12.5 2020: R+11.2 2016: R+19.6 2012: R+16.8 2008: R+4.3
Not yet ingested
- Civics
- —
Market trends
- HPI YoY
- ▼ -112.27%
- Current HPI
- 212.3516
- Rent YoY
- ▲ 10.47%
- Metro
- Fort Wayne, IN
- State GDP YoY
- ▲ 2.90%
- F500 in state
- 18
Industry mix (Fortune 500 HQ in IN)
| Industry | F500 HQs | Revenue |
|---|---|---|
| Industrial Machinery | 2 | $37B |
|
||
| Healthcare | 1 | $177B |
|
||
| Pharmaceuticals | 1 | $45B |
|
||
| Metals / Steel | 1 | $18B |
|
||
| Agriculture | 1 | $17B |
|
||
| Packaging | 1 | $12B |
|
||
Price history
+92.8% since first listed8 events — show timeline
- 2026-05-22 Listed $289,000 IRMLS
- 2021-03-11 Sold (MLS) $238,000 IRMLS
- 2021-02-06 Listed $234,900 IRMLS
- 2019-05-10 Sold (MLS) $227,000 IRMLS
- 2018-05-23 Listed $235,000 IRMLS
- 2017-10-06 Listed $249,900 IRMLS
- 2014-11-21 Sold (MLS) $147,300 IRMLS
- 2014-07-09 Listed $149,900 IRMLS
Property tax history
+57.1%/yrLatest (2024): $1,582 · +4.9% YoY. Source: county tax records.
Cash-flow waterfall
monthlySold comps — $/sqft
last 12 mo · ≤1 miLoading sold comps…