7302 Santa Barbara St #323 · Carlsbad, CA
Flood risk 1/10 · Minimal
- FEMA flood zone
- X (unshaded)
- Chance of flooding over 30 yrs
- 0.0%
- Est. flood insurance / yr
- $507 – $1,088
Fire risk 1/10 · Minimal
- Est. fire insurance / yr
- $659 – $1,223
Heat risk 5/10 · Moderate
- Hot days now (above 82°F)
- 7 days/yr
- Hot days in 30 yrs
- 18 days/yr
Wind risk 1/10 · Minimal
- Chance of severe wind over 30 yrs
- —
Air-quality risk 3/10 · Minor
- Unhealthy air days now
- 4 days/yr
- Unhealthy air days in 30 yrs
- 4 days/yr
Risk factors via First Street. Map © Google.
Why this score? — see what drove the C+ grade
The composite is a weighted blend of 9 inputs, each scored 0–100. Each bar is that input's sub-score; the figure is the points it added to the 100-point composite (weight × sub-score).
- Cash flow +25.7/30.0
- DSCR +8.6/10.0
- 1% rule +6.8/10.0
- Schools +6.5/10.0
- Appreciation +5.9/10.0
- Livability +3.9/5.0
- Condition / age +3.8/5.0
- Rent growth +3.4/5.0
- ARV discount +0.0/15.0
$489,900
🖨 Deal sheet (PDF) 📄 Offer letter ✓ Due diligence
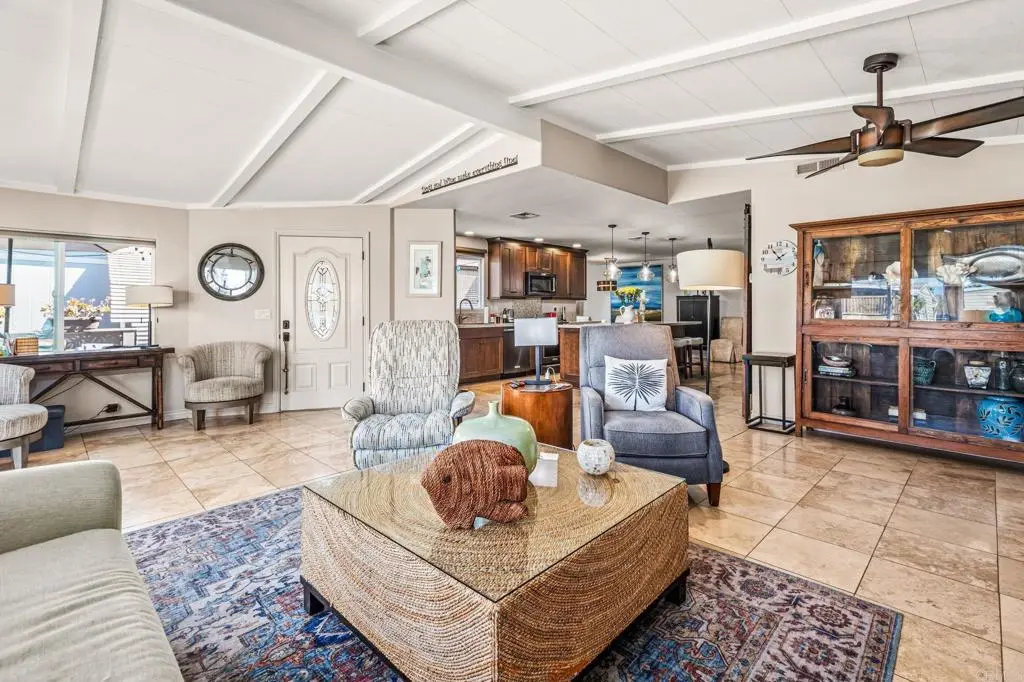
Listing remarks MLS
Triple wide large home recently updated. Located on one of the 10 ponds with large outdoor decks for relaxing or parties. Vaulted ceilings in the big Living Room with French Doors out to the deck. Fenced for Rosie - a Double Doodle. Even has a separate pantry just inside from the carport and a "mancave". Primary Bedroom and Bath are over 30 feet wide with larger walk-in shower.
Key facts
- Separate pantry
- French doors
- Large outdoor decks
Tags
Neighborhood map
What this means for you Summary
Snapshot
- This is a 2-bed/1.5-bath manufactured listed at $490k. Condition is rated good.
Deal economics
- At list price, monthly cash flow is $1k ($14k/yr) — positive.
- The deal already cash-flows at list — no discount required.
- Meets the 1% rule at list price ($6k rent vs $490k).
- Recommended offer: $461k (6.0% below list) — sets the bar for market timing.
- Cap rate 9.2% vs local median 2.1% in Carlsbad — top-decile yield for the area; either an underpriced asset or a hidden risk that comps aren't pricing in. Stress-test before assuming the spread holds.
Location & tenants
- Location reads 78/100 on livability (#67 in CA, #2,526 nationally) — a middle-class / working-renter tenant base. Strengths: schools A+, amenities A+, commute A+; Watch: health & safety D+, cost of living F.
- Carlsbad Unified (urban): math 68% / reading 76% proficiency, ranked #87 of 1,400 in CA (top 6%) — strong family-tenant draw, lease renewals of 3-5y typical; only 18% free/reduced lunch — higher-income household profile.
- Market conditions: Rents rising (+3.5%/yr); 96 active listings in the ZIP; 14 comparable units currently listed for rent nearby; rentals at typical pace (median 17d on market — plan ~3-4 weeks tenant-placement turnaround); high-income renter base; 11,759 units permitted in San Diego County in 2024 (7,244 in 5+ unit buildings).
- This rent runs 44% of the median local income ($159k/yr) — at the standard rent-burdened threshold; future hikes will face affordability resistance.
Forward outlook
- In year one you build about $12k of equity ($3k loan paydown + $9k appreciation (1.8% local appreciation)).
- San Diego County population projected at +20% by 2050 — long-run rental-demand tailwind backs the buy-and-hold thesis.
- At projected returns (1.8% appreciation + 3.5% rent growth), your $137k cash investment doubles in ~5 years — after that, you're playing with house money.
- By year 3, paydown + projected appreciation supports a ~$31k cash-out refi (75% LTV) — recoverable capital for the next deal without selling this one.
Negotiation context
- It's been on market 90 days — a 6% lower offer ($461k) is reasonable based on typical stale-listing flexibility.
Risks & watch-outs
- Climate carrying-cost: extreme-heat days projected 7→18/yr by 2055 (HVAC capex compounding) — expect insurance premiums to compound above CPI over the hold.
Questions for the listing agent
- It's been on market 90 days. Have you received any prior offers? Is the seller open to a 6% concession, seller financing, or rate buy-down credit?
- Built in 1976 — when were the roof, HVAC, electrical panel, plumbing, and water heater last replaced?
- Why hasn't it sold? Are there any deal-killer items the seller is aware of (foundation, flood, title, zoning, code violations)?
- Is there a deadline driving the sale (1031 exchange, divorce, estate, relocation)? That informs how much negotiation room exists.
- Schools are A-rated — typically a magnet for longer-tenancy family renters. What's the average tenant stay here, and is there a school-zone premium baked into asking?
- What's the average days-on-market for RENTAL listings here right now (not sales)? A rising rental-DOM trend means longer vacancies and softer asking-rent achievability than the comps imply.
- What's the recent tenant-quality profile in this submarket — average credit score on applications, eviction rate, late-payment / NSF rate, and stable-employment percentage? A property-management company in the area should have these aggregated.
- How much new for-sale + rental construction is in the pipeline within 1–3 miles? Heavy new supply typically softens prices + rents 12–24 months out; constrained supply supports both.
Investment metrics
- 1% rule
- 1.18% ✓
- Cap rate
- 9.17%
- Cash-on-cash
- 10.28%
- DSCR
- 1.46
- GRM
- 7.1
CMA / ARV
- ARV (median comp)
- $385,217
- List price
- $489,900
- Delta
- 27.18%
- Verdict
- OVERPRICED
- Comps
- 20 within 1.0 mi
Show comp detail 12 sales within ~0.75 mi
| Address | Dist | Beds/Ba | Sqft | Sold | Price | $/sf | Match |
|---|---|---|---|---|---|---|---|
| 7224 San Benito St | 0.10mi | 2/2.0 | 1,600 (-2%) | 9mo | $400,000 | $250 | 83 |
| 7304 Santa Barbara St #325 | 0.01mi | 2/2.0 | 1,512 (-7%) | 9mo | $481,000 | $318 | 78 |
| 7207 Santa Barbara St #154 | 0.23mi | 3/2.0 (+1) | 1,656 (+2%) | 3mo | $513,300 | $310 | 77 |
| 7313 San Luis St #236 | 0.09mi | 3/2.0 (+1) | 1,548 (-5%) | 5mo | $450,000 | $291 | 76 |
| 7024 San Bartolo Unit 19 A | 0.23mi | 3/2.0 (+1) | 1,544 (-5%) | 2mo | $425,000 | $275 | 71 |
| 7203 San Luis St #166 | 0.25mi | 2/2.5 | 1,536 (-6%) | 9mo | $375,000 | $244 | 67 |
| 7140 Santa Rosa St | 0.19mi | 2/2.0 | 1,440 (-12%) | 6mo | $191,000 | $133 | 64 |
| 7106 Santa Cruz #56 | 0.20mi | 2/2.0 | 1,464 (-10%) | 9mo | $390,000 | $266 | 64 |
| 7318 San Luis St | 0.15mi | 2/2.0 | 1,440 (-12%) | 9mo | $285,000 | $198 | 64 |
| 7217 San Luis St #173 | 0.21mi | 2/2.0 | 1,440 (-12%) | 10mo | $280,000 | $194 | 61 |
| 7018 San Carlos St #60 | 0.31mi | 2/2.0 | 1,440 (-12%) | 6mo | $392,000 | $272 | 59 |
| 7002 San Bartolo St #30 | 0.37mi | 3/2.0 (+1) | 1,781 (+9%) | 2mo | $341,500 | $192 | 59 |
Match score weights: distance 35% · size 25% · config 20% · recency 20%. Top-matched comps best support the ARV.
Projected returns pro-forma
1.75% appreciation · 3.54% rent growth · sell at horizon
- IRR
- 14.4%
- Equity multiple
- 1.77×
- Total profit
- $105,476
- Equity at exit
- $186,603
- IRR
- 17.5%
- Equity multiple
- 3.31×
- Total profit
- $316,820
- Equity at exit
- $263,711
Cash invested: $137,172 (down + closing). Projections, not guarantees.
Landlord ↔ Tenant lean methodology
- Overall (STATE)
- 18 Strongly Tenant-Friendly
- State California
- 18 Strongly Tenant-Friendly · D+13
- County
- — inherits STATE
- City
- — inherits STATE
ZIP-level market 92011
- Home prices YoY
- 0.4%
- Rents YoY
- 3.5%
- Active inventory
- 96
- Price-to-rent
- 7.1×
Monthly cashflow live
- Estimated rent
- $5,774 high interval (Pro) →
- Mortgage (P&I)
- −$2,569
- Tax est. 1.5%
- −$612 /mo · $7,348/yr
- Insurance
- −$204
- HOA
- −$0
- Vacancy / Maint / Mgmt
- −$1,212
- Net cashflow
- $1,176
Break-even live
Sensitivity live
| Price | -10% $1,514 | -5% $1,345 | +0% $1,176 | +5% $1,006 | +10% $837 |
|---|---|---|---|---|---|
| Rent | -10% $719 | -5% $948 | +0% $1,176 | +5% $1,404 | +10% $1,632 |
| Rate | -1.0pp $1,422 | -0.5pp $1,300 | base $1,176 | +0.5pp $1,049 | +1.0pp $920 |
UW: 25.0% down · 7.5% · 30yr · 1.5% tax · 5.0% vac · 8.0% maint · 8.0% mgmt
Financing live
Cash to close
- Down payment
- $122,475
- Closing costs
- $14,697
- Reserves months
- —
- Total cash needed
- —
Loan-product check · same deal, 3 products live
Conventional
25% down · 7.5% · 30yr
- Down + closing
- —
- Monthly P&I
- —
- Monthly cashflow
- —
- DSCR
- —
- Eligible?
- —
Personal DTI + credit; lowest rate.
DSCR
20% down · 8.5% · 30yr
- Down + closing
- —
- Monthly P&I
- —
- Monthly cashflow
- —
- DSCR
- —
- Eligible?
- —
No personal income docs; deal must DSCR.
Hard money
10% down · 12.0% · 12mo
- Down + closing
- —
- Monthly P&I
- —
- Monthly cashflow
- —
- DSCR
- —
- Eligible?
- —
Short-term bridge; refi at stabilization.
Rent comps 14 comps
| Address | Beds | Baths | Sqft | Rent | $/sqft | DOM | Units | Dist |
|---|---|---|---|---|---|---|---|---|
| 7064 Whitewater St Carlsbad, CA | 3.0 | 2.5 | 2050 | $8,500 | $4.15 | 44d | 1 | 0.39mi |
| 6923 Whitecap Dr Carlsbad, CA | 3.0 | 2.0 | 1246 | $5,250 | $4.21 | 44d | 1 | 0.56mi |
| 6910 Peachtree Rd Unit 1546353P Carlsbad, CA | 3.0 | 2.0 | 1399 | $6,129 | $4.38 | 17d | 1 | 0.69mi |
| 820 Windcrest Dr Carlsbad, CA | 3.0 | 2.0 | 1404 | $5,581 | $3.98 | 18d | 1 | 0.79mi |
| 6811 Alderwood Dr Carlsbad, CA | 2.0 | 2.0 | 1292 | $3,850 | $2.98 | 44d | 1 | 0.87mi |
| 6790 Embarcadero Ln Carlsbad, CA | 1.0–2.0 | 2.0–2.5 | 2104 | $5,750 | $2.73 | 5d | 1 | 0.94mi |
| 1967 N Vulcan Ave Encinitas, CA | 1.0–2.0 | 1.0–2.0 | 929 | $5,359 | $5.77 | 2d | 7 | 1.08mi |
| 916 Caminito Estrada Unit B Carlsbad, CA | 2.0 | 2.0 | 1188 | $3,650 | $3.07 | 44d | 1 | 1.11mi |
| 1859 N Vulcan Ave Encinitas, CA | 2.0 | 2.5 | 1950 | $7,000 | $3.59 | 2d | 1 | 1.24mi |
| 1812 Parliament Rd Encinitas, CA | 2.0 | 2.0 | 1467 | $11,200 | $7.63 | 2d | 1 | 1.27mi |
| 925 Wind Drift Dr Carlsbad, CA | 2.0 | 2.5 | 1110 | $3,895 | $3.51 | 44d | 1 | 1.29mi |
| 6555 Sea Gate Rd Carlsbad, CA | 2.0 | 2.0 | 1114 | $4,095 | $3.67 | 2d | 3 | 1.33mi |
| 141 Stonesteps Way Encinitas, CA | 2.0 | 2.5 | 1593 | $6,500 | $4.08 | 2d | 1 | 1.45mi |
| 1703 Kennington Rd Encinitas, CA | 3.0 | 2.0 | 1616 | $6,195 | $3.83 | 3d | 1 | 1.48mi |
Listing history 15 events
-
2026-06-18days on market $489,900 Active 90 DOM
-
2026-06-17days on market $489,900 Active 89 DOM
-
2026-06-16days on market $489,900 Active 88 DOM
-
2026-06-15days on market $489,900 Active 87 DOM
-
2026-06-13days on market $489,900 Active 85 DOM
-
2026-06-13days on market $489,900 Active 84 DOM
-
2026-06-09days on market $489,900 Active 81 DOM
-
2026-06-08days on market $489,900 Active 80 DOM
-
2026-06-07days on market $489,900 Active 79 DOM
-
2026-06-04days on market $489,900 Active 76 DOM
-
2026-06-03days on market $489,900 Active 75 DOM
-
2026-06-02days on market $489,900 Active 74 DOM
-
2026-06-01days on market $489,900 Active 73 DOM
-
2026-05-31days on market $489,900 Active 72 DOM
-
2026-03-20$489,900 Active 390-char remark
Show marketing remark (390 chars)
Triple wide large home recently updated. Located on one of the 10 ponds with large outdoor decks for relaxing or parties. Vaulted ceilings in the big Living Room with French Doors out to the deck. Fenced for Rosie - a Double Doodle. Even has a separate pantry just inside from the carport and a "mancave". Primary Bedroom and Bath are over 30 feet wide with larger walk-in shower.
ⓘ Source: listings_history table (triggers on properties + properties_extension) + one-shot
backfill from property_details.listing_events for pre-trigger history.
Climate risk First Street
- Flood 1/10 Low FEMA zone X (unshaded) · 0% chance over 30 yrs
- Wildfire 1/10 Low
- Heat 5/10 Major 7 d/yr ≥82°F today · 18 d/yr by 30 yrs out
- Wind 1/10 Low
- Air quality 3/10 Moderate 4 unhealthy d/yr today · 4 by 30 yrs out
Nearby sold comps map
Loading sold comps map…
Walkable amenities ~0.75 mi
Loading nearby amenities…
Taxation est. · year 1
- Rental income
- $69,284
- − Mortgage interest
- −$27,442
- − Property taxes
- −$7,348
- − Insurance
- −$2,450
- − Repairs & maintenance
- −$5,543
- − Management
- −$5,543
- − Depreciation
- −$14,252
- Taxable income
- $6,707
- Est. tax owed @ 24.0%
- −$1,610
- After-tax cash flow
- $12,498/yr
For passive investors: Depreciation is non-cash, so a rental often shows a tax loss while cash-flowing — sheltering income. Rental losses are passive: they offset passive income freely, and up to $25,000/yr can offset ordinary (W-2) income if you actively participate and your MAGI is under $100k (phasing out to $0 by $150k); unused losses carry forward. On sale, claimed depreciation is recaptured at up to 25%, and gains may owe capital-gains tax (a 1031 exchange can defer both). Figures are a year-1 estimate at your 24.0% rate — not tax advice; consult a CPA.
Condition & rehab AI · 1 photo
This recently updated manufactured home is in good condition with no major repairs needed. It offers a good balance of curb appeal and interior updates, making it a solid investment.
Value-add opportunities
- Both Painting the exterior and interior — Fresh paint enhances curb appeal and interior aesthetics.
- Both Landscaping improvements — A well-maintained yard and landscaping can increase both resale and rental value.
- Both HVAC system upgrade — A newer, more efficient HVAC system can improve comfort and energy efficiency, boosting both resale and rental value.
- Both Kitchen and bathroom updates — Modernizing these spaces can attract more buyers and renters, increasing both resale and rental value.
Renovation cost estimate screening
Value-add ROI direction
- Both Painting the exterior and interior — Fresh paint enhances curb appeal and interior aesthetics. ↑
- Both Landscaping improvements — A well-maintained yard and landscaping can increase both resale and rental value. ↑
- Both HVAC system upgrade — A newer, more efficient HVAC system can improve comfort and energy efficiency, boosting both resale and rental value. ↑
- Both Kitchen and bathroom updates — Modernizing these spaces can attract more buyers and renters, increasing both resale and rental value. ↑
ⓘ Cost ranges are severity-bucket heuristics (US national rule-of-thumb). Get contractor quotes + a written scope before underwriting a rehab budget.
Schools (NCES district)
- District
- Carlsbad Unified
- NCES district ID
- 0607500
- Math proficiency
- 68% ▲ 2.00%
- Reading proficiency
- 76% ▲ 2.00%
- Median HH income
- $81,200
- Composite
- 65.11/100
- National rank
- #1068
- State rank
- #87 of 1400 in CA
Livability — Carlsbad
- Score
- 78/100
- State rank
- #67
- US rank
- #2526
Category grades
Schools grade is shown separately in the Schools card above.
Census & demographics
- Census place
- Carlsbad, CA
- County
- San Diego County · 3,178,799 people
- City population
- 114,373
- Metro
- San Diego-Chula Vista-Carlsbad, CA
- Population (ZIP)
- 23,190
- Household income
- $159,235
- Rent vs Own
- Severe rent burden
- 714.0
Population outlook (San Diego County) Hauer SSP2
- Today (2025)
- 3,678,185 people
- By 2030
- 3,856,546 · +4.8%
- By 2040
- 4,171,407 · +13.4%
- By 2050
- 4,421,607 · +20.2%
- By 2075
- 4,831,599 · +31.4%
- By 2100
- 4,832,502 · +31.4%
Race, ethnicity, and origin ACS 2023
- Neighborhood character
- Majority White (64%)
- Race & ethnicity
- White 64% Hispanic / Latino 17% Two or more races 15% Asian 12%
- Hispanic origin (detail)
- Mexican 12%
- Common ancestry
- Portuguese 4% Slovak 3% Italian 3%
- Foreign-born
- 16% · Canada, China, Vietnam
- Languages at home
- 82% English-only · Spanish 6% Chinese 4% German/W. Germanic 2%
Political lean MEDSL · San Diego
- 2024 margin
- D (+16.8) · D 56.9% · R 40.1% · Other 2.9%
- 2008→2024 swing
- +6.6pp toward D · 2008: 10.2pp · 2024: 16.8pp
- All cycles
- 2024: D+16.8 2020: D+22.8 2016: D+17.8 2012: D+5.1 2008: D+10.2
Not yet ingested
- Civics
- —
Market trends
- HPI YoY
- ▲ 1.75%
- Current HPI
- 399.8502
- Rent YoY
- ▲ 3.54%
- Metro
- San Diego-Chula Vista-Carlsbad, CA
- State GDP YoY
- ▲ 3.21%
- F500 in state
- 116
Industry mix (Fortune 500 HQ in CA)
| Industry | F500 HQs | Revenue |
|---|---|---|
| Technology | 27 | $1,492B |
|
||
| Financial Services | 3 | $174B |
|
||
| Retail | 3 | $44B |
|
||
| Insurance | 3 | $26B |
|
||
| Media / Entertainment | 2 | $115B |
|
||
| Pharmaceuticals / Biotech | 2 | $62B |
|
||
Price history
1 event — show timeline
- 2026-03-20 Listed $489,900 CRMLS
Cash-flow waterfall
monthlySold comps — $/sqft
last 12 mo · ≤1 miLoading sold comps…