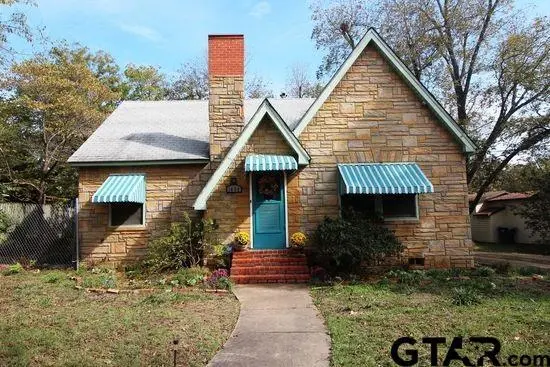
1430 S Glenwood Blvd · Tyler, TX
Flood risk 1/10 · Minimal
- FEMA flood zone
- X (unshaded)
- Chance of flooding over 30 yrs
- 0.0%
- Est. flood insurance / yr
- $507 – $1,088
Fire risk 1/10 · Minimal
- Est. fire insurance / yr
- $1,222 – $2,270
Heat risk 6/10 · Moderate
- Hot days now (above 109°F)
- 7 days/yr
- Hot days in 30 yrs
- 26 days/yr
Wind risk 6/10 · Moderate
- Chance of severe wind over 30 yrs
- 59.0%
Air-quality risk 2/10 · Minimal
- Unhealthy air days now
- 0 days/yr
- Unhealthy air days in 30 yrs
- 1 days/yr
Risk factors via First Street. Map © Google.
Why this score? — see what drove the C- grade
The composite is a weighted blend of 9 inputs, each scored 0–100. Each bar is that input's sub-score; the figure is the points it added to the 100-point composite (weight × sub-score).
- Cash flow +21.0/30.0
- ARV discount +7.5/15.0
- DSCR +6.7/10.0
- 1% rule +6.2/10.0
- Livability +3.8/5.0
- Rent growth +3.4/5.0
- Schools +3.3/10.0
- Condition / age +2.5/5.0
- Appreciation +0.0/10.0
$185,000
🖨 Deal sheet 📄 Offer letter ✓ Due diligence
Listing remarks
Experience the charm of this tastefully upgraded home, now showcasing a sleek, modern aesthetic. Each room offers generous proportions that contribute to a spacious, comfortable living experience. This property is certainly not one to miss. The primary home features a 3 bedroom, 2 bathroom setup, while the garage has been thoughtfully transformed into an alluring in-law studio with its own bedroom and bathroom. This versatile space can seamlessly function as your home office, or even be leveraged as an attractive rental apartment to generate additional income. Potential buyers and their agents are invited to verify the permissible uses of this uniquely adaptable property.
Key facts
- Double vanity
- Finished space
- White cabinets
Tags
Property features AI
Exterior
- Home design: Single-family detached residence; Single story; Located in CONNALLY HEIGHTS subdivision
- Construction: Brick and stone construction; Composition roof
- Exterior features: Patio; Chain link fencing
Interior
- Kitchen: Dishwasher; Microwave; Disposal
- Bathrooms: 2 full bathrooms
- Heating & cooling: Central heating (electric); Central air conditioning
- Interior features: In-law floorplan; Pantry
Neighborhood map
What this means for you Summary
Snapshot
- This is a 3-bed/2.0-bath single-family listed at $185k.
Deal economics
- At list price, monthly cash flow is $259 ($3k/yr) — positive.
- The deal already cash-flows at list — no discount required.
- Meets the 1% rule at list price ($2k rent vs $185k).
- Recommended offer: $182k (1.5% below list) — sets the bar for market timing.
- Cap rate 8.0% vs local median 3.6% in Tyler — top-decile yield for the area; either an underpriced asset or a hidden risk that comps aren't pricing in. Stress-test before assuming the spread holds.
Location & tenants
- Location reads 75/100 on livability (#147 in TX, #4,181 nationally) — a middle-class / working-renter tenant base. Strengths: cost of living A+, housing A+, health & safety A+; Watch: employment C-, crime D+, commute F.
- Tyler ISD (urban): math 39% / reading 38% proficiency, ranked #449 of 826 in TX (top 54%) — families likely to look elsewhere, expect single-tenant / working-renter base with shorter leases; 66% free/reduced lunch — lower-income household profile, screen leases tightly.
- Zoned schools: Peete El (math 22% / reading 17%, grade F, #3,583 of 4,322 statewide, top 86%, 414 students, 98% FRL); Three Lakes Middle (math 35% / reading 42%, grade F, #704 of 1,662 statewide, top 43%, 873 students, 64% FRL); Tyler Legacy H S (math 34% / reading 49%, grade F, #767 of 1,632 statewide, top 47%, 2,594 students, 58% FRL).
- Market conditions: Rents rising (+3.7%/yr); 327 active listings in the ZIP; 10 comparable units currently listed for rent nearby; rentals at typical pace (median 21d on market — plan ~3-4 weeks tenant-placement turnaround); 40% of comp listings sitting > 30 days — soft ceiling on asking rent; 595 units permitted in Smith County in 2024 (45 in 5+ unit buildings).
- This rent runs 38% of the median local income ($66k/yr) — at the standard rent-burdened threshold; future hikes will face affordability resistance.
Forward outlook
- Local home prices are declining (-3.0%/yr); year-one equity from $1k of loan paydown is wiped out by about $6k of value loss. Plan a longer hold.
- Smith County population projected at +24% by 2050 — long-run rental-demand tailwind backs the buy-and-hold thesis.
Negotiation context
- It's been on market 16 days — a 2% lower offer ($182k) is reasonable based on typical stale-listing flexibility.
- 18 sale attempts since 13y ago; this cycle's ask has dropped $14k (7%) from the opening price — seller is motivated, your offer sets the floor, not the list.
Risks & watch-outs
- Watch-outs: built in 1925 — expect roof / HVAC / electrical / plumbing capex.
- Climate carrying-cost: major wind risk, 59% chance of damaging wind over 30y; extreme-heat days projected 7→26/yr by 2055 (HVAC capex compounding) — expect insurance premiums to compound above CPI over the hold.
Questions for the listing agent
- Built in 1925 — when were the roof, HVAC, electrical panel, plumbing, and water heater last replaced?
- Is there a deadline driving the sale (1031 exchange, divorce, estate, relocation)? That informs how much negotiation room exists.
- Schools are D-rated, which usually means shorter tenancies and higher turnover. Who's the typical renter profile here, and what's been the actual vacancy rate?
- Crime grade is D in this area — have there been break-ins, vandalism, or insurance claims at this property in the last 3 years? What carrier currently insures it and at what premium?
- What's the average days-on-market for RENTAL listings here right now (not sales)? A rising rental-DOM trend means longer vacancies and softer asking-rent achievability than the comps imply.
- What's the recent tenant-quality profile in this submarket — average credit score on applications, eviction rate, late-payment / NSF rate, and stable-employment percentage? A property-management company in the area should have these aggregated.
- How much new for-sale + rental construction is in the pipeline within 1–3 miles? Heavy new supply typically softens prices + rents 12–24 months out; constrained supply supports both.
Investment metrics
- 1% rule
- 1.12% ✓
- Cap rate
- 7.97%
- Cash-on-cash
- 6.00%
- DSCR
- 1.27
- GRM
- 7.4
CMA / ARV
- ARV (on-the-fly)
- $429,600
- Comps found
- 3
Show comp detail 3 sales within ~0.75 mi
| Address | Dist | Beds/Ba | Sqft | Sold | Price | $/sf | Match |
|---|---|---|---|---|---|---|---|
| 325 W 4th St | 0.48mi | 3/2.0 | 2,058 (-14%) | 0mo | $149,900 | $73 | 54 |
| 210 Mockingbird Ln | 0.59mi | 3/3.0 | 2,688 (+12%) | 1mo | $479,900 | $179 | 48 |
| 842 S College Ave | 0.69mi | 4/2.5 (+1) | 2,508 (+4%) | 12mo | $485,000 | $193 | 43 |
Match score weights: distance 35% · size 25% · config 20% · recency 20%. Top-matched comps best support the ARV.
Projected returns pro-forma
-3.0% appreciation · 3.66% rent growth · sell at horizon
- IRR
- -6.2%
- Equity multiple
- 0.77×
- Total profit
- $-11,992
- Equity at exit
- $27,584
- IRR
- 4.3%
- Equity multiple
- 1.33×
- Total profit
- $16,972
- Equity at exit
- $15,995
Cash invested: $51,800 (down + closing). Projections, not guarantees.
Landlord ↔ Tenant lean methodology
- Overall (STATE)
- 87 Strongly Landlord-Friendly
- State Texas
- 87 Strongly Landlord-Friendly · R+5
- County
- — inherits STATE
- City
- — inherits STATE
ZIP-level market 75701
- Rents YoY
- 3.7%
- Active inventory
- 327
- Price-to-rent
- 7.4×
Monthly cashflow live
- Estimated rent
- $2,079 high interval (Pro) →
- Mortgage (P&I)
- −$970
- Tax from tax record
- −$336 /mo · $4,031/yr
- Insurance
- −$77
- HOA
- −$0
- Vacancy / Maint / Mgmt
- −$437
- Net cashflow
- $259
Break-even live
UW: 25.0% down · 7.5% · 30yr · 1.5% tax · 5.0% vac · 8.0% maint · 8.0% mgmt
Financing live
Cash to close
- Down payment
- $46,250
- Closing costs
- $5,550
- Reserves months
- —
- Total cash needed
- —
Loan-product check · same deal, 3 products live
Conventional
25% down · 7.5% · 30yr
- Down + closing
- —
- Monthly P&I
- —
- Monthly cashflow
- —
- DSCR
- —
- Eligible?
- —
Personal DTI + credit; lowest rate.
DSCR
20% down · 8.5% · 30yr
- Down + closing
- —
- Monthly P&I
- —
- Monthly cashflow
- —
- DSCR
- —
- Eligible?
- —
No personal income docs; deal must DSCR.
Hard money
10% down · 12.0% · 12mo
- Down + closing
- —
- Monthly P&I
- —
- Monthly cashflow
- —
- DSCR
- —
- Eligible?
- —
Short-term bridge; refi at stabilization.
Rent comps 10 comps
| Address | Beds | Baths | Sqft | Rent | $/sqft | DOM | Units | Dist |
|---|---|---|---|---|---|---|---|---|
| 711 W 6th St Tyler, TX | 3.0 | 2.0 | 1854 | $1,850 | $1.00 | 13d | 1 | 0.29mi |
| 2002 S Robertson Ave Tyler, TX | 3.0 | 2.5 | 1992 | $1,800 | $0.90 | 43d | 1 | 0.45mi |
| 1107 Dogwood St Tyler, TX | 3.0 | 1.5 | 1620 | $1,475 | $0.91 | 21d | 1 | 0.64mi |
| 1403 S Donnybrook Ave Tyler, TX | 3.0 | 3.0 | 1834 | $2,150 | $1.17 | 43d | 1 | 0.83mi |
| 556 W Erwin St Tyler, TX | 3.0 | 3.5 | 1956 | $2,550 | $1.30 | 21d | 1 | 1.23mi |
| 548 W Erwin St Tyler, TX | 3.0 | 3.5 | 1956 | $2,495 | $1.28 | 43d | 1 | 1.24mi |
| 548 W Erwin St Tyler, TX | 3.0 | 3.5 | 1956 | $2,295 | $1.17 | 21d | 1 | 1.24mi |
| 540 W Erwin St Tyler, TX | 3.0 | 3.5 | 1956 | $4,000 | $2.04 | 43d | 1 | 1.24mi |
| 1692 Alamo Xing Tyler, TX | 4.0 | 2.0 | 1610 | $2,300 | $1.43 | 13d | 1 | 1.31mi |
| 3301 Brookside Dr Tyler, TX | 4.0 | 2.0 | 2328 | $2,250 | $0.97 | 13d | 1 | 1.39mi |
Listing history 50 events
-
2026-06-19days on market $185,000 Active 16 DOM
-
2026-06-18days on market $185,000 Active 15 DOM
-
2026-06-17price $185,000 Active 14 DOM
-
2026-06-17days on market $199,000 Active 14 DOM
-
2026-06-16days on market $199,000 Active 13 DOM
-
2026-06-15days on market $199,000 Active 12 DOM
-
2026-06-14days on market $199,000 Active 10 DOM
-
2026-06-13days on market $199,000 Active 9 DOM
-
2026-06-10days on market $199,000 Active 7 DOM
-
2026-06-09days on market $199,000 Active 6 DOM
-
2026-06-08days on market $199,000 Active 5 DOM
-
2026-06-07days on market $199,000 Active 4 DOM
-
2026-06-05pricestatusdays on market $199,000 Active 1 DOM
-
2026-01-28price $229,500
-
2025-11-05price $235,000
-
2025-10-13$239,000 Active
-
2024-11-18status Active
-
2024-11-13status Active
-
2024-05-11$249,000 Active
-
2024-03-27historical
-
2024-03-20$249,000 Active
-
2023-12-31historical
-
2023-10-19price $249,000
-
2023-10-19price $249,000
-
2023-10-19price $249,000
-
2023-10-18$249,000 Active
-
2023-09-01status Active
-
2023-08-23price $259,000
-
2023-08-23price $259,000
-
2023-08-23status Active
-
2023-08-23status Active
-
2023-08-13historical
-
2023-08-11$259,000 Active
-
2023-08-11$259,000 Active
-
2023-08-09historical
-
2023-08-01historical
-
2023-07-06price $279,000
-
2023-07-06price $279,000
-
2023-07-06price $279,000
-
2023-06-15price $289,000
-
2023-06-15price $289,000
-
2023-06-14price $289,000
-
2023-05-18$299,000 Active
-
2023-05-18$299,000 Active
-
2023-05-18$279,000
-
2023-05-18$299,000 Active
-
2022-08-04soldstatus
-
2018-04-30soldstatus
-
2018-04-27soldstatus
-
2018-03-27$98,500
ⓘ Source: listings_history table (triggers on properties + properties_extension) + one-shot
backfill from property_details.listing_events for pre-trigger history.
Tax reassessment forecast TX · Resets to sale price
- Current annual tax
- $4,031 · $336/mo
- Projected year-2 tax
- $4,031 · $336/mo
- Expected delta
- $0/yr ($0/mo · 0.0%)
ⓘ Screening estimate from a state-policy table — verify with the county assessor before closing.
Climate risk First Street
- Flood 1/10 Low FEMA zone X (unshaded) · 0% chance over 30 yrs
- Wildfire 1/10 Low
- Heat 6/10 Major 7 d/yr ≥109°F today · 26 d/yr by 30 yrs out
- Wind 6/10 Major 59% chance of damaging wind over 30 yrs
- Air quality 2/10 Low 0 unhealthy d/yr today · 1 by 30 yrs out
Nearby sold comps map
Loading sold comps map…
Walkable amenities ~0.75 mi
Loading nearby amenities…
Taxation est. · year 1
- Rental income
- $24,945
- − Mortgage interest
- −$10,363
- − Property taxes
- −$4,031
- − Insurance
- −$925
- − Repairs & maintenance
- −$1,996
- − Management
- −$1,996
- − Depreciation
- −$5,382
- Taxable income
- $253
- Est. tax owed @ 24.0%
- −$61
- After-tax cash flow
- $3,048/yr
For passive investors: Depreciation is non-cash, so a rental often shows a tax loss while cash-flowing — sheltering income. Rental losses are passive: they offset passive income freely, and up to $25,000/yr can offset ordinary (W-2) income if you actively participate and your MAGI is under $100k (phasing out to $0 by $150k); unused losses carry forward. On sale, claimed depreciation is recaptured at up to 25%, and gains may owe capital-gains tax (a 1031 exchange can defer both). Figures are a year-1 estimate at your 24.0% rate — not tax advice; consult a CPA.
Schools (NCES district)
- District
- Tyler ISD
- NCES district ID
- 4843470
- Math proficiency
- 39% ▼ -4.00%
- Reading proficiency
- 38% ▼ -1.00%
- Median HH income
- $44,090
- Composite
- 32.69/100
- National rank
- #5650
- State rank
- #449 of 826 in TX
Livability — Tyler
- Score
- 75/100
- State rank
- #147
- US rank
- #4181
Category grades
Schools grade is shown separately in the Schools card above.
Census & demographics
- Census place
- Tyler, TX
- County
- Smith County · 180,570 people
- City population
- 127,842
- Metro
- Tyler, TX
- Population (ZIP)
- 36,344
- Household income
- $66,401
- Rent vs Own
- Severe rent burden
- 1116.0
Population outlook (Smith County) Hauer SSP2
- Today (2025)
- 248,890 people
- By 2030
- 261,665 · +5.1%
- By 2040
- 286,114 · +15.0%
- By 2050
- 308,006 · +23.8%
- By 2075
- 354,171 · +42.3%
- By 2100
- 372,828 · +49.8%
Race, ethnicity, and origin ACS 2023
- Neighborhood character
- Diverse neighborhood (Simpson 0.64)
- Race & ethnicity
- White 53% Black 21% Hispanic / Latino 19% Two or more races 8% Asian 2%
- Hispanic origin (detail)
- Mexican 17%
- Common ancestry
- Slovak 2% Italian 1% Lithuanian 1%
- Foreign-born
- 8% · Canada
- Languages at home
- 84% English-only · Spanish 14% Other Indo-European 1%
Political lean MEDSL · Smith
- 2024 margin
- Solid R (+45.1) · D 27.0% · R 72.1%
- 2008→2024 swing
- -5.6pp toward R · 2008: -39.5pp · 2024: -45.1pp
- All cycles
- 2024: R+45.1 2020: R+39.4 2016: R+43.9 2012: R+46.9 2008: R+39.5
Not yet ingested
- Civics
- —
Market trends
- HPI YoY
- ▼ -299.78%
- Current HPI
- 207.238
- Rent YoY
- ▲ 3.66%
- Metro
- Tyler, TX
- State GDP YoY
- ▲ 3.95%
- F500 in state
- 110
Industry mix (Fortune 500 HQ in TX)
| Industry | F500 HQs | Revenue |
|---|---|---|
| Energy | 16 | $1,198B |
|
||
| Technology | 5 | $198B |
|
||
| Engineering / Construction | 4 | $72B |
|
||
| Energy Services | 3 | $60B |
|
||
| Utilities | 3 | $41B |
|
||
| Healthcare | 2 | $330B |
|
||
Price history
+106.7% since first listed42 events — show timeline
- 2026-06-17 Price Changed $185,000 GTAR
- 2026-06-03 Listed $199,000 GTAR
- 2026-01-28 Price Changed $229,500 GTAR
- 2025-11-05 Price Changed $235,000 GTAR
- 2025-10-13 Listed $239,000 GTAR
- 2024-11-18 Relisted — GTAR
- 2024-11-13 Relisted — GTAR
- 2024-05-11 Listed $249,000 GTAR
- 2024-03-27 Delisted — GTAR
- 2024-03-20 Listed $249,000 GTAR
- 2023-12-31 Listing Removed — HARMLS
- 2023-10-19 Price Changed $249,000 HARMLS
- 2023-10-19 Price Changed $249,000 NTREIS
- 2023-10-19 Price Changed $249,000 LAAR
- 2023-10-18 Listed $249,000 GTAR
- 2023-09-01 Relisted — LAAR
- 2023-08-23 Price Changed $259,000 HARMLS
- 2023-08-23 Price Changed $259,000 NTREIS
- 2023-08-23 Relisted — HARMLS
- 2023-08-23 Relisted — NTREIS
- 2023-08-13 Delisted — LAAR
- 2023-08-11 Listed $259,000 GTAR
- 2023-08-11 Listed $259,000 LAAR
- 2023-08-09 Listing Removed — HARMLS
- 2023-08-01 Delisted — LAAR
- 2023-07-06 Price Changed $279,000 HARMLS
- 2023-07-06 Price Changed $279,000 NTREIS
- 2023-07-06 Price Changed $279,000 LAAR
- 2023-06-15 Price Changed $289,000 HARMLS
- 2023-06-15 Price Changed $289,000 NTREIS
- 2023-06-14 Price Changed $289,000 LAAR
- 2023-05-18 Listed $299,000 LAAR
- 2023-05-18 Listed $279,000 GTAR
- 2023-05-18 Listed $299,000 HARMLS
- 2023-05-18 Listed $299,000 NTREIS
- 2022-08-04 Sold (Public Records) — Public Records
- 2018-04-30 Sold (Public Records) — Public Records
- 2018-04-27 Sold (MLS) — GTAR
- 2018-03-27 Listed $98,500 GTAR
- 2013-08-27 Sold (Public Records) — Public Records
- 2013-08-26 Sold (MLS) — GTAR
- 2013-05-01 Listed $89,500 GTAR
Property tax history
+4.6%/yrLatest (2024): $4,031 · +10.4% YoY. Source: county tax records.
Cash-flow waterfall
monthlySold comps — $/sqft
last 12 mo · ≤1 miLoading sold comps…