Flex 5901 N · Evansville, IN
Flood risk 6/10 · Moderate
- FEMA flood zone
- X (unshaded)
- Chance of flooding over 30 yrs
- 0.7%
- Est. flood insurance / yr
- $507 – $1,088
Fire risk 1/10 · Minimal
- Est. fire insurance / yr
- $717 – $1,331
Heat risk 5/10 · Moderate
- Hot days now (above 107°F)
- 7 days/yr
- Hot days in 30 yrs
- 19 days/yr
Wind risk 2/10 · Minimal
- Chance of severe wind over 30 yrs
- 3.0%
Air-quality risk 4/10 · Minor
- Unhealthy air days now
- 3 days/yr
- Unhealthy air days in 30 yrs
- 5 days/yr
Risk factors via First Street. Map © Google.
Why this score? — see what drove the D grade
The composite is a weighted blend of 9 inputs, each scored 0–100. Each bar is that input's sub-score; the figure is the points it added to the 100-point composite (weight × sub-score).
- 1% rule +10.0/10.0
- Cash flow +8.2/30.0
- ARV discount +7.5/15.0
- Condition / age +4.8/5.0
- Schools +3.3/10.0
- Livability +3.2/5.0
- Rent growth +2.5/5.0
- DSCR +2.2/10.0
- Appreciation +0.0/10.0
$73,995
🖨 Deal sheet (PDF) 📄 Offer letter ✓ Due diligence
Listing remarks
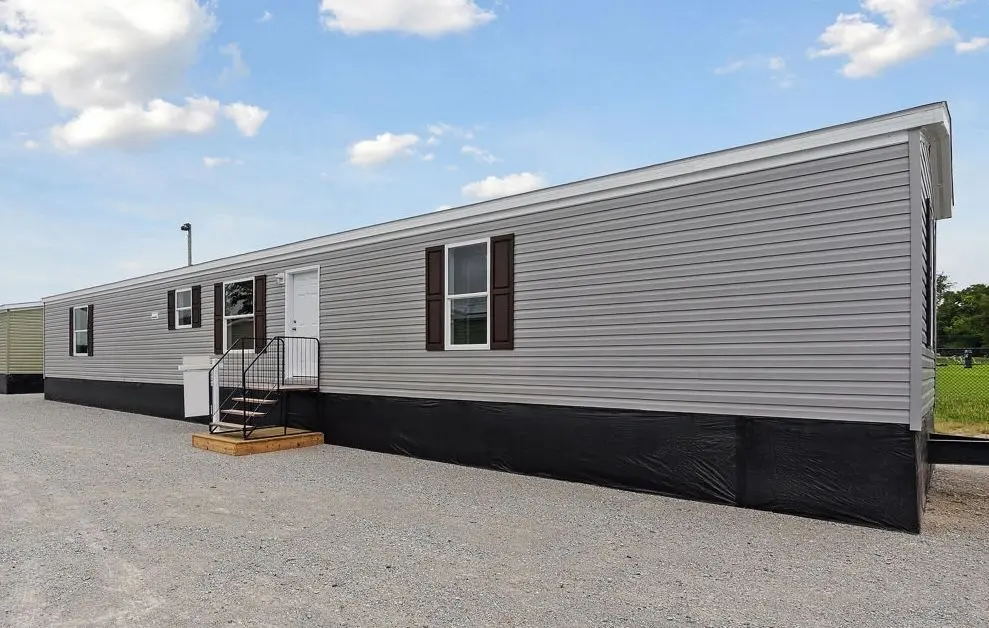
The Belmont offers a smart, spacious layout designed for comfortable everyday living. This thoughtfully designed home features 3 bedrooms and 2 full baths, providing plenty of room for family and guests. At the heart of the home, you'll find a beautiful, well-appointed kitchen that flows seamlessly into an expansive living area with extended length-perfect for entertaining, relaxing, or creating flexible spaces to fit your lifestyle. With its open design and generous proportions, the Belmont delivers both functionality and style in a home that truly feels inviting.
Key facts
- Built 2026
- Listed 45 days
Property features AI
Finance
- Other: Address: Flex 5901 N, Evansville, IN 47720; List price $73,995
- HOA & community: Association fee $475
Exterior
- Home design: Single-family property (Belmont/Grandin plan); Listed as Spec home
- Exterior features: Living area approximately 1,216 (interior living space)
Interior
- Bedrooms: 3 bedrooms
- Bathrooms: 2 full bathrooms
- Interior features: Spec home (Belmont/Grandin plan); Active listing
Neighborhood map
What this means for you Summary
Snapshot
- This is a 3-bed/2.0-bath manufactured listed at $74k. Condition is rated excellent.
Deal economics
- At list price, monthly cash flow is $-69 ($-831/yr) — negative.
- To cash-flow at today's rent, offer at most $64k (13.5% below list).
- Meets the 1% rule at list price ($1k rent vs $74k).
- Recommended offer: $64k (13.5% below list) — sets the bar for cash-flow.
Location & tenants
- Location reads 63/100 on livability (#416 in IN) — a middle-class / working-renter tenant base. Strengths: cost of living A+, housing A+, health & safety A+; Watch: crime F, commute F, employment D-.
- Evansville Vanderburgh School Corporation (urban): math 36% / reading 43% proficiency, ranked #153 of 301 in IN (top 51%) — families likely to look elsewhere, expect single-tenant / working-renter base with shorter leases.
- Zoned schools: Highland Elementary School (math 55% / reading 54%, grade C, #197 of 994 statewide, top 22%, 839 students, 49% FRL); Thompkins Middle School (math 39% / reading 46%, grade D-, #98 of 330 statewide, top 30%, 618 students, 53% FRL); Central High School (math 38% / reading 74%, grade C, #73 of 369 statewide, top 20%, 1,090 students, 52% FRL) — zoned schools at 51% FRL track the district average.
- Market conditions: 107 active listings in the ZIP; 4 comparable units currently listed for rent nearby; rentals at typical pace (median 23d on market — plan ~3-4 weeks tenant-placement turnaround); 508 units permitted in Vanderburgh County in 2024 (32 in 5+ unit buildings).
Forward outlook
- Local home prices are declining (-3.0%/yr); year-one equity from $511 of loan paydown is wiped out by about $2k of value loss. Plan a longer hold.
Negotiation context
- It's been on market 45 days — a 3% lower offer ($72k) is reasonable based on typical stale-listing flexibility.
Risks & watch-outs
- Watch-outs: HOA is 41% of rent.
- Climate carrying-cost: major flood risk; extreme-heat days projected 7→19/yr by 2055 (HVAC capex compounding) — expect insurance premiums to compound above CPI over the hold.
Questions for the listing agent
- What do current leases actually rent for vs. the listed asking? Can we see a recent rent roll and the last 12 months of T-12 income?
- It's been on market 45 days. Have you received any prior offers? Is the seller open to a 14% concession, seller financing, or rate buy-down credit?
- What does the HOA fee cover, when was the last increase, and are there any pending special assessments or reserve-fund shortfalls?
- Is there a deadline driving the sale (1031 exchange, divorce, estate, relocation)? That informs how much negotiation room exists.
- Schools are D-rated, which usually means shorter tenancies and higher turnover. Who's the typical renter profile here, and what's been the actual vacancy rate?
- Crime grade is F in this area — have there been break-ins, vandalism, or insurance claims at this property in the last 3 years? What carrier currently insures it and at what premium?
- The area grade is low — what's the realistic commute time and amenity access for the typical tenant pool here? Any planned neighborhood developments (good or bad) we should know about?
- What's the average days-on-market for RENTAL listings here right now (not sales)? A rising rental-DOM trend means longer vacancies and softer asking-rent achievability than the comps imply.
- What's the recent tenant-quality profile in this submarket — average credit score on applications, eviction rate, late-payment / NSF rate, and stable-employment percentage? A property-management company in the area should have these aggregated.
- How much new for-sale + rental construction is in the pipeline within 1–3 miles? Heavy new supply typically softens prices + rents 12–24 months out; constrained supply supports both.
Investment metrics
- 1% rule
- 1.57% ✓
- Cap rate
- 5.17%
- Cash-on-cash
- -4.01%
- DSCR
- 0.82
- GRM
- 5.3
CMA / ARV
No comps found within radius.
Projected returns pro-forma
-3.0% appreciation · 3.0% rent growth · sell at horizon
- IRR
- -22.4%
- Equity multiple
- 0.22×
- Total profit
- $-16,090
- Equity at exit
- $11,033
- IRR
- -15.4%
- Equity multiple
- 0.11×
- Total profit
- $-18,430
- Equity at exit
- $6,398
Cash invested: $20,719 (down + closing). Projections, not guarantees.
Landlord ↔ Tenant lean methodology
- Overall (STATE)
- 90 Strongly Landlord-Friendly
- State Indiana
- 90 Strongly Landlord-Friendly · R+11
- County
- — inherits STATE
- City
- — inherits STATE
ZIP-level market 47720
- Home prices YoY
- -33.7%
- Active inventory
- 107
- Price-to-rent
- 5.3×
Monthly cashflow live
- Estimated rent
- $1,161 medium interval (Pro) →
- Mortgage (P&I)
- −$388
- Tax est. 1.5%
- −$92 /mo · $1,110/yr
- Insurance
- −$31
- HOA
- −$475
- Vacancy / Maint / Mgmt
- −$244
- Net cashflow
- $-69
Break-even live
Sensitivity live
| Price | -10% $-18 | -5% $-44 | +0% $-69 | +5% $-95 | +10% $-120 |
|---|---|---|---|---|---|
| Rent | -10% $-161 | -5% $-115 | +0% $-69 | +5% $-23 | +10% $22 |
| Rate | -1.0pp $-32 | -0.5pp $-50 | base $-69 | +0.5pp $-88 | +1.0pp $-108 |
UW: 25.0% down · 7.5% · 30yr · 1.5% tax · 5.0% vac · 8.0% maint · 8.0% mgmt
Financing live
Cash to close
- Down payment
- $18,499
- Closing costs
- $2,220
- Reserves months
- —
- Total cash needed
- —
Loan-product check · same deal, 3 products live
Conventional
25% down · 7.5% · 30yr
- Down + closing
- —
- Monthly P&I
- —
- Monthly cashflow
- —
- DSCR
- —
- Eligible?
- —
Personal DTI + credit; lowest rate.
DSCR
20% down · 8.5% · 30yr
- Down + closing
- —
- Monthly P&I
- —
- Monthly cashflow
- —
- DSCR
- —
- Eligible?
- —
No personal income docs; deal must DSCR.
Hard money
10% down · 12.0% · 12mo
- Down + closing
- —
- Monthly P&I
- —
- Monthly cashflow
- —
- DSCR
- —
- Eligible?
- —
Short-term bridge; refi at stabilization.
Rent comps 4 comps
| Address | Beds | Baths | Sqft | Rent | $/sqft | DOM | Units | Dist |
|---|---|---|---|---|---|---|---|---|
| 6907 Sweet Gum Ct Evansville, IN | 1.0–2.0 | 1.0 | 672 | $899 | $1.34 | 23d | 3 | 1.23mi |
| 1219 Kiwi Ct Evansville, IN | 2.0 | 2.0 | 1200 | $1,250 | $1.04 | 23d | 1 | 1.31mi |
| 1125 Wellington Dr Evansville, IN | 1.0–2.0 | 1.0–1.5 | 975 | $1,340 | $1.37 | 15d | 15 | 1.37mi |
| 3900 N Fulton Ave Evansville, IN | 2.0 | 1.0 | 620 | $1,015 | $1.64 | 15d | 6 | 1.38mi |
HOA detail
- Monthly dues
- $475 · $5,700/yr
Listing history 15 events
-
2026-06-22days on market $73,995 Active 45 DOM
-
2026-06-18days on market $73,995 Active 42 DOM
-
2026-06-17days on market $73,995 Active 41 DOM
-
2026-06-16days on market $73,995 Active 40 DOM
-
2026-06-15days on market $73,995 Active 39 DOM
-
2026-06-14days on market $73,995 Active 37 DOM
-
2026-06-13days on market $73,995 Active 36 DOM
-
2026-06-10days on market $73,995 Active 34 DOM
-
2026-06-09days on market $73,995 Active 33 DOM
-
2026-06-08days on market $73,995 Active 32 DOM
-
2026-06-07days on market $73,995 Active 31 DOM
-
2026-06-02days on market $73,995 Active 26 DOM
-
2026-06-01days on market $73,995 Active 25 DOM
-
2026-05-31days on market $73,995 Active 24 DOM
-
2026-05-30days on market $73,995 Active 23 DOM
ⓘ Source: listings_history table (triggers on properties + properties_extension) + one-shot
backfill from property_details.listing_events for pre-trigger history.
Climate risk First Street
- Flood 6/10 Major FEMA zone X (unshaded) · 70% chance over 30 yrs
- Wildfire 1/10 Low
- Heat 5/10 Major 7 d/yr ≥107°F today · 19 d/yr by 30 yrs out
- Wind 2/10 Low 3% chance of damaging wind over 30 yrs
- Air quality 4/10 Moderate 3 unhealthy d/yr today · 5 by 30 yrs out
Nearby sold comps map
Loading sold comps map…
Walkable amenities ~0.75 mi
Loading nearby amenities…
Taxation est. · year 1
- Rental income
- $13,931
- − Mortgage interest
- −$4,145
- − Property taxes
- −$1,110
- − Insurance
- −$370
- − Repairs & maintenance
- −$1,115
- − Management
- −$1,115
- − HOA
- −$5,700
- − Depreciation
- −$2,153
- Taxable loss
- −$1,775
- Est. tax savings @ 24.0%
- +$426
- After-tax cash flow
- $-405/yr
For passive investors: Depreciation is non-cash, so a rental often shows a tax loss while cash-flowing — sheltering income. Rental losses are passive: they offset passive income freely, and up to $25,000/yr can offset ordinary (W-2) income if you actively participate and your MAGI is under $100k (phasing out to $0 by $150k); unused losses carry forward. On sale, claimed depreciation is recaptured at up to 25%, and gains may owe capital-gains tax (a 1031 exchange can defer both). Figures are a year-1 estimate at your 24.0% rate — not tax advice; consult a CPA.
Condition & rehab AI · 13 photos
This manufactured home is in excellent condition with a modern and well-maintained interior and exterior. It offers a spacious and functional layout with potential for minor updates to further enhance its value.
Value-add opportunities
- Both Painting the interior walls — Fresh paint can enhance the home's appeal and value.
- Both Landscaping improvements — Enhanced landscaping can increase curb appeal and property value.
- Both Adding smart home features — Smart home features can increase the home's value and attract tech-savvy buyers/renters.
Renovation cost estimate screening
Value-add ROI direction
- Both Painting the interior walls — Fresh paint can enhance the home's appeal and value. ↑
- Both Landscaping improvements — Enhanced landscaping can increase curb appeal and property value. ↑
- Both Adding smart home features — Smart home features can increase the home's value and attract tech-savvy buyers/renters. ↑
ⓘ Cost ranges are severity-bucket heuristics (US national rule-of-thumb). Get contractor quotes + a written scope before underwriting a rehab budget.
Schools (NCES district)
- District
- Evansville Vanderburgh School Corporation
- NCES district ID
- 1803450
- Math proficiency
- 36% ▼ -7.00%
- Reading proficiency
- 43% ▼ -3.00%
- Median HH income
- $43,270
- Composite
- 33.41/100
- National rank
- #5471
- State rank
- #153 of 301 in IN
Livability — Evansville
- Score
- 63/100
- State rank
- #416
- US rank
- #15047
Category grades
Schools grade is shown separately in the Schools card above.
Census & demographics
- City population
- 146,793
- Population (ZIP)
- 17,103
Population outlook (Vanderburgh County) Hauer SSP2
- Today (2025)
- 187,038 people
- By 2030
- 188,907 · +1.0%
- By 2040
- 190,272 · +1.7%
- By 2050
- 188,871 · +1.0%
- By 2075
- 180,751 · -3.4%
- By 2100
- 163,015 · -12.8%
Race, ethnicity, and origin ACS 2023
- Neighborhood character
- Predominantly White (94%)
- Race & ethnicity
- White 94% Two or more races 4% Hispanic / Latino 1%
- Common ancestry
- Slovak 4% Lithuanian 3% Italian 2%
- Foreign-born
- 1%
Political lean MEDSL · Vanderburgh
- 2024 margin
- R (+12.7) · D 43.0% · R 55.6% · Other 1.4%
- 2008→2024 swing
- -15.1pp toward R · 2008: 2.5pp · 2024: -12.7pp
- All cycles
- 2024: R+12.7 2020: R+9.6 2016: R+16.9 2012: R+10.8 2008: D+2.5
Not yet ingested
- Civics
- —
Market trends
- HPI YoY
- ▼ -98.44%
- Current HPI
- 193.409
- Rent YoY
- —
- Metro
- —
- State GDP YoY
- ▲ 2.90%
- F500 in state
- 18
Industry mix (Fortune 500 HQ in IN)
| Industry | F500 HQs | Revenue |
|---|---|---|
| Industrial Machinery | 2 | $37B |
|
||
| Healthcare | 1 | $177B |
|
||
| Pharmaceuticals | 1 | $45B |
|
||
| Metals / Steel | 1 | $18B |
|
||
| Agriculture | 1 | $17B |
|
||
| Packaging | 1 | $12B |
|
||
Cash-flow waterfall
monthlySold comps — $/sqft
last 12 mo · ≤1 miLoading sold comps…