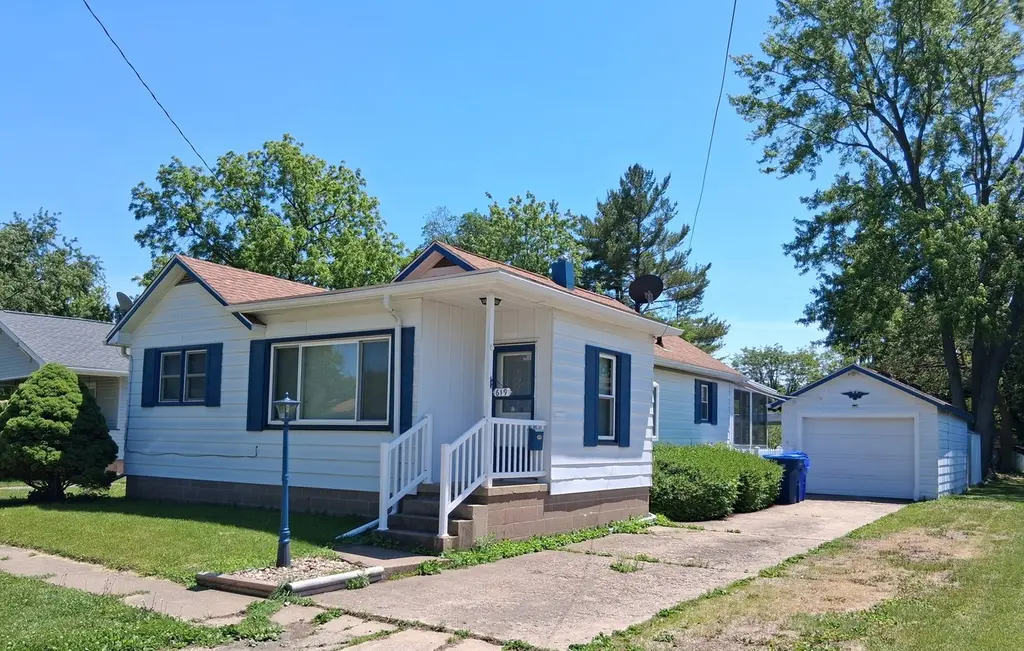
619 Dewey Ave · Kewanee, IL
Flood risk 1/10 · Minimal
- FEMA flood zone
- X (unshaded)
- Chance of flooding over 30 yrs
- 0.0%
- Est. flood insurance / yr
- $473 – $860
Fire risk 1/10 · Minimal
- Est. fire insurance / yr
- $804 – $1,492
Heat risk 3/10 · Minor
- Hot days now (above 103°F)
- 7 days/yr
- Hot days in 30 yrs
- 17 days/yr
Wind risk 2/10 · Minimal
- Chance of severe wind over 30 yrs
- —
Air-quality risk 3/10 · Minor
- Unhealthy air days now
- 2 days/yr
- Unhealthy air days in 30 yrs
- 3 days/yr
Risk factors via First Street. Map © Google.
Why this score? — see what drove the B grade
The composite is a weighted blend of 9 inputs, each scored 0–100. Each bar is that input's sub-score; the figure is the points it added to the 100-point composite (weight × sub-score).
- Cash flow +30.0/30.0
- ARV discount +15.0/15.0
- DSCR +10.0/10.0
- 1% rule +7.6/10.0
- Livability +3.5/5.0
- Rent growth +2.5/5.0
- Condition / age +2.5/5.0
- Schools +1.9/10.0
- Appreciation +0.0/10.0
$84,000
🖨 Deal sheet 📄 Offer letter ✓ Due diligence
Listing remarks
This cute 2-bedroom, one-story bungalow with 1 car garage has so much to offer. You will love the covered patio to relax on right off the rear glass 3-season room with sky-light window, the nicely updated kitchen with modern cabinetry & counters with dishwasher, the spacious living room/ dining room combination, office/den & updated bath with large shower, vanity with single bowl sink & stool. The master bedroom has 2 nice sized closets. The refrigerator, stove, microwave, washer and dryer all stay. The laundry room is in the basement along with an additional bath with shower, sink and stool. The completely glassed 3-season room allows you to enjoy the feeling of being out
Key facts
- Covered patio
- Updated kitchen
- Walk-up attic
Tags
Property features AI
Finance
- Other: Approx. total finished area reported as 1,124 (taped); Total finished/unfinished area reported as 1,800; Unfinished basement (partial) with approx. 676 unfinished sq. ft.; Lot dimensions approximately 56 x 150 (less than 0.25 acre)
- HOA & community: No master association fee required
Exterior
- Parking: Detached garage with garage door opener (garage owned); Concrete driveway/parking; Total 1 parking space
- Utilities: Public water; Public sewer; Electric with circuit breakers; Cable available
- Home design: Detached single-family home; One-story layout; Fee simple ownership; Property over 100 years old; Built before 1978
- Construction: Aluminum siding; Asphalt roof; Brick/mortar and concrete perimeter foundation
- Exterior features: Patio; Partial yard fencing; Sidewalks
Interior
- Kitchen: Updated kitchen; Range; Microwave; Range hood; Dishwasher; Refrigerator
- Bedrooms: Master bedroom on main level (11 x 16) with blinds and double-pane windows; Second bedroom on main level (8 x 11) with blinds and double-pane windows; Additional bedrooms listed (total 2 bedrooms)
- Flooring: Laminate and hardwood floors; Carpet in master bedroom; Other flooring in laundry room
- Bathrooms: Two full bathrooms; Basement includes a bathroom; No tub
- Heating & cooling: Natural gas heating; Forced air and baseboard heating; Central air conditioning
- Interior features: First-floor bedroom and first-floor full bath; Dining area combined with living room; Storm door(s); Skylights and window screens; Ceiling fan(s); 6 total rooms
- Laundry & utility: Laundry room with gas dryer hookup; Washer and dryer included
Neighborhood map
What this means for you Summary
Snapshot
- This is a 2-bed/1.0-bath single-family listed at $84k.
Deal economics
- At list price, monthly cash flow is $323 ($4k/yr) — positive.
- The deal already cash-flows at list — no discount required.
- Meets the 1% rule at list price ($1k rent vs $84k).
- Cap rate 10.9% vs local median 8.7% in Kewanee — meaningfully above typical; check what's discounted (condition, days-on-market, listing class) to confirm the premium yield is real.
Location & tenants
- Location reads 69/100 on livability (#409 in IL) — a middle-class / working-renter tenant base. Strengths: cost of living A+, health & safety A+, housing A; Watch: crime D-, amenities F, commute F.
- Wethersfield CUSD 230 (town): math 16% / reading 30% proficiency, ranked #391 of 620 in IL (top 63%) — low school quality limits family demand, transient renter base, plan for 1-2y turnover.
- Zoned schools: Wethersfield Elem School (math 12% / reading 17%, grade F, #1,278 of 2,056 statewide, top 65%, 312 students, 0% FRL); Wethersfield Jr/Sr High School (math 22% / reading 42%, grade F, #157 of 693 statewide, top 25%, 224 students, 0% FRL) — zoned schools average 0% FRL vs 37% district-wide (37 pts lower); this property's tenant base skews higher-income than the district average.
- Market conditions: 39 active listings in the ZIP; 32 units permitted in Henry County in 2024 (0 in 5+ unit buildings).
Forward outlook
- Local home prices are declining (-3.0%/yr); year-one equity from $581 of loan paydown is wiped out by about $3k of value loss. Plan a longer hold.
- Henry County population projected at -16% by 2050 — secular population decline; favor cash flow + early exit over multi-decade hold.
- At projected returns (-3.0% appreciation + 3.0% rent growth), your $24k cash investment doubles in ~8 years — after that, you're playing with house money.
Negotiation context
- Only 5 days on market — expect competitive offers; lowballing is unlikely to land.
- Current owner paid $51k; list at $84k implies a 65% gain — meaningful room to come down on a strong offer.
Risks & watch-outs
- Watch-outs: built in 1918 — expect roof / HVAC / electrical / plumbing capex.
Questions for the listing agent
- Built in 1918 — when were the roof, HVAC, electrical panel, plumbing, and water heater last replaced?
- Is there a deadline driving the sale (1031 exchange, divorce, estate, relocation)? That informs how much negotiation room exists.
- Schools are F-rated, which usually means shorter tenancies and higher turnover. Who's the typical renter profile here, and what's been the actual vacancy rate?
- Crime grade is D in this area — have there been break-ins, vandalism, or insurance claims at this property in the last 3 years? What carrier currently insures it and at what premium?
- What's the average days-on-market for RENTAL listings here right now (not sales)? A rising rental-DOM trend means longer vacancies and softer asking-rent achievability than the comps imply.
- What's the recent tenant-quality profile in this submarket — average credit score on applications, eviction rate, late-payment / NSF rate, and stable-employment percentage? A property-management company in the area should have these aggregated.
- How much new for-sale + rental construction is in the pipeline within 1–3 miles? Heavy new supply typically softens prices + rents 12–24 months out; constrained supply supports both.
Investment metrics
- 1% rule
- 1.26% ✓
- Cap rate
- 10.91%
- Cash-on-cash
- 16.47%
- DSCR
- 1.73
- GRM
- 6.6
CMA / ARV
- ARV (on-the-fly)
- $143,440
- Comps found
- 12
Show comp detail 12 sales within ~0.75 mi
| Address | Dist | Beds/Ba | Sqft | Sold | Price | $/sf | Match |
|---|---|---|---|---|---|---|---|
| 521 W Mill St | 0.10mi | 2/1.0 | 1,300 (-0%) | 1mo | $145,000 | $112 | 94 |
| 1111 Pine St | 0.18mi | 2/1.0 | 1,360 (+4%) | 2mo | $34,000 | $25 | 83 |
| 237 Birch Pl | 0.20mi | 3/2.0 (+1) | 1,440 (+10%) | 0mo | $240,000 | $167 | 64 |
| 236 W Church St | 0.49mi | 2/1.0 | 1,196 (-8%) | 2mo | $134,000 | $112 | 62 |
| 200 S Acorn St | 0.12mi | 3/2.0 (+1) | 1,456 (+12%) | 9mo | $180,000 | $124 | 59 |
| 529 Whitney Ave | 0.65mi | 2/1.0 | 1,392 (+7%) | 2mo | $127,500 | $92 | 57 |
| 216 Hillcrest Dr | 0.52mi | 3/1.5 (+1) | 1,252 (-4%) | 7mo | $84,000 | $67 | 56 |
| 216 Hillcrest Dr | 0.52mi | 3/1.5 (+1) | 1,252 (-4%) | 7mo | $84,000 | $67 | 56 |
| 215 W Garfield St | 0.72mi | 2/2.0 | 1,262 (-3%) | 5mo | $85,000 | $67 | 53 |
| 833 David St | 0.29mi | 3/2.0 (+1) | 1,456 (+12%) | 9mo | $160,000 | $110 | 51 |
| 833 David St | 0.29mi | 3/2.0 (+1) | 1,456 (+12%) | 9mo | $160,000 | $110 | 51 |
| 451 S Grove St | 0.53mi | 3/2.0 (+1) | 1,237 (-5%) | 9mo | $67,500 | $55 | 50 |
Match score weights: distance 35% · size 25% · config 20% · recency 20%. Top-matched comps best support the ARV.
Projected returns pro-forma
-3.0% appreciation · 3.0% rent growth · sell at horizon
- IRR
- 7.5%
- Equity multiple
- 1.29×
- Total profit
- $6,929
- Equity at exit
- $12,525
- IRR
- 16.8%
- Equity multiple
- 2.38×
- Total profit
- $32,419
- Equity at exit
- $7,263
Cash invested: $23,520 (down + closing). Projections, not guarantees.
Landlord ↔ Tenant lean methodology
- Overall (STATE)
- 43 Moderately Tenant-Leaning
- State Illinois
- 43 Moderately Tenant-Leaning · D+7
- County
- — inherits STATE
- City
- — inherits STATE
ZIP-level market 61443
- Active inventory
- 39
- Price-to-rent
- 6.6×
Monthly cashflow live
- Estimated rent
- $1,062 medium interval (Pro) →
- Mortgage (P&I)
- −$441
- Tax from tax record
- −$41 /mo · $486/yr
- Insurance
- −$35
- HOA
- −$0
- Vacancy / Maint / Mgmt
- −$223
- Net cashflow
- $323
Break-even live
UW: 25.0% down · 7.5% · 30yr · 1.5% tax · 5.0% vac · 8.0% maint · 8.0% mgmt
Financing live
Cash to close
- Down payment
- $21,000
- Closing costs
- $2,520
- Reserves months
- —
- Total cash needed
- —
Loan-product check · same deal, 3 products live
Conventional
25% down · 7.5% · 30yr
- Down + closing
- —
- Monthly P&I
- —
- Monthly cashflow
- —
- DSCR
- —
- Eligible?
- —
Personal DTI + credit; lowest rate.
DSCR
20% down · 8.5% · 30yr
- Down + closing
- —
- Monthly P&I
- —
- Monthly cashflow
- —
- DSCR
- —
- Eligible?
- —
No personal income docs; deal must DSCR.
Hard money
10% down · 12.0% · 12mo
- Down + closing
- —
- Monthly P&I
- —
- Monthly cashflow
- —
- DSCR
- —
- Eligible?
- —
Short-term bridge; refi at stabilization.
Listing history 7 events
-
2026-06-01status $84,000 Pending 5 DOM
-
2026-06-01days on market $84,000 Active 5 DOM
-
2026-05-31days on market $84,000 Active 4 DOM
-
2026-05-31days on market $84,000 Active 3 DOM
-
2026-05-27$84,000 Active
-
2017-01-31soldstatus $51,000
-
2012-11-01soldstatus $50,000
ⓘ Source: listings_history table (triggers on properties + properties_extension) + one-shot
backfill from property_details.listing_events for pre-trigger history.
Tax reassessment forecast IL · Partial reset (capped growth)
- Current annual tax
- $486 · $41/mo
- Projected year-2 tax
- $1,197 · $100/mo
- Expected delta
- +$710/yr (+$59/mo · 146.0%)
ⓘ Screening estimate from a state-policy table — verify with the county assessor before closing.
Climate risk First Street
- Flood 1/10 Low FEMA zone X (unshaded) · 0% chance over 30 yrs
- Wildfire 1/10 Low
- Heat 3/10 Moderate 7 d/yr ≥103°F today · 17 d/yr by 30 yrs out
- Wind 2/10 Low
- Air quality 3/10 Moderate 2 unhealthy d/yr today · 3 by 30 yrs out
Nearby sold comps map
Loading sold comps map…
Walkable amenities ~0.75 mi
Loading nearby amenities…
Taxation est. · year 1
- Rental income
- $12,743
- − Mortgage interest
- −$4,705
- − Property taxes
- −$486
- − Insurance
- −$420
- − Repairs & maintenance
- −$1,019
- − Management
- −$1,019
- − Depreciation
- −$2,444
- Taxable income
- $2,649
- Est. tax owed @ 24.0%
- −$636
- After-tax cash flow
- $3,239/yr
For passive investors: Depreciation is non-cash, so a rental often shows a tax loss while cash-flowing — sheltering income. Rental losses are passive: they offset passive income freely, and up to $25,000/yr can offset ordinary (W-2) income if you actively participate and your MAGI is under $100k (phasing out to $0 by $150k); unused losses carry forward. On sale, claimed depreciation is recaptured at up to 25%, and gains may owe capital-gains tax (a 1031 exchange can defer both). Figures are a year-1 estimate at your 24.0% rate — not tax advice; consult a CPA.
Schools (NCES district)
- District
- Wethersfield CUSD 230
- NCES district ID
- 1742060
- Math proficiency
- 16% ▼ -10.00%
- Reading proficiency
- 30% ▼ -11.00%
- Median HH income
- $38,899
- Composite
- 19.29/100
- National rank
- #8800
- State rank
- #391 of 620 in IL
Livability — Kewanee
- Score
- 69/100
- State rank
- #409
- US rank
- #8423
Category grades
Schools grade is shown separately in the Schools card above.
Census & demographics
- Census place
- Kewanee, IL
- Population (ZIP)
- 13,529
Population outlook (Henry County) Hauer SSP2
- Today (2025)
- 47,376 people
- By 2030
- 45,920 · -3.1%
- By 2040
- 42,829 · -9.6%
- By 2050
- 39,606 · -16.4%
- By 2075
- 31,848 · -32.8%
- By 2100
- 23,503 · -50.4%
Race, ethnicity, and origin ACS 2023
- Neighborhood character
- Predominantly White (79%)
- Race & ethnicity
- White 79% Hispanic / Latino 11% Black 6% Two or more races 5%
- Hispanic origin (detail)
- Mexican 9% Puerto Rican 1%
- Common ancestry
- Romanian 4% English 3% Italian 3%
- Foreign-born
- 3% · Canada
- Languages at home
- 92% English-only · Spanish 7%
Political lean MEDSL · Henry
- 2024 margin
- Strong R (+24.5) · D 36.8% · R 61.3% · Other 1.9%
- 2008→2024 swing
- -32.2pp toward R · 2008: 7.7pp · 2024: -24.5pp
- All cycles
- 2024: R+24.5 2020: R+21.4 2016: R+21.2 2012: D+3.1 2008: D+7.7
Not yet ingested
- Civics
- —
Market trends
- HPI YoY
- ▼ -68.32%
- Current HPI
- 121.8672
- Rent YoY
- —
- Metro
- —
- State GDP YoY
- ▲ 1.59%
- F500 in state
- 60
Industry mix (Fortune 500 HQ in IL)
| Industry | F500 HQs | Revenue |
|---|---|---|
| Insurance | 4 | $201B |
|
||
| Consumer Goods | 4 | $87B |
|
||
| Industrial Machinery | 3 | $64B |
|
||
| Healthcare | 2 | $55B |
|
||
| Retail / Pharmacy | 1 | $148B |
|
||
| Agriculture / Food | 1 | $86B |
|
||
Price history
+68.0% since first listed3 events — show timeline
- 2026-05-27 Listed $84,000 MRED as Distributed by MLS Grid
- 2017-01-31 Sold (Public Records) $51,000 Public Records
- 2012-11-01 Sold (Public Records) $50,000 Public Records
Property tax history
-5.6%/yrLatest (2024): $486 · -54.2% YoY. Source: county tax records.
Cash-flow waterfall
monthlySold comps — $/sqft
last 12 mo · ≤1 miLoading sold comps…