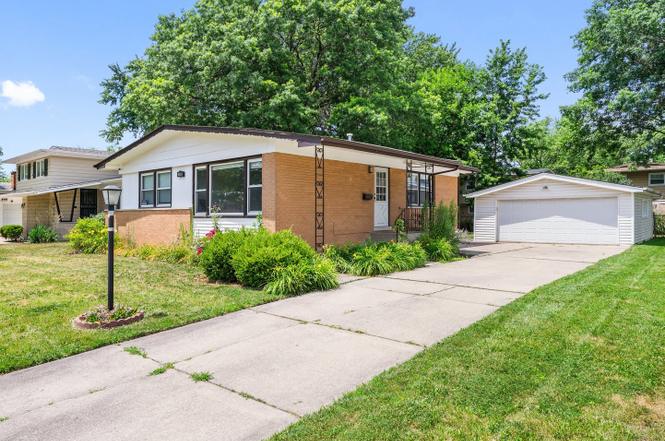
240 N Park Dr · Glenwood, IL
Flood risk 1/10 · Minimal
- FEMA flood zone
- X (shaded)
- Chance of flooding over 30 yrs
- 0.0%
- Est. flood insurance / yr
- $473 – $860
Fire risk 1/10 · Minimal
- Est. fire insurance / yr
- $804 – $1,492
Heat risk 3/10 · Minor
- Hot days now (above 101°F)
- 7 days/yr
- Hot days in 30 yrs
- 15 days/yr
Wind risk 2/10 · Minimal
- Chance of severe wind over 30 yrs
- —
Air-quality risk 4/10 · Minor
- Unhealthy air days now
- 4 days/yr
- Unhealthy air days in 30 yrs
- 5 days/yr
Risk factors via First Street. Map © Google.
Why this score? — see what drove the F grade
The composite is a weighted blend of 9 inputs, each scored 0–100. Each bar is that input's sub-score; the figure is the points it added to the 100-point composite (weight × sub-score).
- Cash flow +7.3/30.0
- ARV discount +6.9/15.0
- 1% rule +4.8/10.0
- Livability +3.3/5.0
- Rent growth +2.5/5.0
- Condition / age +2.5/5.0
- Schools +2.4/10.0
- DSCR +1.5/10.0
- Appreciation +0.0/10.0
$214,900
🖨 Deal sheet (PDF) 📄 Offer letter ✓ Due diligence
Listing remarks MLS
SPACIOUS AND UPDATED HOME IN GLENWOOD! THIS GREAT HOME FEATURES A XL KITCHEN WITH ISLAND, STAINLESS STEEL APPLIANCES, GRANITE COUNTERS, HARDWOOD FLOORS THROUGHOUT, FULL FINISHED BASEMENT W/ CERAMIC TILE FLOORS, RECESSED LIGHTING, LARGE LAUNDRY ROOM W/ SINK, SPACIOUS YARD W/ REAR PATIO, 2.5 CAR DETACHED GARAGE, EXCELLENT LOCATION NEXT TO THE PARK, SHOPPING AND EXPRESSWAYS. SCHEDULE A VIEWING TODAY!
Key facts
- Generous yard
- Spacious kitchen
- Granite countertops
Tags
Property features AI
Finance
- Other: Lot dimensions approximately 60 x 120 (less than 0.25 acre); Total finished area includes finished basement (below-grade finished area approx. 1,088); Total finished/unfinished area reported as 2,176
- HOA & community: No master association fee required
Exterior
- Parking: Detached garage with 2.5 garage spaces; Concrete driveway; Garage door opener; Owned garage
- Security: CO detectors
- Utilities: Public water; Public sewer; Electric service with circuit breakers
- Home design: Detached single-family home; One-story layout with finished basement; Built approximately 61–70 years ago; Fee simple ownership
- Construction: Brick construction; Asphalt roof; Concrete perimeter foundation
- Exterior features: Patio; School bus service available
Interior
- Kitchen: Range; Microwave; Dishwasher; Refrigerator
- Bedrooms: 3 bedrooms (plus a possible 4th); One bedroom located in the basement
- Flooring: Hardwood flooring in primary living areas and some bedrooms; Porcelain tile in kitchen, basement family room, basement bedroom and basement laundry
- Bathrooms: 2 full bathrooms; Basement includes a bathroom
- Heating & cooling: Natural gas forced-air heating; Central air conditioning; CO detectors
- Interior features: Walk-in closets; Window screens; Finished full basement
- Laundry & utility: Basement laundry with gas dryer hookup and utility sink; Washer and dryer included
Neighborhood map
What this means for you Summary
Snapshot
- This is a 2-bed/1.0-bath single-family listed at $215k.
Deal economics
- At list price, monthly cash flow is $-286 ($-3k/yr) — negative.
- To cash-flow at today's rent, offer at most $178k (17.2% below list).
- To meet the 1% rule (rent ≥ 1% of price), the offer needs to be $212k (1.5% below list).
- Recommended offer: $178k (17.2% below list) — sets the bar for cash-flow.
- Cap rate 4.7% vs local median 8.0% in Glenwood — below-typical yield; the buyer is paying a premium for something (appreciation thesis, condition, location) that the cap rate doesn't capture.
Location & tenants
- Location reads 66/100 on livability (#545 in IL) — a middle-class / working-renter tenant base. Strengths: cost of living A+, housing A+, employment B; Watch: health & safety D+, amenities F, commute F.
- Homewood Flossmoor Chsd 233 (suburban): math 21% / reading 27% proficiency, ranked #272 of 620 in IL (top 44%) — low school quality limits family demand, transient renter base, plan for 1-2y turnover.
- Zoned schools: Longwood Elem School (math 2% / reading 8%, grade F, #1,741 of 2,056 statewide, top 93%, 330 students, 0% FRL); Brookwood Jr High School (math 5% / reading 20%, grade F, #545 of 665 statewide, top 83%, 241 students, 0% FRL); Homewood-Flossmoor High School (math 21% / reading 27%, grade F, #304 of 693 statewide, top 44%, 2,798 students, 0% FRL).
- Market conditions: 53 active listings in the ZIP; 3 comparable units currently listed for rent nearby; rentals leasing fast (median 0d on market — plan ~1-2 weeks tenant-placement turnaround); 6,272 units permitted in Cook County in 2024 (4,658 in 5+ unit buildings).
Forward outlook
- Local home prices are declining (-3.0%/yr); year-one equity from $1k of loan paydown is wiped out by about $6k of value loss. Plan a longer hold.
Negotiation context
- It's been on market 171 days — a 12% lower offer ($189k) is reasonable based on typical stale-listing flexibility.
- 9 sale attempts since 11y ago; this cycle's ask has dropped $25k (10%) from the opening price — seller is motivated, your offer sets the floor, not the list.
Risks & watch-outs
- Watch-outs: property tax is 4.1% of price.
Questions for the listing agent
- What do current leases actually rent for vs. the listed asking? Can we see a recent rent roll and the last 12 months of T-12 income?
- It's been on market 171 days. Have you received any prior offers? Is the seller open to a 17% concession, seller financing, or rate buy-down credit?
- Built in 1965 — when were the roof, HVAC, electrical panel, plumbing, and water heater last replaced?
- Property tax is high relative to price — has the assessment been appealed recently, and will the sale trigger a re-assessment?
- Why hasn't it sold? Are there any deal-killer items the seller is aware of (foundation, flood, title, zoning, code violations)?
- Is there a deadline driving the sale (1031 exchange, divorce, estate, relocation)? That informs how much negotiation room exists.
- Schools are F-rated, which usually means shorter tenancies and higher turnover. Who's the typical renter profile here, and what's been the actual vacancy rate?
- The area grade is low — what's the realistic commute time and amenity access for the typical tenant pool here? Any planned neighborhood developments (good or bad) we should know about?
- What's the average days-on-market for RENTAL listings here right now (not sales)? A rising rental-DOM trend means longer vacancies and softer asking-rent achievability than the comps imply.
- What's the recent tenant-quality profile in this submarket — average credit score on applications, eviction rate, late-payment / NSF rate, and stable-employment percentage? A property-management company in the area should have these aggregated.
- How much new for-sale + rental construction is in the pipeline within 1–3 miles? Heavy new supply typically softens prices + rents 12–24 months out; constrained supply supports both.
Investment metrics
- 1% rule
- 0.98% ✗
- Cap rate
- 4.69%
- Cash-on-cash
- -5.71%
- DSCR
- 0.75
- GRM
- 8.5
CMA / ARV
- ARV (on-the-fly)
- $212,160
- Comps found
- 8
Show comp detail 8 sales within ~0.75 mi
| Address | Dist | Beds/Ba | Sqft | Sold | Price | $/sf | Match |
|---|---|---|---|---|---|---|---|
| 423 N Pleasant Dr | 0.21mi | 3/1.0 (+1) | 1,092 (+0%) | 12mo | $215,000 | $197 | 75 |
| 406 N Park Dr | 0.16mi | 3/2.0 (+1) | 1,091 (+0%) | 13mo | $213,000 | $195 | 72 |
| 817 W Strieff Ln | 0.22mi | 3/1.5 (+1) | 1,118 (+3%) | 10mo | $213,000 | $191 | 70 |
| 308 N Park Dr | 0.06mi | 3/2.0 (+1) | 1,088 (0%) | 22mo | $272,000 | $250 | 70 |
| 808 N Rainbow Dr | 0.17mi | 3/1.5 (+1) | 1,164 (+7%) | 17mo | $194,000 | $167 | 60 |
| 440 W Arquilla Dr | 0.24mi | 3/1.5 (+1) | 1,171 (+8%) | 22mo | $176,000 | $150 | 50 |
| 914 Coach Rd | 0.58mi | 3/1.5 (+1) | 1,197 (+10%) | 0mo | $275,000 | $230 | 49 |
| 139 N Wabash Ave | 0.70mi | 3/1.0 (+1) | 950 (-13%) | 20mo | $166,900 | $176 | 25 |
Match score weights: distance 35% · size 25% · config 20% · recency 20%. Top-matched comps best support the ARV.
Projected returns pro-forma
-3.0% appreciation · 3.0% rent growth · sell at horizon
- IRR
- -25.8%
- Equity multiple
- 0.12×
- Total profit
- $-52,728
- Equity at exit
- $32,042
- IRR
- -21.8%
- Equity multiple
- -0.13×
- Total profit
- $-68,076
- Equity at exit
- $18,581
Cash invested: $60,172 (down + closing). Projections, not guarantees.
Landlord ↔ Tenant lean methodology
- Overall (STATE)
- 43 Moderately Tenant-Leaning
- State Illinois
- 43 Moderately Tenant-Leaning · D+7
- County
- — inherits STATE
- City
- — inherits STATE
ZIP-level market 60425
- Home prices YoY
- -10.6%
- Active inventory
- 53
- Price-to-rent
- 8.5×
Monthly cashflow live
- Estimated rent
- $2,116 medium interval (Pro) →
- Mortgage (P&I)
- −$1,127
- Tax from tax record
- −$741 /mo · $8,894/yr
- Insurance
- −$90
- HOA
- −$0
- Vacancy / Maint / Mgmt
- −$444
- Net cashflow
- $-286
Break-even live
Sensitivity live
| Price | -10% $-165 | -5% $-225 | +0% $-286 | +5% $-347 | +10% $-408 |
|---|---|---|---|---|---|
| Rent | -10% $-453 | -5% $-370 | +0% $-286 | +5% $-203 | +10% $-119 |
| Rate | -1.0pp $-178 | -0.5pp $-232 | base $-286 | +0.5pp $-342 | +1.0pp $-399 |
UW: 25.0% down · 7.5% · 30yr · 1.5% tax · 5.0% vac · 8.0% maint · 8.0% mgmt
Financing live
Cash to close
- Down payment
- $53,725
- Closing costs
- $6,447
- Reserves months
- —
- Total cash needed
- —
Loan-product check · same deal, 3 products live
Conventional
25% down · 7.5% · 30yr
- Down + closing
- —
- Monthly P&I
- —
- Monthly cashflow
- —
- DSCR
- —
- Eligible?
- —
Personal DTI + credit; lowest rate.
DSCR
20% down · 8.5% · 30yr
- Down + closing
- —
- Monthly P&I
- —
- Monthly cashflow
- —
- DSCR
- —
- Eligible?
- —
No personal income docs; deal must DSCR.
Hard money
10% down · 12.0% · 12mo
- Down + closing
- —
- Monthly P&I
- —
- Monthly cashflow
- —
- DSCR
- —
- Eligible?
- —
Short-term bridge; refi at stabilization.
Rent comps 3 comps
| Address | Beds | Baths | Sqft | Rent | $/sqft | DOM | Units | Dist |
|---|---|---|---|---|---|---|---|---|
| 44 N Glenwood Ave Glenwood, IL | 1.0 | 1.0 | 700 | $1,900 | $2.71 | 0d | 1 | 0.58mi |
| 105 S Sycamore Ln Glenwood, IL | 3.0 | 1.5 | 1201 | $2,300 | $1.92 | 3d | 1 | 1.40mi |
| 105 S Sycamore Ln Glenwood, IL | 3.0 | 1.5 | 1201 | $2,300 | $1.92 | 0d | 1 | 1.40mi |
Listing history 50 events
-
2026-06-21days on market $214,900 Active 171 DOM
-
2026-06-18days on market $214,900 Active 168 DOM
-
2026-06-17days on market $214,900 Active 167 DOM
-
2026-06-16days on market $214,900 Active 166 DOM
-
2026-06-15days on market $214,900 Active 165 DOM
-
2026-06-13statusdays on market $214,900 Active 163 DOM
-
2026-06-09days on market $214,900 Contingent - Continue to Show 159 DOM
-
2026-06-08days on market $214,900 Contingent - Continue to Show 158 DOM
-
2026-06-07days on market $214,900 Contingent - Continue to Show 157 DOM
-
2026-06-04days on market $214,900 Contingent - Continue to Show 154 DOM
-
2026-06-03days on market $214,900 Contingent - Continue to Show 153 DOM
-
2026-06-02days on market $214,900 Contingent - Continue to Show 152 DOM
-
2026-06-01days on market $214,900 Contingent - Continue to Show 151 DOM
-
2026-05-31days on market $214,900 Contingent - Continue to Show 150 DOM
-
2026-05-22historical Contingent - Continue to Show
-
2026-03-26price $214,900
-
2026-01-01$240,000 Active
-
2025-12-31historical
-
2025-11-13status Active
-
2025-11-13price
-
2025-09-07historical Contingent - Continue to Show
-
2025-07-25price
-
2025-07-10Active
-
2023-08-23soldstatus $255,000
-
2023-08-16soldstatus $255,000 Closed 402-char remark
Show marketing remark (402 chars)
SPACIOUS AND UPDATED HOME IN GLENWOOD! THIS GREAT HOME FEATURES A XL KITCHEN WITH ISLAND, STAINLESS STEEL APPLIANCES, GRANITE COUNTERS, HARDWOOD FLOORS THROUGHOUT, FULL FINISHED BASEMENT W/ CERAMIC TILE FLOORS, RECESSED LIGHTING, LARGE LAUNDRY ROOM W/ SINK, SPACIOUS YARD W/ REAR PATIO, 2.5 CAR DETACHED GARAGE, EXCELLENT LOCATION NEXT TO THE PARK, SHOPPING AND EXPRESSWAYS. SCHEDULE A VIEWING TODAY!
-
2023-07-14historical Contingent - Continue to Show 402-char remark
Show marketing remark (402 chars)
SPACIOUS AND UPDATED HOME IN GLENWOOD! THIS GREAT HOME FEATURES A XL KITCHEN WITH ISLAND, STAINLESS STEEL APPLIANCES, GRANITE COUNTERS, HARDWOOD FLOORS THROUGHOUT, FULL FINISHED BASEMENT W/ CERAMIC TILE FLOORS, RECESSED LIGHTING, LARGE LAUNDRY ROOM W/ SINK, SPACIOUS YARD W/ REAR PATIO, 2.5 CAR DETACHED GARAGE, EXCELLENT LOCATION NEXT TO THE PARK, SHOPPING AND EXPRESSWAYS. SCHEDULE A VIEWING TODAY!
-
2023-06-26$269,900 Active 402-char remark
Show marketing remark (402 chars)
SPACIOUS AND UPDATED HOME IN GLENWOOD! THIS GREAT HOME FEATURES A XL KITCHEN WITH ISLAND, STAINLESS STEEL APPLIANCES, GRANITE COUNTERS, HARDWOOD FLOORS THROUGHOUT, FULL FINISHED BASEMENT W/ CERAMIC TILE FLOORS, RECESSED LIGHTING, LARGE LAUNDRY ROOM W/ SINK, SPACIOUS YARD W/ REAR PATIO, 2.5 CAR DETACHED GARAGE, EXCELLENT LOCATION NEXT TO THE PARK, SHOPPING AND EXPRESSWAYS. SCHEDULE A VIEWING TODAY!
-
2020-11-16soldstatus $190,000
-
2020-10-19soldstatus $190,000 Closed Sale
-
2020-08-21status Contingent
-
2020-08-04$185,900 New
-
2018-01-22soldstatus $60,000 Closed Sale
-
2017-12-04status Contingent (Do Not Show)
-
2017-11-13$64,900 New
-
2016-05-20status Contingent (Do Not Show)
-
2016-05-19historical
-
2016-05-10price
-
2016-05-06price
-
2016-04-20status Reactivated
-
2016-01-26historical Contingent
-
2016-01-16price
-
2015-12-31price
-
2015-12-19price
-
2015-12-03price
-
2015-11-23New
-
2015-10-26historical
-
2015-10-05price
-
2015-09-15price
-
2015-09-11price
-
2015-09-03price
ⓘ Source: listings_history table (triggers on properties + properties_extension) + one-shot
backfill from property_details.listing_events for pre-trigger history.
Tax reassessment forecast IL · Partial reset (capped growth)
- Current annual tax
- $8,894 · $741/mo
- Projected year-2 tax
- $8,894 · $741/mo
- Expected delta
- $0/yr ($0/mo · 0.0%)
ⓘ Screening estimate from a state-policy table — verify with the county assessor before closing.
Climate risk First Street
- Flood 1/10 Low FEMA zone X (shaded) · 0% chance over 30 yrs
- Wildfire 1/10 Low
- Heat 3/10 Moderate 7 d/yr ≥101°F today · 15 d/yr by 30 yrs out
- Wind 2/10 Low
- Air quality 4/10 Moderate 4 unhealthy d/yr today · 5 by 30 yrs out
Nearby sold comps map
Loading sold comps map…
Walkable amenities ~0.75 mi
Loading nearby amenities…
Taxation est. · year 1
- Rental income
- $25,389
- − Mortgage interest
- −$12,038
- − Property taxes
- −$8,894
- − Insurance
- −$1,074
- − Repairs & maintenance
- −$2,031
- − Management
- −$2,031
- − Depreciation
- −$6,252
- Taxable loss
- −$6,931
- Est. tax savings @ 24.0%
- +$1,663
- After-tax cash flow
- $-1,771/yr
For passive investors: Depreciation is non-cash, so a rental often shows a tax loss while cash-flowing — sheltering income. Rental losses are passive: they offset passive income freely, and up to $25,000/yr can offset ordinary (W-2) income if you actively participate and your MAGI is under $100k (phasing out to $0 by $150k); unused losses carry forward. On sale, claimed depreciation is recaptured at up to 25%, and gains may owe capital-gains tax (a 1031 exchange can defer both). Figures are a year-1 estimate at your 24.0% rate — not tax advice; consult a CPA.
Schools (NCES district)
- District
- Homewood Flossmoor Chsd 233
- NCES district ID
- 1719560
- Math proficiency
- 21% ▼ -15.00%
- Reading proficiency
- 27% ▼ -13.00%
- Median HH income
- $83,564
- Composite
- 24.42/100
- National rank
- #7681
- State rank
- #272 of 620 in IL
Livability — Glenwood
- Score
- 66/100
- State rank
- #545
- US rank
- #11292
Category grades
Schools grade is shown separately in the Schools card above.
Census & demographics
- Census place
- Glenwood, IL
- City population
- 8,730
- Population (ZIP)
- 8,730
Population outlook (Cook County) Hauer SSP2
- Today (2025)
- 5,347,519 people
- By 2030
- 5,357,703 · +0.2%
- By 2040
- 5,324,924 · -0.4%
- By 2050
- 5,230,762 · -2.2%
- By 2075
- 4,785,735 · -10.5%
- By 2100
- 4,188,836 · -21.7%
Race, ethnicity, and origin ACS 2023
- Neighborhood character
- Predominantly Black (68%)
- Race & ethnicity
- Black 68% White 22% Hispanic / Latino 6% Two or more races 4%
- Hispanic origin (detail)
- Mexican 5%
- Common ancestry
- Romanian 3% Iranian 1% Lithuanian 1%
- Foreign-born
- 3% · Canada
- Languages at home
- 95% English-only · Spanish 4%
Political lean MEDSL · Cook
- 2024 margin
- Solid D (+42.0) · D 70.4% · R 28.4% · Other 1.2%
- 2008→2024 swing
- -11.4pp toward R · 2008: 53.4pp · 2024: 42.0pp
- All cycles
- 2024: D+42.0 2020: D+50.3 2016: D+53.0 2012: D+49.4 2008: D+53.4
Not yet ingested
- Civics
- —
Market trends
- HPI YoY
- ▼ -37.24%
- Current HPI
- 314.1777
- Rent YoY
- —
- Metro
- —
- State GDP YoY
- ▲ 1.59%
- F500 in state
- 60
Industry mix (Fortune 500 HQ in IL)
| Industry | F500 HQs | Revenue |
|---|---|---|
| Insurance | 4 | $201B |
|
||
| Consumer Goods | 4 | $87B |
|
||
| Industrial Machinery | 3 | $64B |
|
||
| Healthcare | 2 | $55B |
|
||
| Retail / Pharmacy | 1 | $148B |
|
||
| Agriculture / Food | 1 | $86B |
|
||
Price history
+95.4% since first listed40 events — show timeline
- 2026-05-22 Contingent — MRED as Distributed by MLS Grid
- 2026-03-26 Price Changed $214,900 MRED as Distributed by MLS Grid
- 2026-01-01 Listed $240,000 MRED as Distributed by MLS Grid
- 2025-12-31 Listing Removed — MRED as Distributed by MLS Grid
- 2025-11-13 Relisted — MRED as Distributed by MLS Grid
- 2025-11-13 Price Changed — MRED as Distributed by MLS Grid
- 2025-09-07 Contingent — MRED as Distributed by MLS Grid
- 2025-07-25 Price Changed — MRED as Distributed by MLS Grid
- 2025-07-10 Listed — MRED as Distributed by MLS Grid
- 2023-08-23 Sold (Public Records) $255,000 Public Records
- 2023-08-16 Sold (MLS) $255,000 MRED as Distributed by MLS Grid
- 2023-07-14 Contingent — MRED as Distributed by MLS Grid
- 2023-06-26 Listed $269,900 MRED as Distributed by MLS Grid
- 2020-11-16 Sold (Public Records) $190,000 Public Records
- 2020-10-19 Sold (MLS) $190,000 MRED as Distributed by MLS Grid
- 2020-08-21 Pending — MRED as Distributed by MLS Grid
- 2020-08-04 Listed $185,900 MRED as Distributed by MLS Grid
- 2018-01-22 Sold (MLS) $60,000 MRED as Distributed by MLS Grid
- 2017-12-04 Pending — MRED as Distributed by MLS Grid
- 2017-11-13 Listed $64,900 MRED as Distributed by MLS Grid
- 2016-05-20 Pending — MRED as Distributed by MLS Grid
- 2016-05-19 Listing Removed — MRED as Distributed by MLS Grid
- 2016-05-10 Price Changed — MRED as Distributed by MLS Grid
- 2016-05-06 Price Changed — MRED as Distributed by MLS Grid
- 2016-04-20 Relisted — MRED as Distributed by MLS Grid
- 2016-01-26 Contingent — MRED as Distributed by MLS Grid
- 2016-01-16 Price Changed — MRED as Distributed by MLS Grid
- 2015-12-31 Price Changed — MRED as Distributed by MLS Grid
- 2015-12-19 Price Changed — MRED as Distributed by MLS Grid
- 2015-12-03 Price Changed — MRED as Distributed by MLS Grid
- 2015-11-23 Listed — MRED as Distributed by MLS Grid
- 2015-10-26 Listing Removed — MRED as Distributed by MLS Grid
- 2015-10-05 Price Changed — MRED as Distributed by MLS Grid
- 2015-09-15 Price Changed — MRED as Distributed by MLS Grid
- 2015-09-11 Price Changed — MRED as Distributed by MLS Grid
- 2015-09-03 Price Changed — MRED as Distributed by MLS Grid
- 2015-08-30 Price Changed — MRED as Distributed by MLS Grid
- 2015-08-26 Price Changed — MRED as Distributed by MLS Grid
- 2015-06-26 Listed — MRED as Distributed by MLS Grid
- 2000-08-21 Sold (Public Records) $110,000 Public Records
Property tax history
+6.0%/yrLatest (2023): $8,894 · +27.5% YoY. Source: county tax records.
Cash-flow waterfall
monthlySold comps — $/sqft
last 12 mo · ≤1 miLoading sold comps…