3601 E Wyoming Ave #268 · Sunrise Manor, NV
Flood risk No data
- FEMA flood zone
- —
- Chance of flooding over 30 yrs
- —
- Est. flood insurance / yr
- —
Fire risk No data
- Est. fire insurance / yr
- —
Heat risk 8/10 · Major
- Hot days now (above threshold)
- 5 days/yr
- Hot days in 30 yrs
- 12 days/yr
Wind risk No data
- Chance of severe wind over 30 yrs
- —
Air-quality risk 4/10 · Minor
- Unhealthy air days now
- 4 days/yr
- Unhealthy air days in 30 yrs
- 5 days/yr
Risk factors via First Street. Map © Google.
Why this score? — see what drove the D grade
The composite is a weighted blend of 9 inputs, each scored 0–100. Each bar is that input's sub-score; the figure is the points it added to the 100-point composite (weight × sub-score).
- Cash flow +15.0/30.0
- ARV discount +7.5/15.0
- 1% rule +5.0/10.0
- DSCR +5.0/10.0
- Livability +2.9/5.0
- Rent growth +2.8/5.0
- Schools +2.6/10.0
- Condition / age +2.5/5.0
- Appreciation +0.0/10.0
$10,000
🖨 Deal sheet 📄 Offer letter ✓ Due diligence
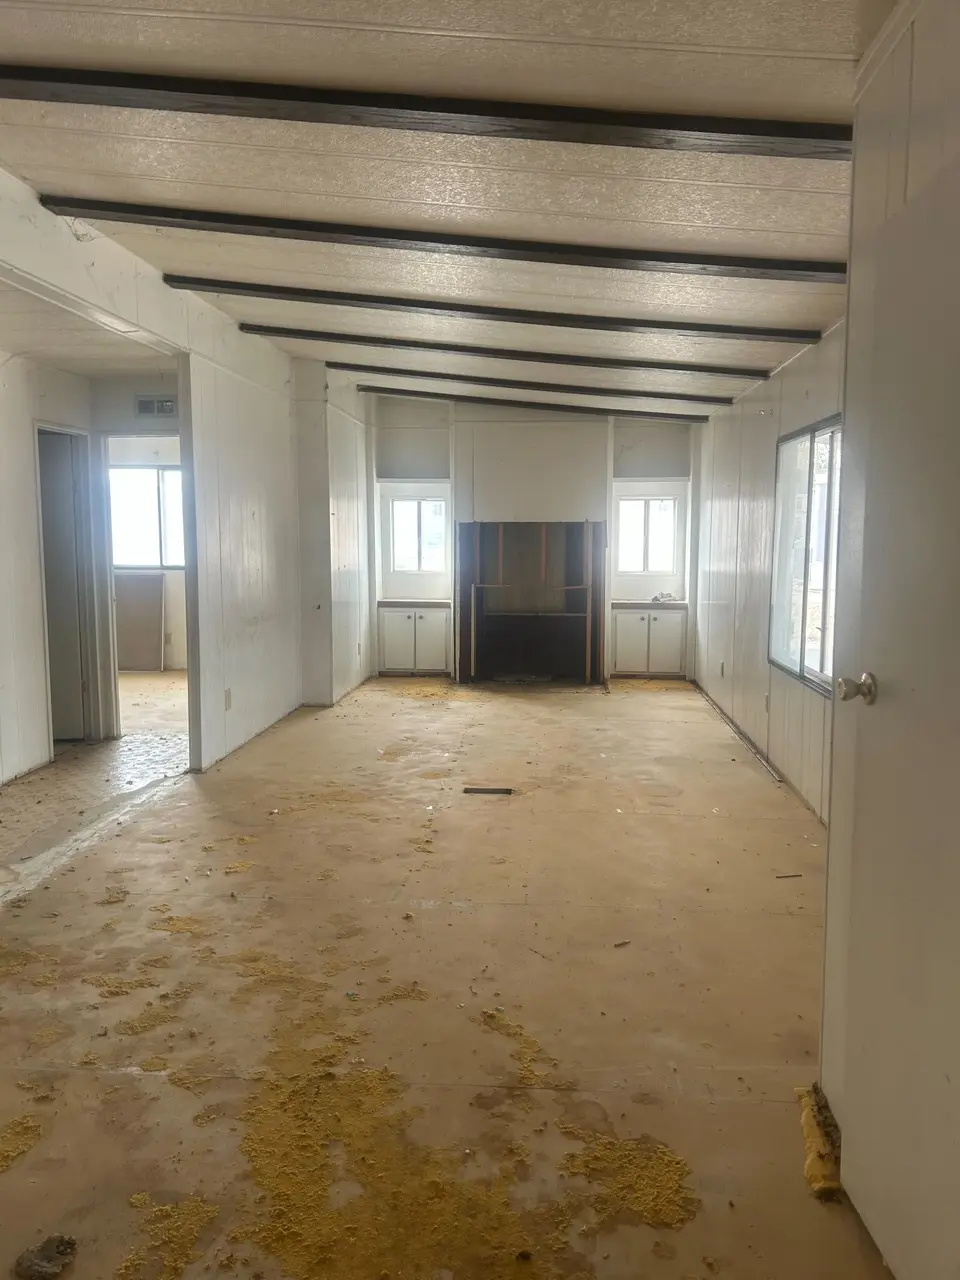
Listing remarks
This is the ultimate opportunity for the DIY-minded buyer or savvy investor. Ready for a complete custom renovation, this home offers incredible potential.
Key facts
- Built 2026
- Listed 22 days
Property features AI
Finance
- Other: Spec inventory (new construction)
- Financial info: List price $10,000
Exterior
- Home design: Single-section home; 2 bed, 2 bath plan
- Exterior features: Located at 3601 E Wyoming Ave #268, Las Vegas, NV 89104
Interior
- Bedrooms: 2 bedrooms
- Bathrooms: 2 bathrooms
- Interior features: Dishwasher; Disposal; Refrigerator
Neighborhood map
What this means for you Summary
Snapshot
- This is a 2-bed/2.0-bath single-family listed at $10k.
Deal economics
- At list price, monthly cash flow is $1k ($14k/yr) — positive.
- The deal already cash-flows at list — no discount required.
- Meets the 1% rule at list price ($2k rent vs $10k).
- Recommended offer: $10k (1.5% below list) — sets the bar for market timing.
Location & tenants
- Location reads 58/100 on livability (#83 in NV) — a working-class tenant base; expect higher turnover. Strengths: cost of living A+, housing A+; Watch: employment D, schools F, crime F.
- Clark County School District (urban): math 21% / reading 39% proficiency, ranked #11 of 17 in NV (top 65%) — families likely to look elsewhere, expect single-tenant / working-renter base with shorter leases.
- Market conditions: Rents rising (+1.2%/yr); 145 active listings in the ZIP; 40 comparable units currently listed for rent nearby; rentals at typical pace (median 24d on market — plan ~3-4 weeks tenant-placement turnaround); 14,754 units permitted in Clark County in 2024 (2,301 in 5+ unit buildings).
- This rent runs 36% of the median local income ($52k/yr) — at the standard rent-burdened threshold; future hikes will face affordability resistance.
Forward outlook
- Local home prices are declining (-3.0%/yr); year-one equity from $69 of loan paydown is wiped out by about $300 of value loss. Plan a longer hold.
- Clark County population projected at +36% by 2050 — long-run rental-demand tailwind backs the buy-and-hold thesis.
- At projected returns (-3.0% appreciation + 1.2% rent growth), your $3k cash investment doubles in ~1 year — after that, you're playing with house money.
Negotiation context
- It's been on market 22 days — a 2% lower offer ($10k) is reasonable based on typical stale-listing flexibility.
Risks & watch-outs
- Climate carrying-cost: extreme-heat days projected 5→12/yr by 2055 (HVAC capex compounding) — expect insurance premiums to compound above CPI over the hold.
Questions for the listing agent
- Is there a deadline driving the sale (1031 exchange, divorce, estate, relocation)? That informs how much negotiation room exists.
- Schools are F-rated, which usually means shorter tenancies and higher turnover. Who's the typical renter profile here, and what's been the actual vacancy rate?
- Crime grade is F in this area — have there been break-ins, vandalism, or insurance claims at this property in the last 3 years? What carrier currently insures it and at what premium?
- The area grade is low — what's the realistic commute time and amenity access for the typical tenant pool here? Any planned neighborhood developments (good or bad) we should know about?
- What's the average days-on-market for RENTAL listings here right now (not sales)? A rising rental-DOM trend means longer vacancies and softer asking-rent achievability than the comps imply.
- What's the recent tenant-quality profile in this submarket — average credit score on applications, eviction rate, late-payment / NSF rate, and stable-employment percentage? A property-management company in the area should have these aggregated.
- How much new for-sale + rental construction is in the pipeline within 1–3 miles? Heavy new supply typically softens prices + rents 12–24 months out; constrained supply supports both.
Investment metrics
- 1% rule
- 15.59% ✓
- Cap rate
- 145.80%
- Cash-on-cash
- 498.24%
- DSCR
- 23.17
- GRM
- 0.5
CMA / ARV
No comps found within radius.
Projected returns pro-forma
-3.0% appreciation · 1.18% rent growth · sell at horizon
- IRR
- —
- Equity multiple
- 25.87×
- Total profit
- $69,643
- Equity at exit
- $1,491
- IRR
- —
- Equity multiple
- 52.78×
- Total profit
- $144,989
- Equity at exit
- $865
Cash invested: $2,800 (down + closing). Projections, not guarantees.
Landlord ↔ Tenant lean methodology
- Overall (STATE)
- 71 Landlord-Friendly
- State Nevada
- 71 Landlord-Friendly · R+1
- County
- — inherits STATE
- City
- — inherits STATE
ZIP-level market 89104
- Rents YoY
- 1.2%
- Active inventory
- 145
- Price-to-rent
- 0.5×
Monthly cashflow live
- Estimated rent
- $1,559 high interval (Pro) →
- Mortgage (P&I)
- −$52
- Tax est. 1.5%
- −$12 /mo · $150/yr
- Insurance
- −$4
- HOA
- −$0
- Vacancy / Maint / Mgmt
- −$327
- Net cashflow
- $1,163
Break-even live
UW: 25.0% down · 7.5% · 30yr · 1.5% tax · 5.0% vac · 8.0% maint · 8.0% mgmt
Financing live
Cash to close
- Down payment
- $2,500
- Closing costs
- $300
- Reserves months
- —
- Total cash needed
- —
Loan-product check · same deal, 3 products live
Conventional
25% down · 7.5% · 30yr
- Down + closing
- —
- Monthly P&I
- —
- Monthly cashflow
- —
- DSCR
- —
- Eligible?
- —
Personal DTI + credit; lowest rate.
DSCR
20% down · 8.5% · 30yr
- Down + closing
- —
- Monthly P&I
- —
- Monthly cashflow
- —
- DSCR
- —
- Eligible?
- —
No personal income docs; deal must DSCR.
Hard money
10% down · 12.0% · 12mo
- Down + closing
- —
- Monthly P&I
- —
- Monthly cashflow
- —
- DSCR
- —
- Eligible?
- —
Short-term bridge; refi at stabilization.
Rent comps 40 comps
| Address | Beds | Baths | Sqft | Rent | $/sqft | DOM | Units | Dist |
|---|---|---|---|---|---|---|---|---|
| 3601 E Wyoming Ave Spc 526 Las Vegas, NV | 3.0 | 2.0 | 1344 | $1,999 | $1.49 | 43d | 1 | 0.02mi |
| 3601 E Wyoming Ave Unit 236 Las Vegas, NV | 2.0 | 2.0 | 924 | $1,399 | $1.51 | 11d | 1 | 0.02mi |
| 3601 E Wyoming Ave Unit 46 Las Vegas, NV | 2.0 | 2.0 | 960 | $1,749 | $1.82 | 43d | 1 | 0.02mi |
| 3601 E Wyoming Ave Unit 411 Las Vegas, NV | 2.0 | 2.0 | 896 | $1,729 | $1.93 | 43d | 1 | 0.02mi |
| 3655 E Sahara Ave Las Vegas, NV | 1.0–2.0 | 1.0 | 775 | $1,260 | $1.63 | 23d | 10 | 0.39mi |
| 3669 Waikiki Ave Las Vegas, NV | 3.0 | 2.0 | 1300 | $1,568 | $1.21 | 23d | 1 | 0.40mi |
| 1150 June Ave Las Vegas, NV | 3.0 | 2.0 | 1096 | $2,800 | $2.55 | 43d | 1 | 0.40mi |
| 1755 Palm St Las Vegas, NV | 1.0–2.0 | 1.0 | 775 | $1,356 | $1.75 | 2d | 10 | 0.41mi |
| 1118 Laurel Ave Unit 1 Las Vegas, NV | 1.0 | 1.0 | 1820 | $850 | $0.47 | 23d | 1 | 0.50mi |
| 2398 Swifton Ct Las Vegas, NV | 3.0 | 2.0 | 1564 | $1,945 | $1.24 | 7d | 1 | 0.52mi |
| 2398 Swifton Ct Unit N/A Las Vegas, NV | 3.0 | 2.5 | 1564 | $1,945 | $1.24 | 7d | 1 | 0.52mi |
| 3411 Center Dr Las Vegas, NV | 2.0 | 2.0 | 1037 | $1,225 | $1.18 | 23d | 1 | 0.52mi |
| 3411 Center Dr Unit A Las Vegas, NV | 2.0 | 2.0 | 1034 | $1,225 | $1.18 | 20d | 1 | 0.52mi |
| 2627 S Lamb Blvd #81 Las Vegas, NV | 2.0 | 2.0 | 1056 | $1,939 | $1.84 | 43d | 1 | 0.68mi |
| 2627 S Lamb Blvd #233 Las Vegas, NV | 2.0 | 1.0 | 896 | $1,669 | $1.86 | 43d | 1 | 0.68mi |
| 2639 Jacyra Ave Las Vegas, NV | 3.0 | 2.5 | 1550 | $1,840 | $1.19 | 10d | 1 | 0.71mi |
| 53 Maya St Las Vegas, NV | 3.0 | 1.0 | 1018 | $1,695 | $1.67 | 43d | 1 | 0.72mi |
| 2627 S Lamb Blvd #141 Las Vegas, NV | 3.0 | 2.0 | 1344 | $1,899 | $1.41 | 43d | 1 | 0.78mi |
| 2800 Fremont St Las Vegas, NV | 2.0 | 1.0–2.0 | 771 | $1,660 | $2.15 | 3d | 11 | 1.01mi |
| 426 Greenbriar Townhouse Way Las Vegas, NV | 2.0 | 1.5 | 1320 | $1,595 | $1.21 | 43d | 1 | 1.04mi |
| 2938 E Karen Ave Unit 3 Las Vegas, NV | 2.0 | 1.5 | 1200 | $1,325 | $1.10 | 7d | 1 | 1.11mi |
| 2938 Karen Ave Unit 1 Las Vegas, NV | 3.0 | 2.0 | 1450 | $1,275 | $0.88 | 7d | 1 | 1.11mi |
| 656 Greenbriar Townhouse Way Las Vegas, NV | 2.0 | 2.5 | 1320 | $1,600 | $1.21 | 43d | 1 | 1.11mi |
| 343 Greenbriar Townhouse Way Las Vegas, NV | 1.0 | 1.5 | 1320 | $1,560 | $1.18 | 43d | 1 | 1.12mi |
| 641 E Pecos Way Unit 1 Las Vegas, NV | 2.0 | 2.5 | 1320 | $1,550 | $1.17 | 7d | 1 | 1.13mi |
| 277 N Lamb Blvd Unit C Las Vegas, NV | 2.0 | 2.0 | 978 | $1,100 | $1.12 | 2d | 1 | 1.14mi |
| 277 N Lamb Blvd Las Vegas, NV | 2.0 | 2.0 | 978 | $1,195 | $1.22 | 12d | 1 | 1.14mi |
| 210 Greenbriar Townhouse Way Las Vegas, NV | 2.0 | 2.5 | 1320 | $1,550 | $1.17 | 43d | 1 | 1.18mi |
| 4450 Karen Ave Las Vegas, NV | 2.0 | 2.0 | 975 | $1,432 | $1.47 | 7d | 11 | 1.20mi |
| 157 Pecos Way Las Vegas, NV | 2.0 | 1.5 | 1320 | $1,400 | $1.06 | 23d | 1 | 1.22mi |
| 259 N Lamb Blvd Unit A Las Vegas, NV | 2.0 | 2.0 | 984 | $1,285 | $1.31 | 7d | 1 | 1.22mi |
| 2137 E Saint Louis Ave Las Vegas, NV | 3.0 | 1.0 | 1028 | $1,700 | $1.65 | 43d | 1 | 1.22mi |
| 2898 Pacific Ave Unit N/A Las Vegas, NV | 3.0 | 2.0 | 1464 | $2,000 | $1.37 | 20d | 1 | 1.24mi |
| 4555 E Sahara Ave Las Vegas, NV | 2.0 | 2.0 | 1073 | $1,175 | $1.10 | 43d | 4 | 1.24mi |
| 4555 E Sahara Ave Las Vegas, NV | 2.0 | 2.0 | 1073 | $1,188 | $1.11 | 23d | 3 | 1.24mi |
| 76 N 27th St Unit B Las Vegas, NV | 2.0 | 2.0 | 1088 | $1,150 | $1.06 | 11d | 1 | 1.25mi |
| 4555 E Sahara Ave #284 Las Vegas, NV | 2.0 | 2.0 | 1073 | $1,250 | $1.16 | 7d | 1 | 1.25mi |
| 4417 Berkley Ave Las Vegas, NV | 3.0 | 2.0 | 1296 | $1,650 | $1.27 | 23d | 1 | 1.28mi |
| 2937 Stewart Ave Unit 1 Las Vegas, NV | 2.0 | 2.0 | 970 | $950 | $0.98 | 43d | 1 | 1.28mi |
| 4550 Karen Ave Las Vegas, NV | 2.0–3.0 | 1.0–2.0 | 988 | $1,215 | $1.23 | 15d | 11 | 1.29mi |
Listing history 12 events
-
2026-06-18days on market $10,000 Active 22 DOM
-
2026-06-17days on market $10,000 Active 21 DOM
-
2026-06-16days on market $10,000 Active 20 DOM
-
2026-06-15days on market $10,000 Active 19 DOM
-
2026-06-13days on market $10,000 Active 17 DOM
-
2026-06-09days on market $10,000 Active 13 DOM
-
2026-06-08days on market $10,000 Active 12 DOM
-
2026-06-08days on market $10,000 Active 11 DOM
-
2026-06-03days on market $10,000 Active 7 DOM
-
2026-06-02days on market $10,000 Active 6 DOM
-
2026-06-01days on market $10,000 Active 5 DOM
-
2026-05-31days on market $10,000 Active 4 DOM
ⓘ Source: listings_history table (triggers on properties + properties_extension) + one-shot
backfill from property_details.listing_events for pre-trigger history.
Climate risk First Street
- Heat 8/10 Severe
- Air quality 4/10 Moderate 4 unhealthy d/yr today · 5 by 30 yrs out
Nearby sold comps map
Loading sold comps map…
Walkable amenities ~0.75 mi
Loading nearby amenities…
Taxation est. · year 1
- Rental income
- $18,709
- − Mortgage interest
- −$560
- − Property taxes
- −$150
- − Insurance
- −$50
- − Repairs & maintenance
- −$1,497
- − Management
- −$1,497
- − Depreciation
- −$291
- Taxable income
- $14,664
- Est. tax owed @ 24.0%
- −$3,519
- After-tax cash flow
- $10,431/yr
For passive investors: Depreciation is non-cash, so a rental often shows a tax loss while cash-flowing — sheltering income. Rental losses are passive: they offset passive income freely, and up to $25,000/yr can offset ordinary (W-2) income if you actively participate and your MAGI is under $100k (phasing out to $0 by $150k); unused losses carry forward. On sale, claimed depreciation is recaptured at up to 25%, and gains may owe capital-gains tax (a 1031 exchange can defer both). Figures are a year-1 estimate at your 24.0% rate — not tax advice; consult a CPA.
Schools (NCES district)
- District
- Clark County School District
- NCES district ID
- 3200060
- Math proficiency
- 21% ▼ -13.00%
- Reading proficiency
- 39% ▼ -8.00%
- Median HH income
- $53,611
- Composite
- 26.48/100
- National rank
- #7211
- State rank
- #11 of 17 in NV
Livability — Sunrise Manor
- Score
- 58/100
- State rank
- #83
- US rank
- #20692
Category grades
Schools grade is shown separately in the Schools card above.
Census & demographics
- Census place
- Sunrise Manor, NV
- County
- Clark County · 2,306,105 people
- City population
- 102,557
- Metro
- Las Vegas-Henderson-Paradise, NV
- Population (ZIP)
- 39,937
- Household income
- $52,228
- Rent vs Own
- Severe rent burden
- 2715.0
Population outlook (Clark County) Hauer SSP2
- Today (2025)
- 2,504,101 people
- By 2030
- 2,693,770 · +7.6%
- By 2040
- 3,061,208 · +22.2%
- By 2050
- 3,400,072 · +35.8%
- By 2075
- 4,139,522 · +65.3%
- By 2100
- 4,596,916 · +83.6%
Race, ethnicity, and origin ACS 2023
- Neighborhood character
- Diverse neighborhood (Simpson 0.60)
- Race & ethnicity
- Hispanic / Latino 59% White 21% Two or more races 19% Black 9% Asian 5% Native American 4%
- Hispanic origin (detail)
- Mexican 45% Cuban 5%
- Common ancestry
- Lithuanian 1% Romanian 1% Slovak 1%
- Foreign-born
- 32% · Canada, South Korea, Jamaica
- Languages at home
- 45% English-only · Spanish 48% Tagalog/Filipino 3% Other Asian/Pacific 1%
Political lean MEDSL · Clark
- 2024 margin
- Toss-up / Even · D 50.4% · R 47.8% · Other 1.7%
- 2008→2024 swing
- -16.5pp toward R · 2008: 19.1pp · 2024: 2.6pp
- All cycles
- 2024: D+2.6 2020: D+9.3 2016: D+10.7 2012: D+14.5 2008: D+19.1
Not yet ingested
- Civics
- —
Market trends
- HPI YoY
- ▼ -262.16%
- Current HPI
- 305.4172
- Rent YoY
- ▲ 1.18%
- Metro
- Las Vegas-Henderson-Paradise, NV
- State GDP YoY
- ▲ 3.08%
- F500 in state
- 6
Industry mix (Fortune 500 HQ in NV)
| Industry | F500 HQs | Revenue |
|---|---|---|
| Hotels / Casinos | 3 | $36B |
|
||
Cash-flow waterfall
monthlySold comps — $/sqft
last 12 mo · ≤1 miLoading sold comps…