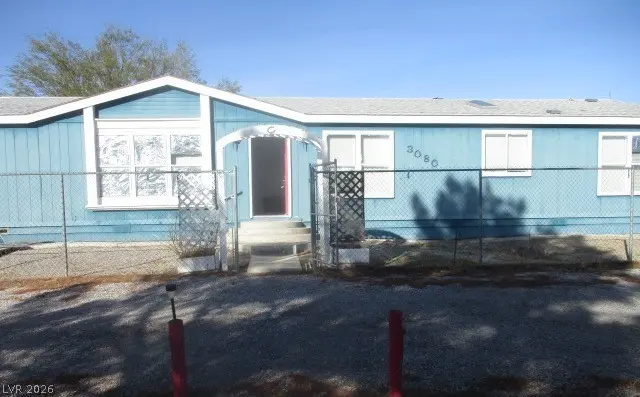
3080 W Hardy Ln · Pahrump, NV
Flood risk 1/10 · Minimal
- FEMA flood zone
- X (shaded)
- Chance of flooding over 30 yrs
- 0.0%
- Est. flood insurance / yr
- $507 – $1,088
Fire risk 3/10 · Minor
- Est. fire insurance / yr
- $490 – $910
Heat risk 7/10 · Major
- Hot days now (above 103°F)
- 7 days/yr
- Hot days in 30 yrs
- 18 days/yr
Wind risk 1/10 · Minimal
- Chance of severe wind over 30 yrs
- —
Air-quality risk 1/10 · Minimal
- Unhealthy air days now
- 0 days/yr
- Unhealthy air days in 30 yrs
- 0 days/yr
Risk factors via First Street. Map © Google.
Why this score? — see what drove the D- grade
The composite is a weighted blend of 9 inputs, each scored 0–100. Each bar is that input's sub-score; the figure is the points it added to the 100-point composite (weight × sub-score).
- ARV discount +12.9/15.0
- Cash flow +10.6/30.0
- Livability +3.4/5.0
- Rent growth +3.2/5.0
- DSCR +3.0/10.0
- Condition / age +2.5/5.0
- Schools +2.2/10.0
- 1% rule +2.1/10.0
- Appreciation +0.0/10.0
$229,000
🖨 Deal sheet (PDF) 📄 Offer letter ✓ Due diligence
Listing remarks
This spacious 3-bedroom, 2-bath home sits on just under an acre and offers a wonderful blend of comfort, privacy, and potential, complete with its own private well. A partially fenced front yard, fully fenced backyard, and a barn/shed provide plenty of room for hobbies, storage, and outdoor living, while the circular front driveway provides easy access and ample parking, adding to the property's overall appeal. Inside, the bright kitchen features an oven, center island, and breakfast nook that flows into an oversized family room anchored by a cozy wood-burning fireplace. Seller has already completed the costly and important task of professionally leveling the home, providing added value an
Key facts
- Bright kitchen
- Barn shed
- Private well
Tags
Property features AI
Finance
- Other: Horses allowed on the property
Exterior
- Parking: Open parking
- Utilities: Electricity available; Photovoltaics none; Private well water; Septic system (septic tank)
- Home design: Single-story residence; Faces south; Single family zoning; Resale property (listed as fixer)
- Construction: Composition/shingle roof; Mobile home dimensions approximately 66' by 27'
- Exterior features: Private yard; Circular driveway; Enclosed patio; Patio; Back yard chain link fencing; Desert landscaping; Landscaped
Interior
- Kitchen: Island; Laminate countertops; Linoleum/vinyl flooring; Built-in electric oven; Refrigerator
- Bedrooms: Three possible bedrooms; Primary bedroom downstairs with walk-in closet and ceiling light; Two additional bedrooms with closets (both approx. 10x11)
- Flooring: Carpet; Linoleum; Vinyl
- Bathrooms: Two full bathrooms
- Heating & cooling: Central heating (electric); Central air conditioning (electric)
- Interior features: Blinds and window treatments; Skylights; Ceiling fan(s); Primary bedroom on the downstairs level; Bedroom on main level; Unfurnished
- Laundry & utility: Electric dryer hookup on the main level
Neighborhood map
What this means for you Summary
Snapshot
- This is a 3-bed/2.0-bath manufactured listed at $229k.
Deal economics
- At list price, monthly cash flow is $-115 ($-1k/yr) — negative.
- To cash-flow at today's rent, offer at most $209k (8.8% below list).
- To meet the 1% rule (rent ≥ 1% of price), the offer needs to be $162k (29.3% below list).
- Recommended offer: $162k (29.3% below list) — sets the bar for 1% rule.
- Cap rate 5.7% vs local median 3.4% in Pahrump — top-decile yield for the area; either an underpriced asset or a hidden risk that comps aren't pricing in. Stress-test before assuming the spread holds.
Location & tenants
- Location reads 68/100 on livability (#30 in NV) — a middle-class / working-renter tenant base. Strengths: cost of living A+, housing A+, health & safety A+; Watch: employment D, crime F, amenities F.
- Nye County School District (rural): math 20% / reading 33% proficiency, ranked #16 of 17 in NV (top 94%) — low school quality limits family demand, transient renter base, plan for 1-2y turnover.
- Zoned schools: J G Johnson Elementary School (math 12% / reading 27%, grade F, #290 of 402 statewide, top 75%, 518 students, 100% FRL); Rosemary Clarke Middle School (math 20% / reading 31%, grade F, #62 of 109 statewide, top 58%, 1,060 students, 100% FRL); Pahrump Valley High School (math 14% / reading 41%, grade F, #74 of 131 statewide, top 56%, 1,362 students, 100% FRL) — zoned schools average 100% FRL vs 54% district-wide (46 pts higher); higher-poverty schools than district average — tighter screening recommended.
- Market conditions: Rents rising (+2.7%/yr); 1116 active listings in the ZIP; 2 comparable units currently listed for rent nearby.
- This rent runs 32% of the median local income ($61k/yr) — at the standard rent-burdened threshold; future hikes will face affordability resistance.
Forward outlook
- Local home prices are declining (-3.0%/yr); year-one equity from $2k of loan paydown is wiped out by about $7k of value loss. Plan a longer hold.
- Nye County population projected at -28% by 2050 — secular population decline; favor cash flow + early exit over multi-decade hold.
Negotiation context
- It's been on market 58 days — a 3% lower offer ($222k) is reasonable based on typical stale-listing flexibility.
- 3 sale attempts since 3y ago with the ask held roughly flat each time — persistent listings suggest the price (not the market) is what's stuck; bring a comps-based counter.
- Current owner paid $132k; list at $229k implies a 73% gain — meaningful room to come down on a strong offer.
Risks & watch-outs
- Climate carrying-cost: extreme-heat days projected 7→18/yr by 2055 (HVAC capex compounding) — expect insurance premiums to compound above CPI over the hold.
Questions for the listing agent
- What do current leases actually rent for vs. the listed asking? Can we see a recent rent roll and the last 12 months of T-12 income?
- It's been on market 58 days. Have you received any prior offers? Is the seller open to a 29% concession, seller financing, or rate buy-down credit?
- Is there a deadline driving the sale (1031 exchange, divorce, estate, relocation)? That informs how much negotiation room exists.
- Schools are F-rated, which usually means shorter tenancies and higher turnover. Who's the typical renter profile here, and what's been the actual vacancy rate?
- Crime grade is F in this area — have there been break-ins, vandalism, or insurance claims at this property in the last 3 years? What carrier currently insures it and at what premium?
- The area grade is low — what's the realistic commute time and amenity access for the typical tenant pool here? Any planned neighborhood developments (good or bad) we should know about?
- What's the average days-on-market for RENTAL listings here right now (not sales)? A rising rental-DOM trend means longer vacancies and softer asking-rent achievability than the comps imply.
- What's the recent tenant-quality profile in this submarket — average credit score on applications, eviction rate, late-payment / NSF rate, and stable-employment percentage? A property-management company in the area should have these aggregated.
- How much new for-sale + rental construction is in the pipeline within 1–3 miles? Heavy new supply typically softens prices + rents 12–24 months out; constrained supply supports both.
Investment metrics
- 1% rule
- 0.71% ✗
- Cap rate
- 5.69%
- Cash-on-cash
- -2.15%
- DSCR
- 0.90
- GRM
- 11.8
CMA / ARV
- ARV (median comp)
- $260,000
- List price
- $229,000
- Delta
- -11.92%
- Verdict
- UNDERPRICED
- Comps
- 17 within 1.0 mi
Show comp detail 8 sales within ~0.75 mi
| Address | Dist | Beds/Ba | Sqft | Sold | Price | $/sf | Match |
|---|---|---|---|---|---|---|---|
| 3051 W Medicine Man Rd | 0.16mi | 4/2.0 (+1) | 1,782 (+0%) | 15mo | $355,000 | $199 | 75 |
| 2761 W Medicine Man Rd | 0.35mi | 3/2.0 | 1,844 (+4%) | 8mo | $290,000 | $157 | 71 |
| 3290 W Medicine Man Rd | 0.30mi | 3/2.0 | 1,568 (-12%) | 0mo | $257,000 | $164 | 66 |
| 3451 Shelly Ln | 0.45mi | 3/2.0 | 1,647 (-7%) | 14mo | $350,000 | $213 | 55 |
| 574 S Barney St | 0.31mi | 3/2.0 | 1,588 (-11%) | 16mo | $345,000 | $217 | 54 |
| 2791 Rio Rico Dr #4 | 0.72mi | 3/2.0 | 1,702 (-4%) | 13mo | $265,000 | $156 | 48 |
| 611 S Woodchips Rd | 0.63mi | 3/2.5 | 1,530 (-14%) | 2mo | $170,000 | $111 | 43 |
| 2730 W Medicine Man Rd | 0.40mi | 2/2.0 (-1) | 1,963 (+10%) | 22mo | $259,900 | $132 | 41 |
Match score weights: distance 35% · size 25% · config 20% · recency 20%. Top-matched comps best support the ARV.
Projected returns pro-forma
-3.0% appreciation · 2.73% rent growth · sell at horizon
- IRR
- -20.2%
- Equity multiple
- 0.30×
- Total profit
- $-44,941
- Equity at exit
- $34,145
- IRR
- -13.8%
- Equity multiple
- 0.21×
- Total profit
- $-50,700
- Equity at exit
- $19,800
Cash invested: $64,120 (down + closing). Projections, not guarantees.
Landlord ↔ Tenant lean methodology
- Overall (STATE)
- 71 Landlord-Friendly
- State Nevada
- 71 Landlord-Friendly · R+1
- County
- — inherits STATE
- City
- — inherits STATE
ZIP-level market 89048
- Home prices YoY
- -7.2%
- Rents YoY
- 2.7%
- Active inventory
- 1116
- Price-to-rent
- 11.8×
Monthly cashflow live
- Estimated rent
- $1,620 medium interval (Pro) →
- Mortgage (P&I)
- −$1,201
- Tax from tax record
- −$98 /mo · $1,173/yr
- Insurance
- −$95
- HOA
- −$0
- Vacancy / Maint / Mgmt
- −$340
- Net cashflow
- $-115
Break-even live
Sensitivity live
| Price | -10% $15 | -5% $-50 | +0% $-115 | +5% $-179 | +10% $-244 |
|---|---|---|---|---|---|
| Rent | -10% $-243 | -5% $-179 | +0% $-115 | +5% $-51 | +10% $13 |
| Rate | -1.0pp $1 | -0.5pp $-56 | base $-115 | +0.5pp $-174 | +1.0pp $-234 |
UW: 25.0% down · 7.5% · 30yr · 1.5% tax · 5.0% vac · 8.0% maint · 8.0% mgmt
Financing live
Cash to close
- Down payment
- $57,250
- Closing costs
- $6,870
- Reserves months
- —
- Total cash needed
- —
Loan-product check · same deal, 3 products live
Conventional
25% down · 7.5% · 30yr
- Down + closing
- —
- Monthly P&I
- —
- Monthly cashflow
- —
- DSCR
- —
- Eligible?
- —
Personal DTI + credit; lowest rate.
DSCR
20% down · 8.5% · 30yr
- Down + closing
- —
- Monthly P&I
- —
- Monthly cashflow
- —
- DSCR
- —
- Eligible?
- —
No personal income docs; deal must DSCR.
Hard money
10% down · 12.0% · 12mo
- Down + closing
- —
- Monthly P&I
- —
- Monthly cashflow
- —
- DSCR
- —
- Eligible?
- —
Short-term bridge; refi at stabilization.
Rent comps 2 comps
| Address | Beds | Baths | Sqft | Rent | $/sqft | DOM | Units | Dist |
|---|---|---|---|---|---|---|---|---|
| 2770 Rio Rico Dr Pahrump, NV | 3.0 | 3.0 | 1236 | $1,435 | $1.16 | 45d | 1 | 0.72mi |
| 1860 W Wilson Rd Pahrump, NV | 3.0 | 2.0 | 1440 | $1,690 | $1.17 | 45d | 1 | 1.24mi |
Listing history 21 events
-
2026-06-19days on market $229,000 Active 58 DOM
-
2026-06-18days on market $229,000 Active 57 DOM
-
2026-06-17days on market $229,000 Active 56 DOM
-
2026-06-16days on market $229,000 Active 55 DOM
-
2026-06-15days on market $229,000 Active 54 DOM
-
2026-06-14days on market $229,000 Active 52 DOM
-
2026-06-12days on market $229,000 Active 51 DOM
-
2026-06-09days on market $229,000 Active 48 DOM
-
2026-06-08days on market $229,000 Active 47 DOM
-
2026-06-07days on market $229,000 Active 46 DOM
-
2026-06-03days on market $229,000 Active 42 DOM
-
2026-06-02days on market $229,000 Active 41 DOM
-
2026-06-01days on market $229,000 Active 40 DOM
-
2026-05-31days on market $229,000 Active 39 DOM
-
2026-05-30days on market $229,000 Active 38 DOM
-
2026-04-22$229,000 Active 807-char remark
-
2023-10-12status Active
-
2023-10-12historical
-
2023-07-07price $238,000
-
2023-06-30$248,000 Active
-
2003-10-15soldstatus $132,500
ⓘ Source: listings_history table (triggers on properties + properties_extension) + one-shot
backfill from property_details.listing_events for pre-trigger history.
Tax reassessment forecast NV · Resets to sale price
- Current annual tax
- $1,173 · $98/mo
- Projected year-2 tax
- $1,351 · $113/mo
- Expected delta
- +$178/yr (+$15/mo · 15.2%)
ⓘ Screening estimate from a state-policy table — verify with the county assessor before closing.
Climate risk First Street
- Flood 1/10 Low FEMA zone X (shaded) · 0% chance over 30 yrs
- Wildfire 3/10 Moderate
- Heat 7/10 Severe 7 d/yr ≥103°F today · 18 d/yr by 30 yrs out
- Wind 1/10 Low
- Air quality 1/10 Low 0 unhealthy d/yr today · 0 by 30 yrs out
Nearby sold comps map
Loading sold comps map…
Walkable amenities ~0.75 mi
Loading nearby amenities…
Taxation est. · year 1
- Rental income
- $19,434
- − Mortgage interest
- −$12,828
- − Property taxes
- −$1,173
- − Insurance
- −$1,145
- − Repairs & maintenance
- −$1,555
- − Management
- −$1,555
- − Depreciation
- −$6,662
- Taxable loss
- −$5,483
- Est. tax savings @ 24.0%
- +$1,316
- After-tax cash flow
- $-60/yr
For passive investors: Depreciation is non-cash, so a rental often shows a tax loss while cash-flowing — sheltering income. Rental losses are passive: they offset passive income freely, and up to $25,000/yr can offset ordinary (W-2) income if you actively participate and your MAGI is under $100k (phasing out to $0 by $150k); unused losses carry forward. On sale, claimed depreciation is recaptured at up to 25%, and gains may owe capital-gains tax (a 1031 exchange can defer both). Figures are a year-1 estimate at your 24.0% rate — not tax advice; consult a CPA.
Schools (NCES district)
- District
- Nye County School District
- NCES district ID
- 3200360
- Math proficiency
- 20% ▼ -6.00%
- Reading proficiency
- 33% ▼ -5.00%
- Median HH income
- $41,447
- Composite
- 22.43/100
- National rank
- #8110
- State rank
- #16 of 17 in NV
Livability — Pahrump
- Score
- 68/100
- State rank
- #30
- US rank
- #9226
Category grades
Schools grade is shown separately in the Schools card above.
Census & demographics
- Census place
- Pahrump, NV
- County
- Nye County · 47,491 people
- City population
- 47,491
- Metro
- Pahrump, NV
- Population (ZIP)
- 26,486
- Household income
- $61,367
- Rent vs Own
- Severe rent burden
- 939.0
Population outlook (Nye County) Hauer SSP2
- Today (2025)
- 40,727 people
- By 2030
- 38,812 · -4.7%
- By 2040
- 33,952 · -16.6%
- By 2050
- 29,393 · -27.8%
- By 2075
- 21,122 · -48.1%
- By 2100
- 14,400 · -64.6%
Race, ethnicity, and origin ACS 2023
- Neighborhood character
- Predominantly White (71%)
- Race & ethnicity
- White 71% Hispanic / Latino 13% Two or more races 12% Black 3% Asian 2% Native American 1%
- Hispanic origin (detail)
- Mexican 8%
- Common ancestry
- Lithuanian 3% Slovak 3% Serbian 2%
- Foreign-born
- 8% · Canada, South Korea
- Languages at home
- 89% English-only · Spanish 9% Tagalog/Filipino 1%
Political lean MEDSL · Nye
- 2024 margin
- Solid R (+42.2) · D 28.0% · R 70.2% · Other 1.8%
- 2008→2024 swing
- -28.8pp toward R · 2008: -13.4pp · 2024: -42.2pp
- All cycles
- 2024: R+42.2 2020: R+40.4 2016: R+42.0 2012: R+24.2 2008: R+13.4
Not yet ingested
- Civics
- —
Market trends
- HPI YoY
- ▼ -21.52%
- Current HPI
- 277.4486
- Rent YoY
- ▲ 2.73%
- Metro
- Pahrump, NV
- State GDP YoY
- ▲ 3.08%
- F500 in state
- 6
Industry mix (Fortune 500 HQ in NV)
| Industry | F500 HQs | Revenue |
|---|---|---|
| Hotels / Casinos | 3 | $36B |
|
||
Price history
+72.8% since first listed6 events — show timeline
- 2026-04-22 Listed $229,000 GLVAR
- 2023-10-12 Relisted — GLVAR
- 2023-10-12 Listing Removed — GLVAR
- 2023-07-07 Price Changed $238,000 GLVAR
- 2023-06-30 Listed $248,000 GLVAR
- 2003-10-15 Sold (Public Records) $132,500 Public Records
Property tax history
-1.7%/yrLatest (2025): $1,173 · +6.8% YoY. Source: county tax records.
Cash-flow waterfall
monthlySold comps — $/sqft
last 12 mo · ≤1 miLoading sold comps…