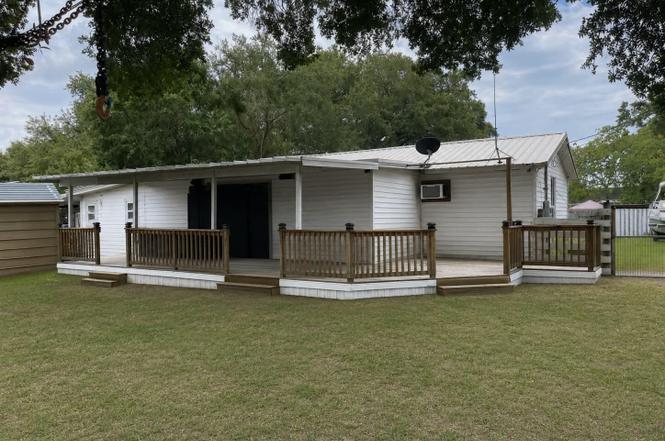
1111 NW 3rd St · Okeechobee, FL
Flood risk 1/10 · Minimal
- FEMA flood zone
- X (unshaded)
- Chance of flooding over 30 yrs
- 0.0%
- Est. flood insurance / yr
- $507 – $1,088
Fire risk 4/10 · Minor
- Est. fire insurance / yr
- $947 – $1,759
Heat risk 9/10 · Severe
- Hot days now (above 108°F)
- 7 days/yr
- Hot days in 30 yrs
- 24 days/yr
Wind risk 10/10 · Severe
- Chance of severe wind over 30 yrs
- 99.0%
Air-quality risk 2/10 · Minimal
- Unhealthy air days now
- 1 days/yr
- Unhealthy air days in 30 yrs
- 2 days/yr
Risk factors via First Street. Map © Google.
Why this score? — see what drove the C+ grade
The composite is a weighted blend of 9 inputs, each scored 0–100. Each bar is that input's sub-score; the figure is the points it added to the 100-point composite (weight × sub-score).
- Cash flow +21.5/30.0
- ARV discount +15.0/15.0
- DSCR +6.9/10.0
- 1% rule +5.9/10.0
- Livability +3.9/5.0
- Schools +3.6/10.0
- Rent growth +2.5/5.0
- Condition / age +2.5/5.0
- Appreciation +2.0/10.0
$190,000
🖨 Deal sheet 📄 Offer letter ✓ Due diligence
Listing remarks
Welcome home to this charming 3-bedroom, 2-bath residence featuring a functional floor plan and desirable outdoor space. Highlights include a tankless water heater, metal roof approximately 10 years old per seller, central A/C, and a hidden closet safe room. The oversized backyard offers endless possibilities with plenty of room for entertaining, recreation, or a future pool. Whether you're looking for your next home or an investment opportunity, this property is one you won't want to miss. Schedule your showing today! Virtual Staging Disclaimer: "Some photographs have been virtually staged to illustrate the property's potential. Furnishings, décor, and other items shown in virt
Key facts
- Metal roof
- Central a/c
- Oversized backyard
Tags
Property features AI
Finance
- Other: Pets allowed with no restrictions
Exterior
- Parking: Attached carport; Two covered/carport spaces; Circular driveway; Two open parking spaces (total 2)
- Utilities: Public water; Public sewer; Electricity connected; Water connected; Sewer connected
- Home design: Single family residence; One and one-half levels; Entry at level 1; North-facing
- Construction: Wood frame construction; Metal roof; One-story structure (one and one-half levels)
- Exterior features: Wood backyard fence; Front entry; Public maintained road access; Not waterfront
Interior
- Kitchen: Dishwasher; Electric range; Microwave; Refrigerator
- Bedrooms: Three bedrooms on the main level
- Flooring: Ceramic tile; Laminate
- Bathrooms: Two full bathrooms on the main level
- Heating & cooling: Central heating; Central air; Wall or window AC unit(s)
- Interior features: Split bedroom layout
- Laundry & utility: Dedicated laundry room
Neighborhood map
What this means for you Summary
Snapshot
- This is a 3-bed/1.0-bath single-family listed at $190k.
Deal economics
- At list price, monthly cash flow is $286 ($3k/yr) — positive.
- The deal already cash-flows at list — no discount required.
- Meets the 1% rule at list price ($2k rent vs $190k).
- Cap rate 8.1% vs local median 4.3% in Okeechobee — top-decile yield for the area; either an underpriced asset or a hidden risk that comps aren't pricing in. Stress-test before assuming the spread holds.
Location & tenants
- Location reads 77/100 on livability (#210 in FL, #3,234 nationally) — a middle-class / working-renter tenant base. Strengths: cost of living A+, housing A+, health & safety A+; Watch: employment C-, amenities F, commute F.
- Okeechobee (town): math 44% / reading 42% proficiency, ranked #58 of 73 in FL (top 80%) — families likely to look elsewhere, expect single-tenant / working-renter base with shorter leases; 72% free/reduced lunch — lower-income household profile, screen leases tightly.
- Zoned schools: Central Elementary School (math 39% / reading 39%, grade F, #1,560 of 2,144 statewide, top 73%, 530 students, 76% FRL); Yearling Middle School (math 45% / reading 32%, grade F, #384 of 571 statewide, top 68%, 668 students, 70% FRL); Okeechobee High School (math 30% / reading 42%, grade F, #359 of 667 statewide, top 55%, 1,692 students, 62% FRL) — zoned schools at 69% FRL track the district average.
- Market conditions: 644 active listings in the ZIP; 18 units permitted in Okeechobee County in 2024 (0 in 5+ unit buildings).
Forward outlook
- Local home prices are declining (-3.0%/yr); year-one equity from $1k of loan paydown is wiped out by about $6k of value loss. Plan a longer hold.
- Okeechobee County population projected at -21% by 2050 — secular population decline; favor cash flow + early exit over multi-decade hold.
Negotiation context
- Only 4 days on market — expect competitive offers; lowballing is unlikely to land.
- Current owner paid $45k; list at $190k implies a 320% gain — meaningful room to come down on a strong offer.
Risks & watch-outs
- Watch-outs: built in 1957 — expect roof / HVAC / electrical / plumbing capex.
- Climate carrying-cost: severe wind risk, 99% chance of damaging wind over 30y; extreme-heat days projected 7→24/yr by 2055 (HVAC capex compounding) — expect insurance premiums to compound above CPI over the hold.
Questions for the listing agent
- Built in 1957 — when were the roof, HVAC, electrical panel, plumbing, and water heater last replaced?
- Is there a deadline driving the sale (1031 exchange, divorce, estate, relocation)? That informs how much negotiation room exists.
- What's the average days-on-market for RENTAL listings here right now (not sales)? A rising rental-DOM trend means longer vacancies and softer asking-rent achievability than the comps imply.
- What's the recent tenant-quality profile in this submarket — average credit score on applications, eviction rate, late-payment / NSF rate, and stable-employment percentage? A property-management company in the area should have these aggregated.
- How much new for-sale + rental construction is in the pipeline within 1–3 miles? Heavy new supply typically softens prices + rents 12–24 months out; constrained supply supports both.
Investment metrics
- 1% rule
- 1.09% ✓
- Cap rate
- 8.10%
- Cash-on-cash
- 6.46%
- DSCR
- 1.29
- GRM
- 7.6
CMA / ARV
- ARV (on-the-fly)
- $305,020
- Comps found
- 8
Show comp detail 8 sales within ~0.75 mi
| Address | Dist | Beds/Ba | Sqft | Sold | Price | $/sf | Match |
|---|---|---|---|---|---|---|---|
| 150 SW 20th Ter | 0.39mi | 2/2.0 (-1) | 1,460 (-3%) | 1mo | $177,000 | $121 | 66 |
| 910 NW 5th St | 0.30mi | 3/2.0 | 1,428 (-5%) | 9mo | $289,000 | $202 | 66 |
| 908 NW 5th St | 0.31mi | 3/2.0 | 1,428 (-5%) | 12mo | $290,000 | $203 | 62 |
| 1646 NW 7th St | 0.30mi | 3/2.0 | 1,432 (-5%) | 17mo | $325,000 | $227 | 59 |
| 909 NW 3rd St | 0.26mi | 3/1.0 | 1,324 (-12%) | 10mo | $220,000 | $166 | 59 |
| 504 NW 6th St | 0.60mi | 2/1.0 (-1) | 1,476 (-2%) | 7mo | $225,000 | $152 | 58 |
| 1987 NW 5th St | 0.35mi | 3/2.0 | 1,404 (-7%) | 15mo | $186,500 | $133 | 55 |
| 1757 SW 8th St | 0.63mi | 2/2.0 (-1) | 1,470 (-3%) | 8mo | $310,000 | $211 | 51 |
Match score weights: distance 35% · size 25% · config 20% · recency 20%. Top-matched comps best support the ARV.
Projected returns pro-forma
-3.0% appreciation · 3.0% rent growth · sell at horizon
- IRR
- -6.3%
- Equity multiple
- 0.76×
- Total profit
- $-12,506
- Equity at exit
- $28,330
- IRR
- 3.3%
- Equity multiple
- 1.24×
- Total profit
- $12,803
- Equity at exit
- $16,428
Cash invested: $53,200 (down + closing). Projections, not guarantees.
Landlord ↔ Tenant lean methodology
- Overall (STATE)
- 87 Strongly Landlord-Friendly
- State Florida
- 87 Strongly Landlord-Friendly · R+3
- County
- — inherits STATE
- City
- — inherits STATE
ZIP-level market 34972
- Home prices YoY
- -1.5%
- Active inventory
- 644
- Price-to-rent
- 7.6×
Monthly cashflow live
- Estimated rent
- $2,072 medium interval (Pro) →
- Mortgage (P&I)
- −$996
- Tax from tax record
- −$275 /mo · $3,303/yr
- Insurance
- −$79
- HOA
- −$0
- Vacancy / Maint / Mgmt
- −$435
- Net cashflow
- $286
Break-even live
UW: 25.0% down · 7.5% · 30yr · 1.5% tax · 5.0% vac · 8.0% maint · 8.0% mgmt
Financing live
Cash to close
- Down payment
- $47,500
- Closing costs
- $5,700
- Reserves months
- —
- Total cash needed
- —
Loan-product check · same deal, 3 products live
Conventional
25% down · 7.5% · 30yr
- Down + closing
- —
- Monthly P&I
- —
- Monthly cashflow
- —
- DSCR
- —
- Eligible?
- —
Personal DTI + credit; lowest rate.
DSCR
20% down · 8.5% · 30yr
- Down + closing
- —
- Monthly P&I
- —
- Monthly cashflow
- —
- DSCR
- —
- Eligible?
- —
No personal income docs; deal must DSCR.
Hard money
10% down · 12.0% · 12mo
- Down + closing
- —
- Monthly P&I
- —
- Monthly cashflow
- —
- DSCR
- —
- Eligible?
- —
Short-term bridge; refi at stabilization.
Listing history 5 events
-
2026-06-19days on market $190,000 Active 4 DOM
-
2026-06-18days on market $190,000 Active 3 DOM
-
2026-06-17days on market $190,000 Active 2 DOM
-
2026-06-15remarks 687-char remark
-
2026-06-15$190,000 Active 1 DOM
ⓘ Source: listings_history table (triggers on properties + properties_extension) + one-shot
backfill from property_details.listing_events for pre-trigger history.
Tax reassessment forecast FL · Resets to sale price
- Current annual tax
- $3,303 · $275/mo
- Projected year-2 tax
- $3,303 · $275/mo
- Expected delta
- $0/yr ($0/mo · 0.0%)
ⓘ Screening estimate from a state-policy table — verify with the county assessor before closing.
Climate risk First Street
- Flood 1/10 Low FEMA zone X (unshaded) · 0% chance over 30 yrs
- Wildfire 4/10 Moderate
- Heat 9/10 Extreme 7 d/yr ≥108°F today · 24 d/yr by 30 yrs out
- Wind 10/10 Extreme 99% chance of damaging wind over 30 yrs
- Air quality 2/10 Low 1 unhealthy d/yr today · 2 by 30 yrs out
Nearby sold comps map
Loading sold comps map…
Walkable amenities ~0.75 mi
Loading nearby amenities…
Taxation est. · year 1
- Rental income
- $24,866
- − Mortgage interest
- −$10,643
- − Property taxes
- −$3,303
- − Insurance
- −$950
- − Repairs & maintenance
- −$1,989
- − Management
- −$1,989
- − Depreciation
- −$5,527
- Taxable income
- $464
- Est. tax owed @ 24.0%
- −$111
- After-tax cash flow
- $3,323/yr
For passive investors: Depreciation is non-cash, so a rental often shows a tax loss while cash-flowing — sheltering income. Rental losses are passive: they offset passive income freely, and up to $25,000/yr can offset ordinary (W-2) income if you actively participate and your MAGI is under $100k (phasing out to $0 by $150k); unused losses carry forward. On sale, claimed depreciation is recaptured at up to 25%, and gains may owe capital-gains tax (a 1031 exchange can defer both). Figures are a year-1 estimate at your 24.0% rate — not tax advice; consult a CPA.
Schools (NCES district)
- District
- Okeechobee
- NCES district ID
- 1201410
- Math proficiency
- 44% ▼ -12.00%
- Reading proficiency
- 42% ▼ -4.00%
- Median HH income
- $36,710
- Composite
- 35.73/100
- National rank
- #4855
- State rank
- #58 of 73 in FL
Livability — Okeechobee
- Score
- 77/100
- State rank
- #210
- US rank
- #3234
Category grades
Schools grade is shown separately in the Schools card above.
Census & demographics
- Census place
- Okeechobee, FL
- City population
- 23,975
- Population (ZIP)
- 19,185
Population outlook (Okeechobee County) Hauer SSP2
- Today (2025)
- 37,273 people
- By 2030
- 35,885 · -3.7%
- By 2040
- 32,931 · -11.6%
- By 2050
- 29,433 · -21.0%
- By 2075
- 19,607 · -47.4%
- By 2100
- 11,814 · -68.3%
Race, ethnicity, and origin ACS 2023
- Neighborhood character
- Diverse neighborhood (Simpson 0.62)
- Race & ethnicity
- White 52% Hispanic / Latino 30% Black 14% Two or more races 14%
- Hispanic origin (detail)
- Mexican 24% Puerto Rican 1% Cuban 1%
- Common ancestry
- Lithuanian 3% Slovak 1% Romanian 1%
- Foreign-born
- 12% · Canada, Dominican Republic
- Languages at home
- 77% English-only · Spanish 22% Other Indo-European 0%
Political lean MEDSL · Okeechobee
- 2024 margin
- Solid R (+53.8) · D 22.9% · R 76.7%
- 2008→2024 swing
- -34.6pp toward R · 2008: -19.2pp · 2024: -53.8pp
- All cycles
- 2024: R+53.8 2020: R+44.4 2016: R+39.5 2012: R+20.0 2008: R+19.2
Not yet ingested
- Civics
- —
Market trends
- HPI YoY
- ▼ -5.94%
- Current HPI
- 389.1156
- Rent YoY
- —
- Metro
- —
- State GDP YoY
- ▲ 3.28%
- F500 in state
- 36
Industry mix (Fortune 500 HQ in FL)
| Industry | F500 HQs | Revenue |
|---|---|---|
| Industrial Technology | 2 | $29B |
|
||
| Insurance | 2 | $17B |
|
||
| Retail | 1 | $60B |
|
||
| Technology Distribution | 1 | $58B |
|
||
| Homebuilding | 1 | $35B |
|
||
| Technology Manufacturing | 1 | $35B |
|
||
Price history
+320.4% since first listed2 events — show timeline
- 2026-06-15 Listed $190,000 Beaches MLS
- 2003-08-05 Sold (Public Records) $45,200 Public Records
Property tax history
+10.1%/yrLatest (2025): $3,303 · +9.6% YoY. Source: county tax records.
Cash-flow waterfall
monthlySold comps — $/sqft
last 12 mo · ≤1 miLoading sold comps…