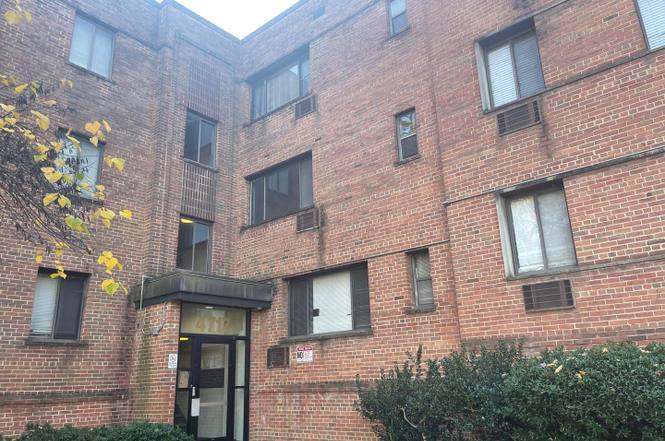
4717 1st St SW #302 · Washington, DC
Flood risk 6/10 · Moderate
- FEMA flood zone
- X (unshaded)
- Chance of flooding over 30 yrs
- 0.75%
- Est. flood insurance / yr
- $507 – $1,088
Fire risk 3/10 · Minor
- Est. fire insurance / yr
- $631 – $1,173
Heat risk 8/10 · Major
- Hot days now (above 104°F)
- 7 days/yr
- Hot days in 30 yrs
- 16 days/yr
Wind risk 4/10 · Minor
- Chance of severe wind over 30 yrs
- 21.0%
Air-quality risk 3/10 · Minor
- Unhealthy air days now
- 2 days/yr
- Unhealthy air days in 30 yrs
- 3 days/yr
Risk factors via First Street. Map © Google.
Why this score? — see what drove the D+ grade
The composite is a weighted blend of 9 inputs, each scored 0–100. Each bar is that input's sub-score; the figure is the points it added to the 100-point composite (weight × sub-score).
- Cash flow +15.0/30.0
- ARV discount +7.5/15.0
- 1% rule +5.0/10.0
- DSCR +5.0/10.0
- Livability +3.7/5.0
- Schools +3.6/10.0
- Rent growth +3.5/5.0
- Condition / age +2.5/5.0
- Appreciation +0.0/10.0
$25,000
🖨 Deal sheet 📄 Offer letter ✓ Due diligence
Listing remarks
Recently (2023) renovated unit- sold subject to non-paying tenant's lease. Owner doesn't want to go through the eviction process so choosing to sell instead. Buyer may have to purchase sight- unseen. Seller just wants to be done with it.
Key facts
- $892 HOA
- Parking
- Built 1949
Neighborhood map
What this means for you Summary
Snapshot
- This is a 1-bed/1.0-bath condo listed at $25k.
Deal economics
- At list price, monthly cash flow is $67 ($805/yr) — positive.
- The deal already cash-flows at list — no discount required.
- Meets the 1% rule at list price ($1k rent vs $25k).
- Recommended offer: $24k (6.0% below list) — sets the bar for market timing.
- Cap rate 9.5% vs local median 2.5% in Washington — top-decile yield for the area; either an underpriced asset or a hidden risk that comps aren't pricing in. Stress-test before assuming the spread holds.
Location & tenants
- Location reads 73/100 on livability (#1 in DC) — a middle-class / working-renter tenant base. Strengths: amenities A+, commute A+, employment A+; Watch: crime F, cost of living F.
- District Of Columbia Public Schools (urban): math 33% / reading 40% proficiency, ranked #8 of 32 in DC (top 25%) — families likely to look elsewhere, expect single-tenant / working-renter base with shorter leases; 65% free/reduced lunch — lower-income household profile, screen leases tightly.
- Market conditions: Rents rising (+4.0%/yr); 145 active listings in the ZIP; 36 comparable units currently listed for rent nearby; rentals at typical pace (median 24d on market — plan ~3-4 weeks tenant-placement turnaround); 1,737 units permitted in District of Columbia in 2024 (1,506 in 5+ unit buildings).
- This rent runs 35% of the median local income ($49k/yr) — at the standard rent-burdened threshold; future hikes will face affordability resistance.
Forward outlook
- Local home prices are declining (-3.0%/yr); year-one equity from $173 of loan paydown is wiped out by about $750 of value loss. Plan a longer hold.
- District of Columbia County population projected at +50% by 2050 — long-run rental-demand tailwind backs the buy-and-hold thesis.
- At projected returns (-3.0% appreciation + 4.0% rent growth), your $7k cash investment doubles in ~7 years — after that, you're playing with house money.
Negotiation context
- It's been on market 61 days — a 6% lower offer ($24k) is reasonable based on typical stale-listing flexibility.
- 7 sale attempts since 19y ago with the ask held roughly flat each time — persistent listings suggest the price (not the market) is what's stuck; bring a comps-based counter.
Risks & watch-outs
- Watch-outs: HOA is 62% of rent; built in 1949 — expect roof / HVAC / electrical / plumbing capex.
- Climate carrying-cost: major flood risk; extreme-heat days projected 7→16/yr by 2055 (HVAC capex compounding) — expect insurance premiums to compound above CPI over the hold.
Questions for the listing agent
- It's been on market 61 days. Have you received any prior offers? Is the seller open to a 6% concession, seller financing, or rate buy-down credit?
- Built in 1949 — when were the roof, HVAC, electrical panel, plumbing, and water heater last replaced?
- What does the HOA fee cover, when was the last increase, and are there any pending special assessments or reserve-fund shortfalls?
- Any open or pending special assessments — roof, HVAC, plumbing, elevator, façade? What's the per-unit balance and payoff schedule, and is the seller paying it off at close or rolling it to the buyer?
- Why hasn't it sold? Are there any deal-killer items the seller is aware of (foundation, flood, title, zoning, code violations)?
- Is there a deadline driving the sale (1031 exchange, divorce, estate, relocation)? That informs how much negotiation room exists.
- Crime grade is F in this area — have there been break-ins, vandalism, or insurance claims at this property in the last 3 years? What carrier currently insures it and at what premium?
- The area grade is low — what's the realistic commute time and amenity access for the typical tenant pool here? Any planned neighborhood developments (good or bad) we should know about?
- What's the average days-on-market for RENTAL listings here right now (not sales)? A rising rental-DOM trend means longer vacancies and softer asking-rent achievability than the comps imply.
- What's the recent tenant-quality profile in this submarket — average credit score on applications, eviction rate, late-payment / NSF rate, and stable-employment percentage? A property-management company in the area should have these aggregated.
- How much new apartment / multifamily construction is in the pipeline within 1–3 miles? Heavy new supply (>2% of stock underway) typically softens rents 12–24 months out; light construction supports rent growth.
Investment metrics
- 1% rule
- 5.75% ✓
- Cap rate
- 9.51%
- Cash-on-cash
- 11.49%
- DSCR
- 1.51
- GRM
- 1.4
CMA / ARV
No comps found within radius.
Projected returns pro-forma
-3.0% appreciation · 3.96% rent growth · sell at horizon
- IRR
- 7.5%
- Equity multiple
- 1.31×
- Total profit
- $2,195
- Equity at exit
- $3,728
- IRR
- 21.0%
- Equity multiple
- 3.23×
- Total profit
- $15,606
- Equity at exit
- $2,162
Cash invested: $7,000 (down + closing). Projections, not guarantees.
Landlord ↔ Tenant lean methodology
- Overall (CITY)
- 0 Strongly Tenant-Friendly
- State District of Columbia
- 12 Strongly Tenant-Friendly · D+43
- County
- — inherits STATE
- City Washington
- 0 Strongly Tenant-Friendly · D+43
ZIP-level market 20032
- Home prices YoY
- -15.6%
- Rents YoY
- 4.0%
- Active inventory
- 145
- Price-to-rent
- 1.4×
Monthly cashflow live
- Estimated rent
- $1,438 high interval (Pro) →
- Mortgage (P&I)
- −$131
- Tax from tax record
- −$36 /mo · $429/yr
- Insurance
- −$10
- HOA
- −$892
- Vacancy / Maint / Mgmt
- −$302
- Net cashflow
- $67
Break-even live
UW: 25.0% down · 7.5% · 30yr · 1.5% tax · 5.0% vac · 8.0% maint · 8.0% mgmt
Financing live
Cash to close
- Down payment
- $6,250
- Closing costs
- $750
- Reserves months
- —
- Total cash needed
- —
Loan-product check · same deal, 3 products live
Conventional
25% down · 7.5% · 30yr
- Down + closing
- —
- Monthly P&I
- —
- Monthly cashflow
- —
- DSCR
- —
- Eligible?
- —
Personal DTI + credit; lowest rate.
DSCR
20% down · 8.5% · 30yr
- Down + closing
- —
- Monthly P&I
- —
- Monthly cashflow
- —
- DSCR
- —
- Eligible?
- —
No personal income docs; deal must DSCR.
Hard money
10% down · 12.0% · 12mo
- Down + closing
- —
- Monthly P&I
- —
- Monthly cashflow
- —
- DSCR
- —
- Eligible?
- —
Short-term bridge; refi at stabilization.
Rent comps 36 comps
| Address | Beds | Baths | Sqft | Rent | $/sqft | DOM | Units | Dist |
|---|---|---|---|---|---|---|---|---|
| 4721 1st St SW #203 Washington, DC | 2.0 | 1.0 | 741 | $1,600 | $2.16 | 24d | 1 | 0.00mi |
| 4725 1st St SW #102 Washington, DC | 2.0 | 1.0 | 580 | $1,850 | $3.19 | 24d | 1 | 0.01mi |
| 4729 1st St SW #202 Washington, DC | 2.0 | 1.0 | 589 | $1,650 | $2.80 | 24d | 1 | 0.04mi |
| 6 Galveston St SW #303 Washington, DC | 2.0 | 1.0 | 708 | $1,700 | $2.40 | 24d | 1 | 0.06mi |
| 118 Galveston St SW Washington, DC | 1.0–3.0 | 1.0–2.0 | 951 | $1,249 | $1.31 | 2d | 10 | 0.14mi |
| 57 Galveston St SW Washington, DC | 1.0–2.0 | 1.0 | 650 | $1,199 | $1.84 | 4d | 5 | 0.15mi |
| 19 Galveston Pl SW #202 Washington, DC | 1.0 | 1.0 | 700 | $1,400 | $2.00 | 24d | 1 | 0.18mi |
| 4660 Martin Luther King Jr Ave SW Washington, DC | 1.0–2.0 | 1.0–2.0 | 827 | $1,399 | $1.69 | 2d | 11 | 0.23mi |
| 61 Forrester St SW Unit 104 Washington, DC | 2.0 | 1.0 | 639 | $1,700 | $2.66 | 24d | 1 | 0.23mi |
| 4632 Livingston Rd SE Washington, DC | 1.0–2.0 | 1.0 | 755 | $1,199 | $1.59 | 24d | 10 | 0.24mi |
| 2 Elmira St SE Washington, DC | 1.0 | 1.0 | 710 | $1,342 | $1.89 | 24d | 1 | 0.24mi |
| 141 Galveston Pl SW Washington, DC | 1.0 | 1.0 | 650 | $1,100 | $1.69 | 24d | 1 | 0.33mi |
| 4641 6th St SE Washington, DC | 1.0 | 1.0 | 650 | $1,275 | $1.96 | 24d | 1 | 0.33mi |
| 21 Chesapeake St SE Washington, DC | 2.0 | 1.0 | 670 | $1,250 | $1.87 | 19d | 1 | 0.42mi |
| 205 Elmira St SW Washington, DC | 1.0–2.0 | 1.0 | 705 | $1,235 | $1.75 | 24d | 5 | 0.45mi |
| 4001 S Capitol St SW Washington, DC | 3.0 | 1.0–2.0 | 782 | $1,392 | $1.78 | 13d | 1 | 0.58mi |
| 310 Atlantic St SE Washington, DC | 1.0–2.0 | 1.0 | 754 | $1,300 | $1.72 | 3d | 2 | 0.62mi |
| 3865 Halley Ter SE Washington, DC | 1.0 | 1.0 | 650 | $1,210 | $1.86 | 24d | 1 | 0.69mi |
| 701 Brandywine St SE #201 Washington, DC | 2.0 | 1.0 | 706 | $1,400 | $1.98 | 18d | 1 | 0.71mi |
| 705 Brandywine St SE #303 Washington, DC | 2.0 | 1.0 | 655 | $1,550 | $2.37 | 3d | 1 | 0.72mi |
| 713 Brandywine St SE Washington, DC | 2.0 | 1.0 | 707 | $1,650 | $2.33 | 24d | 1 | 0.74mi |
| 820 Southern Ave SE Washington, DC | 2.0–3.0 | 1.0–1.5 | 840 | $1,450 | $1.73 | 2d | 65 | 0.77mi |
| 811 Barnaby St SE Washington, DC | 1.0 | 1.0 | 650 | $1,275 | $1.96 | 24d | 1 | 0.78mi |
| 811 Barnaby St SE Apt 101 Washington, DC | 2.0 | 1.0 | 750 | $1,449 | $1.93 | 24d | 1 | 0.78mi |
| 730 Brandywine St SE #104 Washington, DC | 2.0 | 1.0 | 683 | $1,350 | $1.98 | 24d | 1 | 0.79mi |
| 808 Chesapeake St SE Washington, DC | 2.0 | 1.0 | 700 | $1,700 | $2.43 | 24d | 1 | 0.80mi |
| 742 Brandywine St SE Washington, DC | 1.0 | 1.0 | 599 | $1,095 | $1.83 | 3d | 1 | 0.81mi |
| 1002 Kennebec St Oxon Hill, MD | 1.0–2.0 | 1.0–1.5 | 871 | $1,395 | $1.60 | 1d | 12 | 0.83mi |
| 207 Mississippi Ave SE Washington, DC | 1.0–2.0 | 1.0–1.5 | 656 | $1,299 | $1.98 | 24d | 10 | 0.86mi |
| 3730 Martin Luther King Jr Ave SE Washington, DC | 2.0 | 1.0 | 475 | $1,138 | $2.39 | 1d | 2 | 0.92mi |
| 852 Barnaby St SE Washington, DC | 2.0–3.0 | 1.0–1.5 | 761 | $1,400 | $1.84 | 15d | 10 | 1.02mi |
| 3868 9th St SE Washington, DC | 2.0 | 1.0 | 740 | $1,450 | $1.96 | 24d | 1 | 1.07mi |
| 1311 Southview Dr Oxon Hill, MD | 2.0 | 1.0 | 628 | $1,410 | $2.25 | 1d | 64 | 1.08mi |
| 3429 5th St SE #42 Washington, DC | 1.0 | 1.0 | 702 | $1,395 | $1.99 | 13d | 1 | 1.17mi |
| 3320 6th St SE Washington, DC | 2.0 | 1.0 | 690 | $1,274 | $1.85 | 2d | 25 | 1.28mi |
| 1120 Trenton Pl SE Washington, DC | 1.0–2.0 | 1.0 | 715 | $1,275 | $1.78 | 10d | 3 | 1.49mi |
HOA detail condo
- Monthly dues
- $892 · $10,704/yr
- Assessments
- None detected in remarks — confirm with the listing agent.
Listing history 19 events
-
2026-01-07status Pending
-
2025-11-07$25,000 Active
-
2018-06-05soldstatus $38,000
-
2015-03-01historical
-
2015-02-24status Active
-
2015-02-24historical
-
2015-02-03historical Temporarily Off-Market
-
2015-01-22price
-
2014-12-04price
-
2014-09-16Active
-
2014-09-16$32,049
-
2008-09-03historical
-
2008-06-14status
-
2008-06-03historical
-
2008-04-22price
-
2008-01-07
-
2007-10-13historical
-
2007-04-24
-
1994-03-24soldstatus $50,900
ⓘ Source: listings_history table (triggers on properties + properties_extension) + one-shot
backfill from property_details.listing_events for pre-trigger history.
Tax reassessment forecast DC · Partial reset (capped growth)
- Current annual tax
- $429 · $36/mo
- Projected year-2 tax
- $429 · $36/mo
- Expected delta
- $0/yr ($0/mo · 0.0%)
ⓘ Screening estimate from a state-policy table — verify with the county assessor before closing.
Climate risk First Street
- Flood 6/10 Major FEMA zone X (unshaded) · 75% chance over 30 yrs
- Wildfire 3/10 Moderate
- Heat 8/10 Severe 7 d/yr ≥104°F today · 16 d/yr by 30 yrs out
- Wind 4/10 Moderate 21% chance of damaging wind over 30 yrs
- Air quality 3/10 Moderate 2 unhealthy d/yr today · 3 by 30 yrs out
Nearby sold comps map
Loading sold comps map…
Walkable amenities ~0.75 mi
Loading nearby amenities…
Taxation est. · year 1
- Rental income
- $17,261
- − Mortgage interest
- −$1,400
- − Property taxes
- −$429
- − Insurance
- −$125
- − Repairs & maintenance
- −$1,381
- − Management
- −$1,381
- − HOA
- −$10,704
- − Depreciation
- −$727
- Taxable income
- $1,113
- Est. tax owed @ 24.0%
- −$267
- After-tax cash flow
- $537/yr
For passive investors: Depreciation is non-cash, so a rental often shows a tax loss while cash-flowing — sheltering income. Rental losses are passive: they offset passive income freely, and up to $25,000/yr can offset ordinary (W-2) income if you actively participate and your MAGI is under $100k (phasing out to $0 by $150k); unused losses carry forward. On sale, claimed depreciation is recaptured at up to 25%, and gains may owe capital-gains tax (a 1031 exchange can defer both). Figures are a year-1 estimate at your 24.0% rate — not tax advice; consult a CPA.
Schools (NCES district)
- District
- District Of Columbia Public Schools
- NCES district ID
- 1100030
- Math proficiency
- 33% ▲ 3.00%
- Reading proficiency
- 40% ▲ 5.00%
- Median HH income
- $67,671
- Composite
- 35.84/100
- National rank
- #9606
- State rank
- #8 of 32 in DC
Livability — Washington
- Score
- 73/100
- State rank
- #1
- US rank
- #5327
Category grades
Schools grade is shown separately in the Schools card above.
Census & demographics
- Census place
- Washington, DC
- County
- District of Columbia · 671,873 people
- City population
- 671,873
- Metro
- Washington-Arlington-Alexandria, DC-VA-MD-WV
- Population (ZIP)
- 40,920
- Household income
- $49,139
- Rent vs Own
- Severe rent burden
- 4530.0
Population outlook (District of Columbia County) Hauer SSP2
- Today (2025)
- 821,926 people
- By 2030
- 899,517 · +9.4%
- By 2040
- 1,061,162 · +29.1%
- By 2050
- 1,231,493 · +49.8%
- By 2075
- 1,603,312 · +95.1%
- By 2100
- 1,847,141 · +124.7%
Race, ethnicity, and origin ACS 2023
- Neighborhood character
- Predominantly Black (80%)
- Race & ethnicity
- Black 80% White 8% Two or more races 7% Hispanic / Latino 5%
- Foreign-born
- 4% · Canada
- Languages at home
- 95% English-only · Spanish 3%
Political lean MEDSL · District of Columbia
- 2024 margin
- Solid D (+86.1) · D 91.2% · R 5.1% · Other 3.8%
- 2008→2024 swing
- +0.1pp no change · 2008: 85.9pp · 2024: 86.1pp
- All cycles
- 2024: D+86.1 2020: D+86.8 2016: D+88.7 2012: D+84.2 2008: D+85.9
Not yet ingested
- Civics
- —
Market trends
- HPI YoY
- ▼ -60.34%
- Current HPI
- 326.4077
- Rent YoY
- ▲ 3.96%
- Metro
- Washington-Arlington-Alexandria, DC-VA-MD-WV
- State GDP YoY
- ▲ 1.33%
- F500 in state
- 6
Industry mix (Fortune 500 HQ in DC)
| Industry | F500 HQs | Revenue |
|---|---|---|
| Financial Services | 1 | $153B |
|
||
| Life Sciences / Industrials | 1 | $25B |
|
||
| Industrial Machinery | 1 | $8B |
|
||
Price history
-50.9% since first listed19 events — show timeline
- 2026-01-07 Pending — BRIGHT MLS
- 2025-11-07 Listed $25,000 BRIGHT MLS
- 2018-06-05 Sold (Public Records) $38,000 Public Records
- 2015-03-01 Delisted — MRIS
- 2015-02-24 Relisted — MRIS
- 2015-02-24 Listing Removed — BRIGHT MLS
- 2015-02-03 Delisted — MRIS
- 2015-01-22 Price Changed — MRIS
- 2014-12-04 Price Changed — MRIS
- 2014-09-16 Listed — MRIS
- 2014-09-16 Listed $32,049 BRIGHT MLS
- 2008-09-03 Delisted — MRIS
- 2008-06-14 Relisted — MRIS
- 2008-06-03 Delisted — MRIS
- 2008-04-22 Price Changed — MRIS
- 2008-01-07 Listed — MRIS
- 2007-10-13 Delisted — MRIS
- 2007-04-24 Listed — MRIS
- 1994-03-24 Sold (Public Records) $50,900 Public Records
Property tax history
-5.4%/yrLatest (2025): $429 · -2.3% YoY. Source: county tax records.
Cash-flow waterfall
monthlySold comps — $/sqft
last 12 mo · ≤1 miLoading sold comps…