14411 Palmdale Rd · Victorville, CA
Flood risk 1/10 · Minimal
- FEMA flood zone
- X (unshaded)
- Chance of flooding over 30 yrs
- 0.0%
- Est. flood insurance / yr
- $507 – $1,088
Fire risk 5/10 · Moderate
- Est. fire insurance / yr
- $659 – $1,223
Heat risk 6/10 · Moderate
- Hot days now (above threshold)
- —
- Hot days in 30 yrs
- —
Wind risk 1/10 · Minimal
- Chance of severe wind over 30 yrs
- —
Air-quality risk 9/10 · Severe
- Unhealthy air days now
- 22 days/yr
- Unhealthy air days in 30 yrs
- 28 days/yr
Risk factors via First Street. Map © Google.
Why this score? — see what drove the B- grade
The composite is a weighted blend of 9 inputs, each scored 0–100. Each bar is that input's sub-score; the figure is the points it added to the 100-point composite (weight × sub-score).
- Cash flow +30.0/30.0
- 1% rule +10.0/10.0
- DSCR +10.0/10.0
- ARV discount +7.5/15.0
- Rent growth +2.9/5.0
- Livability +2.7/5.0
- Condition / age +2.5/5.0
- Schools +2.2/10.0
- Appreciation +0.0/10.0
$49,999
🖨 Deal sheet 📄 Offer letter ✓ Due diligence
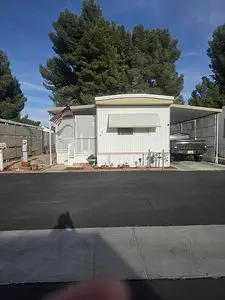
Listing remarks
FOR SALE BY OWNER. 55+ Greenbriar Mobile Home Park. Completely remodeled 1968 Buddy 56& apos; x 12& quot; . Sold as-is. Space rent is $720.00 per month, and includes water, trash, and sewer. Spacious living room has 2 big windows and sliding door to deck to provide plenty of light. Kitchen has stainless refridgerator, dishwasher, and 5 burner stove, which includes pancake gridle and built-in air fryer. All appliances under 2 years old. Has a new garbage disposal and all new pull out stainless faucet and double sink. Has a breakfast bar with 6 drawers and 2 cupboards. (Bar stools not included). Plenty of cabinet space. Hallway leads to a good sized bedroom and bathroom. Brand new cen
Key facts
- Remodeled
- Breakfast bar
- Swamp cooler
Tags
Neighborhood map
What this means for you Summary
Snapshot
- This is a 1-bed/1.0-bath land listed at $50k.
Deal economics
- At list price, monthly cash flow is $979 ($12k/yr) — positive.
- The deal already cash-flows at list — no discount required.
- Meets the 1% rule at list price ($2k rent vs $50k).
- Cap rate 29.8% vs local median 4.2% in Victorville — top-decile yield for the area; either an underpriced asset or a hidden risk that comps aren't pricing in. Stress-test before assuming the spread holds.
Location & tenants
- Location reads 54/100 on livability (#906 in CA) — a working-class tenant base; expect higher turnover. Strengths: housing A+; Watch: employment D+, schools D-, crime F.
- Victor Elementary (urban): math 25% / reading 25% proficiency, ranked #408 of 517 in CA (top 79%) — low school quality limits family demand, transient renter base, plan for 1-2y turnover; 70% free/reduced lunch — lower-income household profile, screen leases tightly.
- Market conditions: Rents rising (+1.7%/yr); 369 active listings in the ZIP; solid renter incomes; 5,458 units permitted in San Bernardino County in 2024 (1,500 in 5+ unit buildings).
Forward outlook
- Local home prices are declining (-3.0%/yr); year-one equity from $345 of loan paydown is wiped out by about $2k of value loss. Plan a longer hold.
- San Bernardino County population projected at +15% by 2050 — modest demand growth; plan on rents tracking national, not racing it.
- At projected returns (-3.0% appreciation + 1.7% rent growth), your $14k cash investment doubles in ~2 years — after that, you're playing with house money.
Negotiation context
- Only 1 days on market — expect competitive offers; lowballing is unlikely to land.
Risks & watch-outs
- Climate carrying-cost: moderate wildfire risk — expect insurance premiums to compound above CPI over the hold.
Questions for the listing agent
- Built in 1968 — when were the roof, HVAC, electrical panel, plumbing, and water heater last replaced?
- Is there a deadline driving the sale (1031 exchange, divorce, estate, relocation)? That informs how much negotiation room exists.
- Schools are D-rated, which usually means shorter tenancies and higher turnover. Who's the typical renter profile here, and what's been the actual vacancy rate?
- Crime grade is F in this area — have there been break-ins, vandalism, or insurance claims at this property in the last 3 years? What carrier currently insures it and at what premium?
- What's the average days-on-market for RENTAL listings here right now (not sales)? A rising rental-DOM trend means longer vacancies and softer asking-rent achievability than the comps imply.
- What's the recent tenant-quality profile in this submarket — average credit score on applications, eviction rate, late-payment / NSF rate, and stable-employment percentage? A property-management company in the area should have these aggregated.
- How much new for-sale + rental construction is in the pipeline within 1–3 miles? Heavy new supply typically softens prices + rents 12–24 months out; constrained supply supports both.
Investment metrics
- 1% rule
- 3.35% ✓
- Cap rate
- 29.79%
- Cash-on-cash
- 83.90%
- DSCR
- 4.73
- GRM
- 2.5
CMA / ARV
No comps found within radius.
Projected returns pro-forma
-3.0% appreciation · 1.69% rent growth · sell at horizon
- IRR
- 82.8%
- Equity multiple
- 4.72×
- Total profit
- $52,086
- Equity at exit
- $7,455
- IRR
- 85.8%
- Equity multiple
- 9.36×
- Total profit
- $117,019
- Equity at exit
- $4,323
Cash invested: $14,000 (down + closing). Projections, not guarantees.
Landlord ↔ Tenant lean methodology
- Overall (STATE)
- 18 Strongly Tenant-Friendly
- State California
- 18 Strongly Tenant-Friendly · D+13
- County
- — inherits STATE
- City
- — inherits STATE
ZIP-level market 92392
- Home prices YoY
- -9.0%
- Rents YoY
- 1.7%
- Active inventory
- 369
- Price-to-rent
- 2.5×
Monthly cashflow live
- Estimated rent
- $1,676 medium interval (Pro) →
- Mortgage (P&I)
- −$262
- Tax est. 1.5%
- −$62 /mo · $750/yr
- Insurance
- −$21
- HOA
- −$0
- Vacancy / Maint / Mgmt
- −$352
- Net cashflow
- $979
Break-even live
UW: 25.0% down · 7.5% · 30yr · 1.5% tax · 5.0% vac · 8.0% maint · 8.0% mgmt
Financing live
Cash to close
- Down payment
- $12,500
- Closing costs
- $1,500
- Reserves months
- —
- Total cash needed
- —
Loan-product check · same deal, 3 products live
Conventional
25% down · 7.5% · 30yr
- Down + closing
- —
- Monthly P&I
- —
- Monthly cashflow
- —
- DSCR
- —
- Eligible?
- —
Personal DTI + credit; lowest rate.
DSCR
20% down · 8.5% · 30yr
- Down + closing
- —
- Monthly P&I
- —
- Monthly cashflow
- —
- DSCR
- —
- Eligible?
- —
No personal income docs; deal must DSCR.
Hard money
10% down · 12.0% · 12mo
- Down + closing
- —
- Monthly P&I
- —
- Monthly cashflow
- —
- DSCR
- —
- Eligible?
- —
Short-term bridge; refi at stabilization.
Listing history 3 events
-
2026-05-26$49,999 Active
-
2007-11-09soldstatus $3,300,000
-
2003-07-17soldstatus $2,000,000
ⓘ Source: listings_history table (triggers on properties + properties_extension) + one-shot
backfill from property_details.listing_events for pre-trigger history.
Climate risk First Street
- Flood 1/10 Low FEMA zone X (unshaded) · 0% chance over 30 yrs
- Wildfire 5/10 Major
- Heat 6/10 Major
- Wind 1/10 Low
- Air quality 9/10 Extreme 22 unhealthy d/yr today · 28 by 30 yrs out
Nearby sold comps map
Loading sold comps map…
Walkable amenities ~0.75 mi
Loading nearby amenities…
Taxation est. · year 1
- Rental income
- $20,117
- − Mortgage interest
- −$2,801
- − Property taxes
- −$750
- − Insurance
- −$250
- − Repairs & maintenance
- −$1,609
- − Management
- −$1,609
- − Depreciation
- −$1,455
- Taxable income
- $11,643
- Est. tax owed @ 24.0%
- −$2,794
- After-tax cash flow
- $8,952/yr
For passive investors: Depreciation is non-cash, so a rental often shows a tax loss while cash-flowing — sheltering income. Rental losses are passive: they offset passive income freely, and up to $25,000/yr can offset ordinary (W-2) income if you actively participate and your MAGI is under $100k (phasing out to $0 by $150k); unused losses carry forward. On sale, claimed depreciation is recaptured at up to 25%, and gains may owe capital-gains tax (a 1031 exchange can defer both). Figures are a year-1 estimate at your 24.0% rate — not tax advice; consult a CPA.
Schools (NCES district)
- District
- Victor Elementary
- NCES district ID
- 0641040
- Math proficiency
- 25% ▬ 0.00%
- Reading proficiency
- 25% ▼ -9.00%
- Median HH income
- $44,949
- Composite
- 21.58/100
- National rank
- #8304
- State rank
- #408 of 517 in CA
Livability — Victorville
- Score
- 54/100
- State rank
- #906
- US rank
- #24038
Category grades
Schools grade is shown separately in the Schools card above.
Census & demographics
- Census place
- Victorville, CA
- County
- San Bernardino County · 2,030,291 people
- City population
- 154,418
- Metro
- Riverside-San Bernardino-Ontario, CA
- Population (ZIP)
- 65,429
- Household income
- $87,681
- Rent vs Own
- Severe rent burden
- 1879.0
Population outlook (San Bernardino County) Hauer SSP2
- Today (2025)
- 2,300,329 people
- By 2030
- 2,378,907 · +3.4%
- By 2040
- 2,523,137 · +9.7%
- By 2050
- 2,642,388 · +14.9%
- By 2075
- 2,880,769 · +25.2%
- By 2100
- 2,909,436 · +26.5%
Race, ethnicity, and origin ACS 2023
- Neighborhood character
- Diverse neighborhood (Simpson 0.62)
- Race & ethnicity
- Hispanic / Latino 55% Two or more races 24% White 22% Black 14% Asian 4% Native American 2%
- Hispanic origin (detail)
- Mexican 47%
- Common ancestry
- Portuguese 1% Romanian 1%
- Foreign-born
- 20% · Canada, China, Vietnam
- Languages at home
- 57% English-only · Spanish 38% Tagalog/Filipino 2% Other Indo-European 1%
Political lean MEDSL · San Bernardino
- 2024 margin
- Toss-up / Even · D 47.5% · R 49.7% · Other 2.8%
- 2008→2024 swing
- -8.5pp toward R · 2008: 6.3pp · 2024: -2.1pp
- All cycles
- 2024: R+2.1 2020: D+10.7 2016: D+9.8 2012: D+5.4 2008: D+6.3
Not yet ingested
- Civics
- —
Market trends
- HPI YoY
- ▼ -35.57%
- Current HPI
- 358.5152
- Rent YoY
- ▲ 1.69%
- Metro
- Riverside-San Bernardino-Ontario, CA
- State GDP YoY
- ▲ 3.21%
- F500 in state
- 116
Industry mix (Fortune 500 HQ in CA)
| Industry | F500 HQs | Revenue |
|---|---|---|
| Technology | 27 | $1,492B |
|
||
| Financial Services | 3 | $174B |
|
||
| Retail | 3 | $44B |
|
||
| Insurance | 3 | $26B |
|
||
| Media / Entertainment | 2 | $115B |
|
||
| Pharmaceuticals / Biotech | 2 | $62B |
|
||
Price history
-97.5% since first listed3 events — show timeline
- 2026-05-26 Listed $49,999 FSBO.com
- 2007-11-09 Sold (Public Records) $3,300,000 Public Records
- 2003-07-17 Sold (Public Records) $2,000,000 Public Records
Property tax history
+3.5%/yrLatest (2025): $47,409 · +4.9% YoY. Source: county tax records.
Cash-flow waterfall
monthlySold comps — $/sqft
last 12 mo · ≤1 miLoading sold comps…