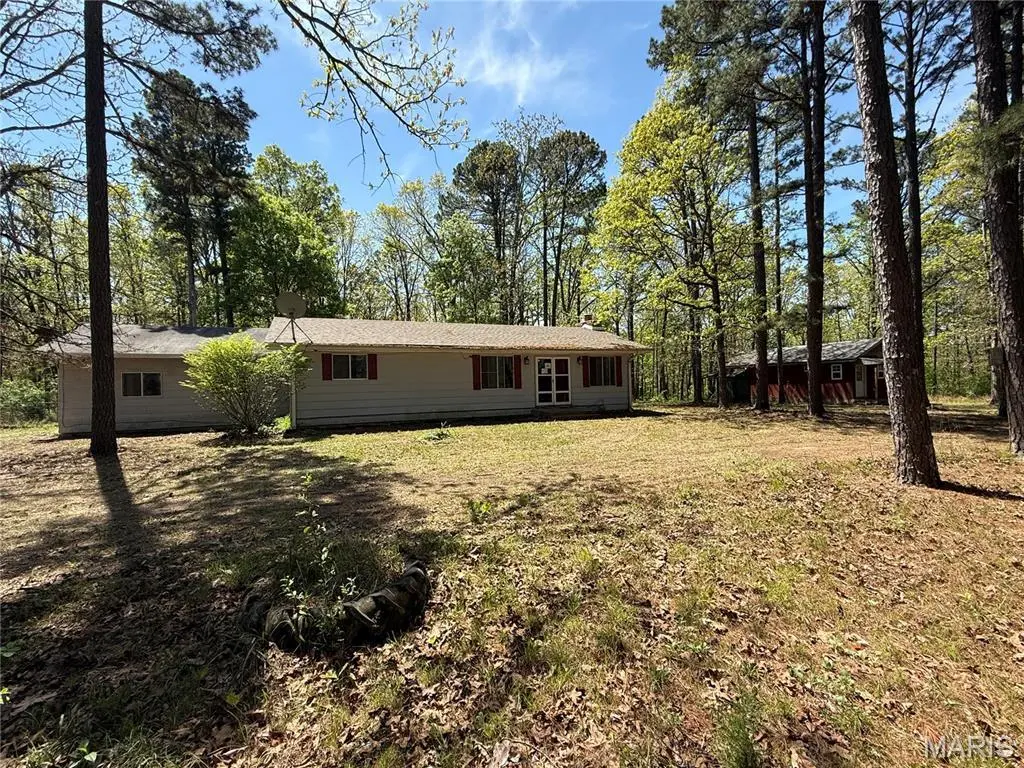
16558 Hwy BB · Licking, MO
Flood risk 1/10 · Minimal
- FEMA flood zone
- —
- Chance of flooding over 30 yrs
- 0.0%
- Est. flood insurance / yr
- —
Fire risk 5/10 · Moderate
- Est. fire insurance / yr
- $1,054 – $1,958
Heat risk 4/10 · Minor
- Hot days now (above 105°F)
- 7 days/yr
- Hot days in 30 yrs
- 19 days/yr
Wind risk 2/10 · Minimal
- Chance of severe wind over 30 yrs
- 0.0%
Air-quality risk 2/10 · Minimal
- Unhealthy air days now
- 0 days/yr
- Unhealthy air days in 30 yrs
- 1 days/yr
Risk factors via First Street. Map © Google.
Why this score? — see what drove the B- grade
The composite is a weighted blend of 9 inputs, each scored 0–100. Each bar is that input's sub-score; the figure is the points it added to the 100-point composite (weight × sub-score).
- Cash flow +26.4/30.0
- DSCR +9.0/10.0
- ARV discount +7.5/15.0
- 1% rule +7.1/10.0
- Appreciation +6.6/10.0
- Livability +3.2/5.0
- Schools +3.0/10.0
- Rent growth +2.5/5.0
- Condition / age +2.5/5.0
$92,900
🖨 Deal sheet (PDF) 📄 Offer letter ✓ Due diligence
Listing remarks MLS
Cozy Ranch Home nestled in among mature trees on 3+ acres!! Make your way inside through double doors to the open living room, embellished with a beautiful brick, wood burning fireplace. The adjoining kitchen and dining area has a center island and breakfast bar. Wonderful space to entertain! Right off of the kitchen is a separate laundry area with lots of room for additional storage. This home has 3 bedrooms (one non conforming bedroom- no window), including the master bedroom with a private bathroom that has a stand up shower. Also included is another full bathroom and a lovely sunroom. The sunroom has sliding glass doors that provide quick access to the back deck overlooking the beautiful property. The shed on the property is a perfect place to enjoy hobbies or can be utilized for storage as well. Make this one yours! Schedule your private showing today!
Key facts
- 3.5 acre lot
- 2 garage spots
- Built 1972
Property features AI
Finance
- Financial info: Annual tax amount reported
Exterior
- Parking: Attached 2-car garage
- Utilities: Public water; Septic tank / lagoon sewage; Electricity connected (220 volts)
- Home design: Single-family residence; One story; Residential property
- Construction: Frame construction
- Exterior features: Back yard; 3.5-acre lot
Interior
- Bedrooms: Three bedrooms on the main level
- Bathrooms: Two full bathrooms on the main level
- Interior features: Forced air heating; Central air conditioning
Neighborhood map
What this means for you Summary
Snapshot
- This is a 3-bed/2.0-bath single-family listed at $93k.
Deal economics
- At list price, monthly cash flow is $243 ($3k/yr) — positive.
- The deal already cash-flows at list — no discount required.
- Meets the 1% rule at list price ($1k rent vs $93k).
- Recommended offer: $92k (1.5% below list) — sets the bar for market timing.
- Cap rate 9.4% vs local median 3.3% in Licking — top-decile yield for the area; either an underpriced asset or a hidden risk that comps aren't pricing in. Stress-test before assuming the spread holds.
Location & tenants
- Location reads 65/100 on livability (#265 in MO) — a middle-class / working-renter tenant base. Strengths: cost of living A+, housing A+, crime B; Watch: amenities F, commute F, employment F.
- Licking R-VIII (rural): math 30% / reading 44% proficiency, ranked #203 of 324 in MO (top 63%) — families likely to look elsewhere, expect single-tenant / working-renter base with shorter leases.
- Zoned schools: Licking Elem. (math 32% / reading 38%, grade F, #672 of 1,115 statewide, top 60%, 416 students, 99% FRL); Licking High (math 27% / reading 52%, grade F, #247 of 521 statewide, top 55%, 423 students, 99% FRL) — zoned schools average 99% FRL vs 51% district-wide (49 pts higher); higher-poverty schools than district average — tighter screening recommended.
- Market conditions: 50 active listings in the ZIP; 10 units permitted in Texas County in 2024 (5 in 5+ unit buildings).
Forward outlook
- In year one you build about $4k of equity ($642 loan paydown + $3k appreciation (3.2% local appreciation)).
- Texas County population projected at -11% by 2050 — secular population decline; favor cash flow + early exit over multi-decade hold.
- At projected returns (3.2% appreciation + 3.0% rent growth), your $26k cash investment doubles in ~4 years — after that, you're playing with house money.
- By year 9, paydown + projected appreciation supports a ~$31k cash-out refi (75% LTV) — recoverable capital for the next deal without selling this one.
Negotiation context
- It's been on market 18 days — a 2% lower offer ($92k) is reasonable based on typical stale-listing flexibility.
- 2 sale attempts since 5y ago with the ask held roughly flat each time — persistent listings suggest the price (not the market) is what's stuck; bring a comps-based counter.
Risks & watch-outs
- Climate carrying-cost: moderate wildfire risk — expect insurance premiums to compound above CPI over the hold.
Questions for the listing agent
- Built in 1972 — when were the roof, HVAC, electrical panel, plumbing, and water heater last replaced?
- Is there a deadline driving the sale (1031 exchange, divorce, estate, relocation)? That informs how much negotiation room exists.
- Schools are F-rated, which usually means shorter tenancies and higher turnover. Who's the typical renter profile here, and what's been the actual vacancy rate?
- What's the average days-on-market for RENTAL listings here right now (not sales)? A rising rental-DOM trend means longer vacancies and softer asking-rent achievability than the comps imply.
- What's the recent tenant-quality profile in this submarket — average credit score on applications, eviction rate, late-payment / NSF rate, and stable-employment percentage? A property-management company in the area should have these aggregated.
- How much new for-sale + rental construction is in the pipeline within 1–3 miles? Heavy new supply typically softens prices + rents 12–24 months out; constrained supply supports both.
Investment metrics
- 1% rule
- 1.21% ✓
- Cap rate
- 9.44%
- Cash-on-cash
- 11.23%
- DSCR
- 1.50
- GRM
- 6.9
CMA / ARV
No comps found within radius.
Projected returns pro-forma
3.19% appreciation · 3.0% rent growth · sell at horizon
- IRR
- 18.5%
- Equity multiple
- 2.06×
- Total profit
- $27,672
- Equity at exit
- $42,794
- IRR
- 19.7%
- Equity multiple
- 3.91×
- Total profit
- $75,637
- Equity at exit
- $66,756
Cash invested: $26,012 (down + closing). Projections, not guarantees.
Landlord ↔ Tenant lean methodology
- Overall (STATE)
- 81 Strongly Landlord-Friendly
- State Missouri
- 81 Strongly Landlord-Friendly · R+10
- County
- — inherits STATE
- City
- — inherits STATE
ZIP-level market 65542
- Home prices YoY
- 1.4%
- Active inventory
- 50
- Price-to-rent
- 6.9×
Monthly cashflow live
- Estimated rent
- $1,121 medium interval (Pro) →
- Mortgage (P&I)
- −$487
- Tax est. 1.5%
- −$116 /mo · $1,394/yr
- Insurance
- −$39
- HOA
- −$0
- Vacancy / Maint / Mgmt
- −$235
- Net cashflow
- $243
Break-even live
Sensitivity live
| Price | -10% $308 | -5% $276 | +0% $243 | +5% $211 | +10% $179 |
|---|---|---|---|---|---|
| Rent | -10% $155 | -5% $199 | +0% $243 | +5% $288 | +10% $332 |
| Rate | -1.0pp $290 | -0.5pp $267 | base $243 | +0.5pp $219 | +1.0pp $195 |
UW: 25.0% down · 7.5% · 30yr · 1.5% tax · 5.0% vac · 8.0% maint · 8.0% mgmt
Financing live
Cash to close
- Down payment
- $23,225
- Closing costs
- $2,787
- Reserves months
- —
- Total cash needed
- —
Loan-product check · same deal, 3 products live
Conventional
25% down · 7.5% · 30yr
- Down + closing
- —
- Monthly P&I
- —
- Monthly cashflow
- —
- DSCR
- —
- Eligible?
- —
Personal DTI + credit; lowest rate.
DSCR
20% down · 8.5% · 30yr
- Down + closing
- —
- Monthly P&I
- —
- Monthly cashflow
- —
- DSCR
- —
- Eligible?
- —
No personal income docs; deal must DSCR.
Hard money
10% down · 12.0% · 12mo
- Down + closing
- —
- Monthly P&I
- —
- Monthly cashflow
- —
- DSCR
- —
- Eligible?
- —
Short-term bridge; refi at stabilization.
Listing history 13 events
-
2026-06-21days on market $92,900 Active 18 DOM
-
2026-06-21days on market $92,900 Active 17 DOM
-
2026-06-18days on market $92,900 Active 15 DOM
-
2026-06-17days on market $92,900 Active 14 DOM
-
2026-06-16days on market $92,900 Active 13 DOM
-
2026-06-15days on market $92,900 Active 12 DOM
-
2026-06-13days on market $92,900 Active 10 DOM
-
2026-06-12days on market $92,900 Active 9 DOM
-
2026-06-09days on market $92,900 Active 6 DOM
-
2026-06-08days on market $92,900 Active 5 DOM
-
2026-06-07days on market $92,900 Active 4 DOM
-
2026-06-07days on market $92,900 Active 3 DOM
-
2026-06-04$92,900 Active 1 DOM
ⓘ Source: listings_history table (triggers on properties + properties_extension) + one-shot
backfill from property_details.listing_events for pre-trigger history.
Climate risk First Street
- Flood 1/10 Low 0% chance over 30 yrs
- Wildfire 5/10 Major
- Heat 4/10 Moderate 7 d/yr ≥105°F today · 19 d/yr by 30 yrs out
- Wind 2/10 Low 0% chance of damaging wind over 30 yrs
- Air quality 2/10 Low 0 unhealthy d/yr today · 1 by 30 yrs out
Nearby sold comps map
Loading sold comps map…
Walkable amenities ~0.75 mi
Loading nearby amenities…
Taxation est. · year 1
- Rental income
- $13,449
- − Mortgage interest
- −$5,204
- − Property taxes
- −$1,394
- − Insurance
- −$464
- − Repairs & maintenance
- −$1,076
- − Management
- −$1,076
- − Depreciation
- −$2,703
- Taxable income
- $1,533
- Est. tax owed @ 24.0%
- −$368
- After-tax cash flow
- $2,553/yr
For passive investors: Depreciation is non-cash, so a rental often shows a tax loss while cash-flowing — sheltering income. Rental losses are passive: they offset passive income freely, and up to $25,000/yr can offset ordinary (W-2) income if you actively participate and your MAGI is under $100k (phasing out to $0 by $150k); unused losses carry forward. On sale, claimed depreciation is recaptured at up to 25%, and gains may owe capital-gains tax (a 1031 exchange can defer both). Figures are a year-1 estimate at your 24.0% rate — not tax advice; consult a CPA.
Schools (NCES district)
- District
- Licking R-VIII
- NCES district ID
- 2918600
- Math proficiency
- 30% ▼ -4.00%
- Reading proficiency
- 44% ▼ -3.00%
- Median HH income
- $33,880
- Composite
- 30.41/100
- National rank
- #6248
- State rank
- #203 of 324 in MO
Livability — Licking
- Score
- 65/100
- State rank
- #265
- US rank
- #12566
Category grades
Schools grade is shown separately in the Schools card above.
Census & demographics
- Population (ZIP)
- 6,921
Population outlook (Texas County) Hauer SSP2
- Today (2025)
- 24,648 people
- By 2030
- 23,981 · -2.7%
- By 2040
- 22,840 · -7.3%
- By 2050
- 21,832 · -11.4%
- By 2075
- 19,481 · -21.0%
- By 2100
- 16,634 · -32.5%
Race, ethnicity, and origin ACS 2023
- Neighborhood character
- Predominantly White (88%)
- Race & ethnicity
- White 88% Black 7% Two or more races 4% Hispanic / Latino 2%
- Common ancestry
- Slovak 3% Serbian 2% Lithuanian 2%
- Foreign-born
- 1% · Canada
- Languages at home
- 97% English-only · Spanish 1% Arabic 1%
Political lean MEDSL · Texas
- 2024 margin
- Solid R (+71.7) · D 13.8% · R 85.5%
- 2008→2024 swing
- -36.7pp toward R · 2008: -35.1pp · 2024: -71.7pp
- All cycles
- 2024: R+71.7 2020: R+68.6 2016: R+65.4 2012: R+44.1 2008: R+35.1
Not yet ingested
- Civics
- —
Market trends
- HPI YoY
- ▲ 3.19%
- Current HPI
- 228.0581
- Rent YoY
- —
- Metro
- —
- State GDP YoY
- ▲ 1.84%
- F500 in state
- 20
Industry mix (Fortune 500 HQ in MO)
| Industry | F500 HQs | Revenue |
|---|---|---|
| Healthcare | 1 | $163B |
|
||
| Insurance | 1 | $21B |
|
||
| Industrial Technology | 1 | $17B |
|
||
| Retail | 1 | $16B |
|
||
| Industrial Distribution | 1 | $10B |
|
||
| Utilities | 1 | $9B |
|
||
Price history
-7.0% since first listed5 events — show timeline
- 2026-06-03 Listed $92,900 MARIS as Distributed by MLS Grid
- 2022-03-23 Sold (MLS) — MARIS as Distributed by MLS Grid
- 2022-01-07 Pending — MARIS as Distributed by MLS Grid
- 2021-12-28 Listed $145,000 MARIS as Distributed by MLS Grid
- 2019-08-15 Price Changed $99,900 MARIS as Distributed by MLS Grid
Cash-flow waterfall
monthlySold comps — $/sqft
last 12 mo · ≤1 miLoading sold comps…