 Duplex
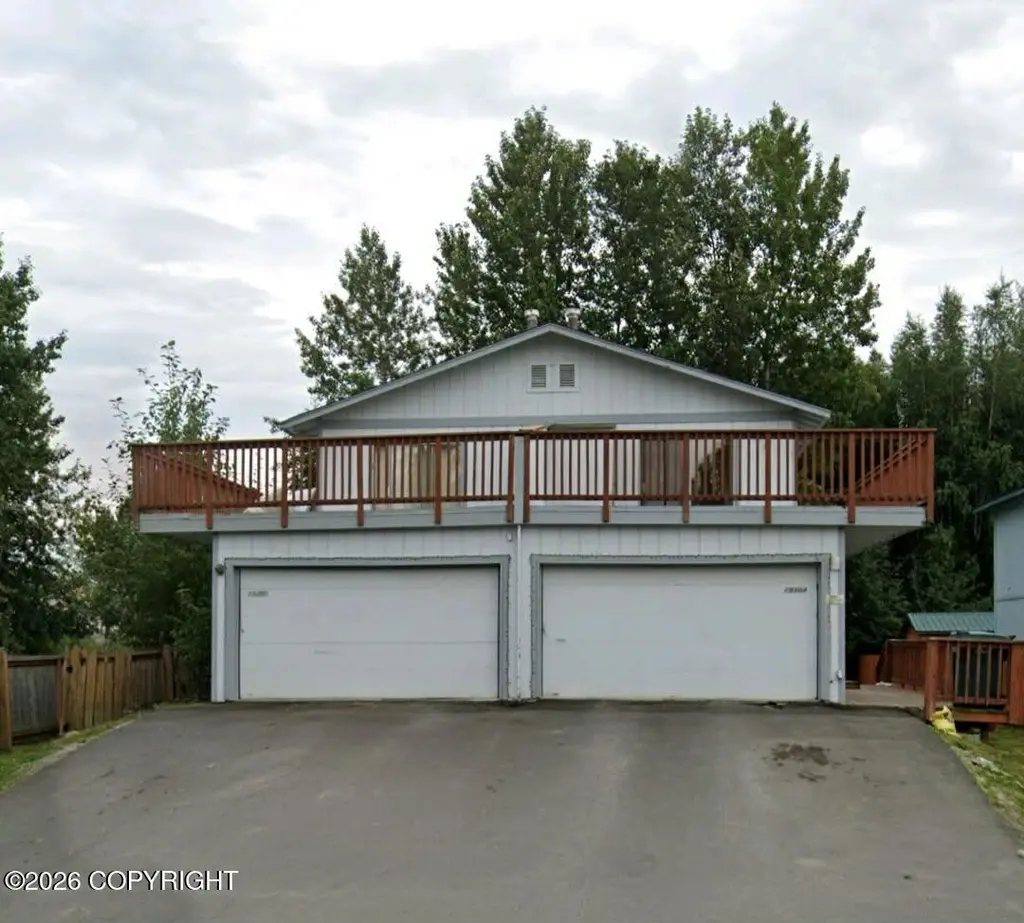
1930 E 72nd Ave · Anchorage, AK
Flood risk 1/10 · Minimal
- FEMA flood zone
- X (unshaded)
- Chance of flooding over 30 yrs
- 0.0%
- Est. flood insurance / yr
- $507 – $1,088
Fire risk No data
- Est. fire insurance / yr
- —
Heat risk No data
- Hot days now (above threshold)
- —
- Hot days in 30 yrs
- —
Wind risk No data
- Chance of severe wind over 30 yrs
- —
Air-quality risk 1/10 · Minimal
- Unhealthy air days now
- —
- Unhealthy air days in 30 yrs
- —
Risk factors via First Street. Map © Google.
Why this score? — see what drove the D grade
The composite is a weighted blend of 9 inputs, each scored 0–100. Each bar is that input's sub-score; the figure is the points it added to the 100-point composite (weight × sub-score).
- Cash flow +11.6/30.0
- ARV discount +10.0/15.0
- Rent growth +4.1/5.0
- Livability +3.9/5.0
- Schools +3.7/10.0
- DSCR +3.4/10.0
- 1% rule +3.3/10.0
- Condition / age +2.5/5.0
- Appreciation +0.0/10.0
$575,000
🖨 Deal sheet (PDF) 📄 Offer letter ✓ Due diligence
Multi-family units
County records classify this as Multi-Family (2-4 Unit). Listing-text estimate: 2 units. confirmed
Listing remarks
Welcome to a place that truly feels like home while offering incredible potential. This inviting duplex is perfect for both investors and owner-occupants. Whether you're looking to live in one unit and rent out the other, or build your portfolio with a solid income property. Inside, you'll find an open living space that feels comfortable, along with freshly painted interiors that give the home a clean, refreshed feel. Step outside to a large backyard with plenty of room to relax, play, or entertain, plus a huge roof deck where you can take in beautiful mountain views and enjoy time with family and friends. With no HOA and a convenient location near shopping, dining, and major roads, this pr
Key facts
- 0.26 acre lot
- 4 garage spots
- Built 1981
Neighborhood map
What this means for you Summary
Snapshot
- This is a 2 × 2-bed/1.5-bath units multifamily listed at $575k.
Deal economics
- At list price, monthly cash flow is $-180 ($-2k/yr) — negative. Per door: $-90/mo.
- To cash-flow at today's rent, offer at most $543k (5.5% below list).
- To meet the 1% rule (rent ≥ 1% of price), the offer needs to be $478k (17.0% below list).
- Recommended offer: $478k (17.0% below list) — sets the bar for 1% rule.
- Cap rate 5.9% vs local median 3.8% in Anchorage — top-decile yield for the area; either an underpriced asset or a hidden risk that comps aren't pricing in. Stress-test before assuming the spread holds.
Location & tenants
- Location reads 78/100 on livability (#6 in AK, #2,553 nationally) — a middle-class / working-renter tenant base. Strengths: amenities A+, commute A+, employment A+; Watch: crime F, cost of living F.
- Anchorage School District (urban): math 37% / reading 43% proficiency, ranked #6 of 21 in AK (top 29%) — families likely to look elsewhere, expect single-tenant / working-renter base with shorter leases.
- Zoned schools: Abbott Loop Elementary (math 17% / reading 27%, grade F, #128 of 156 statewide, top 86%, 248 students, 75% FRL); Hanshew Middle School (math 24% / reading 37%, grade F, #27 of 36 statewide, top 74%, 691 students, 42% FRL); Service High School (math 40% / reading 41%, grade F, #21 of 61 statewide, top 33%, 1,544 students, 28% FRL).
- Market conditions: Rents rising fast (+6.3%/yr); 197 active listings in the ZIP; 1 comparable units currently listed for rent nearby; solid renter incomes; 306 units permitted in Anchorage Municipality in 2024 (90 in 5+ unit buildings).
- At $4,775/mo this rent would consume 53% of the median local household income ($108k/yr) (locally 775% of renters already pay >50% of income on rent) — very limited rent-growth headroom before tenants either downsize or default.
Forward outlook
- Local home prices are declining (-3.0%/yr); year-one equity from $4k of loan paydown is wiped out by about $17k of value loss. Plan a longer hold.
- Anchorage County population projected at +12% by 2050 — modest demand growth; plan on rents tracking national, not racing it.
Negotiation context
- Only 3 days on market — expect competitive offers; lowballing is unlikely to land.
- 5 sale attempts since 10y ago; this cycle's ask is 25% above the opening price — seller raised mid-cycle; expect resistance to lowballs.
Questions for the listing agent
- What do current leases actually rent for vs. the listed asking? Can we see a recent rent roll and the last 12 months of T-12 income?
- Can we see the unit-by-unit rent roll, current vacancy, and any below-market leases? What's the average tenancy length?
- What capital expenditures (roof, boiler, parking lot, exteriors) have been made in the last 5 years, and what's planned in the next 2?
- Is there a deadline driving the sale (1031 exchange, divorce, estate, relocation)? That informs how much negotiation room exists.
- Schools are B-rated — typically a magnet for longer-tenancy family renters. What's the average tenant stay here, and is there a school-zone premium baked into asking?
- Crime grade is F in this area — have there been break-ins, vandalism, or insurance claims at this property in the last 3 years? What carrier currently insures it and at what premium?
- The area grade is low — what's the realistic commute time and amenity access for the typical tenant pool here? Any planned neighborhood developments (good or bad) we should know about?
- What's the average days-on-market for RENTAL listings here right now (not sales)? A rising rental-DOM trend means longer vacancies and softer asking-rent achievability than the comps imply.
- What's the recent tenant-quality profile in this submarket — average credit score on applications, eviction rate, late-payment / NSF rate, and stable-employment percentage? A property-management company in the area should have these aggregated.
- How much new apartment / multifamily construction is in the pipeline within 1–3 miles? Heavy new supply (>2% of stock underway) typically softens rents 12–24 months out; light construction supports rent growth.
Investment metrics
- 1% rule
- 0.83% ✗
- Cap rate
- 5.92%
- Cash-on-cash
- -1.34%
- DSCR
- 0.94
- GRM
- 10.0
CMA / ARV
- ARV (median comp)
- $609,232
- List price
- $575,000
- Delta
- -5.62%
- Verdict
- FAIR
- Comps
- 18 within 1.0 mi
Show comp detail 1 sale within ~0.75 mi
| Address | Dist | Beds/Ba | Sqft | Sold | Price | $/sf | Match |
|---|---|---|---|---|---|---|---|
| 6969 Stella Pl | 0.24mi | 3/3.5 (-1) | 2,556 (-1%) | 23mo | $589,900 | $231 | 61 |
Match score weights: distance 35% · size 25% · config 20% · recency 20%. Top-matched comps best support the ARV.
Projected returns pro-forma
-3.0% appreciation · 6.35% rent growth · sell at horizon
- IRR
- -14.8%
- Equity multiple
- 0.45×
- Total profit
- $-87,934
- Equity at exit
- $85,734
- IRR
- -1.4%
- Equity multiple
- 0.89×
- Total profit
- $-17,948
- Equity at exit
- $49,715
Cash invested: $161,000 (down + closing). Projections, not guarantees.
Landlord ↔ Tenant lean methodology
- Overall (STATE)
- 80 Strongly Landlord-Friendly
- State Alaska
- 80 Strongly Landlord-Friendly · R+8
- County
- — inherits STATE
- City
- — inherits STATE
ZIP-level market 99507
- Rents YoY
- 6.3%
- Active inventory
- 197
- Price-to-rent
- 20.1×
Monthly cashflow live
- Estimated rent
- $4,775 high interval (Pro) →
- Mortgage (P&I)
- −$3,015
- Tax from tax record
- −$697 /mo · $8,366/yr
- Insurance
- −$240
- HOA
- −$0
- Vacancy / Maint / Mgmt
- −$1,003
- Net cashflow
- $-180
Break-even live
Sensitivity live
| Price | -10% $146 | -5% $-17 | +0% $-180 | +5% $-343 | +10% $-505 |
|---|---|---|---|---|---|
| Rent | -10% $-557 | -5% $-368 | +0% $-180 | +5% $9 | +10% $197 |
| Rate | -1.0pp $110 | -0.5pp $-34 | base $-180 | +0.5pp $-329 | +1.0pp $-480 |
2-unit breakdown (identical units grouped — click to expand)
| Units | Beds | Baths | Est. rent |
|---|---|---|---|
| 2× units | 2 | 1.5 | $4,776 |
| #1 | 2 | 1.5 | $2,388 |
| #2 | 2 | 1.5 | $2,388 |
| Total (2 units) | $4,775 | ||
UW: 25.0% down · 7.5% · 30yr · 1.5% tax · 5.0% vac · 8.0% maint · 8.0% mgmt
Financing live
Cash to close
- Down payment
- $143,750
- Closing costs
- $17,250
- Reserves months
- —
- Total cash needed
- —
Loan-product check · same deal, 3 products live
Conventional
25% down · 7.5% · 30yr
- Down + closing
- —
- Monthly P&I
- —
- Monthly cashflow
- —
- DSCR
- —
- Eligible?
- —
Personal DTI + credit; lowest rate.
DSCR
20% down · 8.5% · 30yr
- Down + closing
- —
- Monthly P&I
- —
- Monthly cashflow
- —
- DSCR
- —
- Eligible?
- —
No personal income docs; deal must DSCR.
Hard money
10% down · 12.0% · 12mo
- Down + closing
- —
- Monthly P&I
- —
- Monthly cashflow
- —
- DSCR
- —
- Eligible?
- —
Short-term bridge; refi at stabilization.
Rent comps 1 comps
| Address | Beds | Baths | Sqft | Rent | $/sqft | DOM | Units | Dist |
|---|---|---|---|---|---|---|---|---|
| 635 E 73rd Ave Anchorage, AK | 4.0 | 2.5 | 3045 | $4,800 | $1.58 | 45d | 1 | 0.81mi |
Listing history 15 events
-
2026-06-22days on market $575,000 Active 3 DOM
-
2026-06-18statusdays on market $575,000 Active 1 DOM
-
2026-04-24status Active
-
2026-04-05status Pending
-
2024-06-05soldstatus
-
2021-11-07status Active
-
2021-11-04status Pending
-
2021-10-28status Active
-
2021-10-16status Pending
-
2021-09-14price $439,000
-
2021-07-01$459,000 Active
-
2016-05-13$424,900
-
2010-03-24soldstatus
-
2004-11-30soldstatus
-
2003-09-11soldstatus
ⓘ Source: listings_history table (triggers on properties + properties_extension) + one-shot
backfill from property_details.listing_events for pre-trigger history.
Tax reassessment forecast AK · Partial reset (capped growth)
- Current annual tax
- $8,366 · $697/mo
- Projected year-2 tax
- $8,366 · $697/mo
- Expected delta
- $0/yr ($0/mo · 0.0%)
ⓘ Screening estimate from a state-policy table — verify with the county assessor before closing.
Climate risk First Street
- Flood 1/10 Low FEMA zone X (unshaded) · 0% chance over 30 yrs
- Air quality 1/10 Low
Nearby sold comps map
Loading sold comps map…
Walkable amenities ~0.75 mi
Loading nearby amenities…
Taxation est. · year 1
- Rental income
- $57,300
- − Mortgage interest
- −$32,209
- − Property taxes
- −$8,366
- − Insurance
- −$2,875
- − Repairs & maintenance
- −$4,584
- − Management
- −$4,584
- − Depreciation
- −$16,727
- Taxable loss
- −$12,045
- Est. tax savings @ 24.0%
- +$2,891
- After-tax cash flow
- $733/yr
For passive investors: Depreciation is non-cash, so a rental often shows a tax loss while cash-flowing — sheltering income. Rental losses are passive: they offset passive income freely, and up to $25,000/yr can offset ordinary (W-2) income if you actively participate and your MAGI is under $100k (phasing out to $0 by $150k); unused losses carry forward. On sale, claimed depreciation is recaptured at up to 25%, and gains may owe capital-gains tax (a 1031 exchange can defer both). Figures are a year-1 estimate at your 24.0% rate — not tax advice; consult a CPA.
Schools (NCES district)
- District
- Anchorage School District
- NCES district ID
- 0200180
- Math proficiency
- 37% ▼ -2.00%
- Reading proficiency
- 43% ▲ 1.00%
- Median HH income
- $76,447
- Composite
- 37.0/100
- National rank
- #4523
- State rank
- #6 of 21 in AK
Livability — Anchorage
- Score
- 78/100
- State rank
- #6
- US rank
- #2553
Category grades
Schools grade is shown separately in the Schools card above.
Census & demographics
- Census place
- Anchorage, AK
- County
- Anchorage Borough · 246,594 people
- City population
- 218,117
- Metro
- Anchorage, AK
- Population (ZIP)
- 37,301
- Household income
- $107,992
- Rent vs Own
- Severe rent burden
- 775.0
Population outlook (Anchorage County) Hauer SSP2
- Today (2025)
- 314,993 people
- By 2030
- 321,771 · +2.2%
- By 2040
- 335,493 · +6.5%
- By 2050
- 352,799 · +12.0%
- By 2075
- 414,771 · +31.7%
- By 2100
- 474,485 · +50.6%
Race, ethnicity, and origin ACS 2023
- Neighborhood character
- Diverse neighborhood (Simpson 0.68)
- Race & ethnicity
- White 53% Asian 16% Two or more races 11% Hispanic / Latino 9% Native American 6% Black 4% Pacific Islander 3%
- Hispanic origin (detail)
- Mexican 4% Puerto Rican 1%
- Common ancestry
- Portuguese 3% Romanian 2% Lithuanian 2%
- Foreign-born
- 16% · Canada, South Korea, China
- Languages at home
- 78% English-only · Tagalog/Filipino 8% Other Asian/Pacific 4% Spanish 3%
Political lean MEDSL · Anchorage
- 2024 margin
- D (+12.7) · D 56.3% · R 43.7%
- 2016→2024 swing
- +27.9pp toward D · 2016: -15.2pp · 2024: 12.7pp
- All cycles
- 2024: D+12.7 2016: R+15.2
Not yet ingested
- Civics
- —
Market trends
- HPI YoY
- ▼ -216.29%
- Current HPI
- 273.1227
- Rent YoY
- ▲ 6.35%
- Metro
- Anchorage, AK
- State GDP YoY
- —
- F500 in state
- 0
Price history
+3.3% since first listed13 events — show timeline
- 2026-04-24 Relisted — AKMLS
- 2026-04-05 Pending — AKMLS
- 2024-06-05 Sold (Public Records) — Public Records
- 2021-11-07 Relisted — AKMLS
- 2021-11-04 Pending — AKMLS
- 2021-10-28 Relisted — AKMLS
- 2021-10-16 Pending — AKMLS
- 2021-09-14 Price Changed $439,000 AKMLS
- 2021-07-01 Listed $459,000 AKMLS
- 2016-05-13 Listed $424,900 AKMLS
- 2010-03-24 Sold (Public Records) — Public Records
- 2004-11-30 Sold (Public Records) — Public Records
- 2003-09-11 Sold (Public Records) — Public Records
Property tax history
+4.3%/yrLatest (2025): $8,366 · +4.0% YoY. Source: county tax records.
Cash-flow waterfall
monthlySold comps — $/sqft
last 12 mo · ≤1 miLoading sold comps…