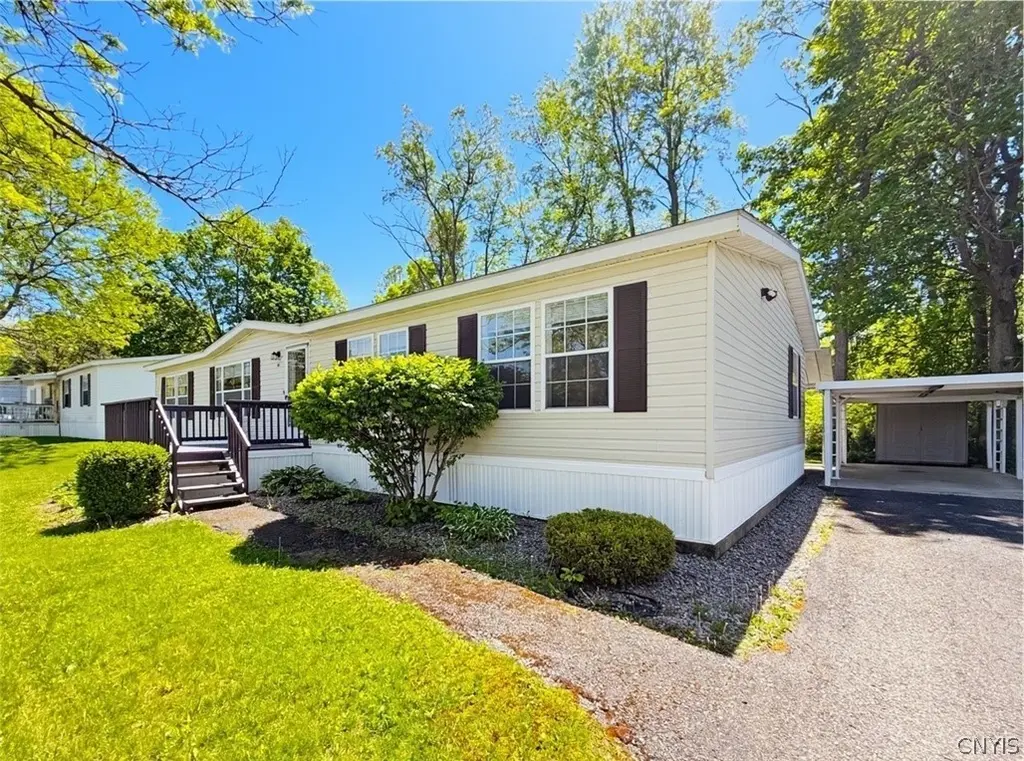
84 Millstream Ct · Clark Mills, NY
Flood risk 1/10 · Minimal
- FEMA flood zone
- X (unshaded)
- Chance of flooding over 30 yrs
- 0.0%
- Est. flood insurance / yr
- $507 – $1,088
Fire risk 1/10 · Minimal
- Est. fire insurance / yr
- $691 – $1,283
Heat risk 3/10 · Minor
- Hot days now (above 95°F)
- 7 days/yr
- Hot days in 30 yrs
- 17 days/yr
Wind risk 1/10 · Minimal
- Chance of severe wind over 30 yrs
- 0.0%
Air-quality risk 2/10 · Minimal
- Unhealthy air days now
- 0 days/yr
- Unhealthy air days in 30 yrs
- 2 days/yr
Risk factors via First Street. Map © Google.
Why this score? — see what drove the A- grade
The composite is a weighted blend of 9 inputs, each scored 0–100. Each bar is that input's sub-score; the figure is the points it added to the 100-point composite (weight × sub-score).
- Cash flow +30.0/30.0
- ARV discount +12.1/15.0
- 1% rule +10.0/10.0
- DSCR +10.0/10.0
- Appreciation +5.5/10.0
- Schools +5.5/10.0
- Condition / age +4.0/5.0
- Livability +3.6/5.0
- Rent growth +2.5/5.0
$99,900
🖨 Deal sheet (PDF) 📄 Offer letter ✓ Due diligence
Listing remarks
This spacious 3-bedroom, 2-bathroom double wide offers a great layout and plenty of room to spread out! The home features a fantastic primary suite with plenty of space, a walk-in closet, double sinks, and a shower with built-in seats. The two additional bedrooms and second full bathroom are located on the opposite side of the home, offering extra privacy and a functional layout. With over 1,500 square feet of living space, this home features central air, a gas stove, a garbage disposal, and all appliances — including the washer and dryer — will stay! The kitchen is large enough for a table, but you also have a separate dining room and living room. Need even more space? There&rs
Key facts
- Double sinks
- Walk-in closet
- Primary suite
Tags
Property features AI
Finance
- Other: Lot is rectangular with private road frontage (dimensions 40 x 80)
- HOA & community: Monthly land-lease: $610
Exterior
- Parking: No garage
- Utilities: Public water connected; Sewer connected; Electricity connected (circuit breakers); High-speed internet available; Cable available
- Home design: Single-story (1 story); Double-wide mobile home; Exterior facing not specified; Resale property
- Construction: Vinyl siding; Spray foam insulation; Asphalt shingle roof; Poured foundation; Existing (pre-owned) structure; Built as double-wide
- Exterior features: Blacktop driveway; Open porch; Deck; Shed(s)/storage
Interior
- Kitchen: Gas oven; Gas range; Dishwasher; Refrigerator; Eat-in kitchen
- Bedrooms: 3 main-level bedrooms
- Flooring: Laminate; Vinyl; Varied flooring
- Bathrooms: 2 full bathrooms (both on main level)
- Heating & cooling: Gas forced-air heating; Central air conditioning
- Interior features: Ceiling fan(s); Entrance foyer; Den; Eat-in kitchen; Separate/formal living room; Sliding glass door(s); Skylights; Thermal windows; Sliding doors; Bedroom on main level; Main level primary; Primary suite
- Laundry & utility: Washer and dryer on main level; Gas water heater
Neighborhood map
What this means for you Summary
Snapshot
- This is a 3-bed/2.0-bath manufactured listed at $100k. Condition is rated good.
Deal economics
- At list price, monthly cash flow is $654 ($8k/yr) — positive.
- The deal already cash-flows at list — no discount required.
- Meets the 1% rule at list price ($2k rent vs $100k).
- Recommended offer: $98k (1.5% below list) — sets the bar for market timing.
Location & tenants
- Location reads 71/100 on livability (#383 in NY) — a middle-class / working-renter tenant base. Strengths: housing A+, health & safety A+, crime A; Watch: schools D-, amenities F, commute F.
- Clinton Central School District (suburban): math 57% / reading 71% proficiency, ranked #185 of 590 in NY (top 31%) — acceptable for families but not a draw, mixed tenant base, ~2y average lease; only 17% free/reduced lunch — higher-income household profile.
- Market conditions: 8 active listings in the ZIP; 4 comparable units currently listed for rent nearby; rentals lingering (median 44d on market — plan ~5-8 weeks vacancy on turnover, expect pricing pressure); 100% of comp listings sitting > 30 days — soft ceiling on asking rent; 204 units permitted in Oneida County in 2024 (68 in 5+ unit buildings).
Forward outlook
- In year one you build about $2k of equity ($691 loan paydown + $977 appreciation (1.0% local appreciation)).
- Oneida County population projected at -12% by 2050 — secular population decline; favor cash flow + early exit over multi-decade hold.
- At projected returns (1.0% appreciation + 3.0% rent growth), your $28k cash investment doubles in ~3 years — after that, you're playing with house money.
Negotiation context
- It's been on market 22 days — a 2% lower offer ($98k) is reasonable based on typical stale-listing flexibility.
Risks & watch-outs
- Watch-outs: HOA is 25% of rent.
Questions for the listing agent
- What does the HOA fee cover, when was the last increase, and are there any pending special assessments or reserve-fund shortfalls?
- Is there a deadline driving the sale (1031 exchange, divorce, estate, relocation)? That informs how much negotiation room exists.
- Schools are D-rated, which usually means shorter tenancies and higher turnover. Who's the typical renter profile here, and what's been the actual vacancy rate?
- What's the average days-on-market for RENTAL listings here right now (not sales)? A rising rental-DOM trend means longer vacancies and softer asking-rent achievability than the comps imply.
- What's the recent tenant-quality profile in this submarket — average credit score on applications, eviction rate, late-payment / NSF rate, and stable-employment percentage? A property-management company in the area should have these aggregated.
- How much new for-sale + rental construction is in the pipeline within 1–3 miles? Heavy new supply typically softens prices + rents 12–24 months out; constrained supply supports both.
Investment metrics
- 1% rule
- 2.48% ✓
- Cap rate
- 14.14%
- Cash-on-cash
- 28.04%
- DSCR
- 2.25
- GRM
- 3.4
CMA / ARV
- ARV (on-the-fly)
- $111,328
- Comps found
- 12
Show comp detail 12 sales within ~0.75 mi
| Address | Dist | Beds/Ba | Sqft | Sold | Price | $/sf | Match |
|---|---|---|---|---|---|---|---|
| 512 Patricia Dr | 0.29mi | 3/2.0 | 1,536 (-2%) | 6mo | $100,000 | $65 | 78 |
| 621 Barbara Ave | 0.31mi | 3/2.0 | 1,536 (-2%) | 10mo | $122,000 | $79 | 74 |
| 17 Hickory Dr | 0.08mi | 3/2.0 | 1,680 (+7%) | 19mo | $127,900 | $76 | 69 |
| 2 Treestump Dr | 0.10mi | 3/2.0 | 1,344 (-14%) | 4mo | $67,000 | $50 | 68 |
| 7 Hickory Dr | 0.07mi | 3/2.0 | 1,736 (+11%) | 14mo | $122,500 | $71 | 67 |
| 144 Anthony Ln | 0.21mi | 3/2.0 | 1,764 (+12%) | 4mo | $68,000 | $39 | 66 |
| 320 Matthew Dr | 0.28mi | 3/2.0 | 1,716 (+9%) | 12mo | $125,000 | $73 | 61 |
| 313 Gracie Pl | 0.54mi | 2/2.0 (-1) | 1,568 (0%) | 13mo | $239,900 | $153 | 59 |
| 131 Royal Meadows Dr | 0.28mi | 3/2.0 | 1,404 (-10%) | 13mo | $93,000 | $66 | 59 |
| 19 Cherrywood | 0.69mi | 3/2.0 | 1,500 (-4%) | 8mo | $263,000 | $175 | 53 |
| 139 Royal Meadows Dr | 0.42mi | 3/2.0 | 1,792 (+14%) | 5mo | $126,000 | $70 | 52 |
| 134 Royal Meadows Dr | 0.42mi | 3/2.0 | 1,405 (-10%) | 18mo | $95,000 | $68 | 48 |
Match score weights: distance 35% · size 25% · config 20% · recency 20%. Top-matched comps best support the ARV.
Projected returns pro-forma
0.98% appreciation · 3.0% rent growth · sell at horizon
- IRR
- 30.5%
- Equity multiple
- 2.57×
- Total profit
- $43,801
- Equity at exit
- $33,992
- IRR
- 33.1%
- Equity multiple
- 5.01×
- Total profit
- $112,046
- Equity at exit
- $45,085
Cash invested: $27,972 (down + closing). Projections, not guarantees.
Landlord ↔ Tenant lean methodology
- Overall (STATE)
- 15 Strongly Tenant-Friendly
- State New York
- 15 Strongly Tenant-Friendly · D+10
- County
- — inherits STATE
- City
- — inherits STATE
ZIP-level market 13321
- Home prices YoY
- 0.3%
- Active inventory
- 8
- Price-to-rent
- 3.4×
Monthly cashflow live
- Estimated rent
- $2,473 medium interval (Pro) →
- Mortgage (P&I)
- −$524
- Tax est. 1.5%
- −$125 /mo · $1,498/yr
- Insurance
- −$42
- HOA
- −$610
- Vacancy / Maint / Mgmt
- −$519
- Net cashflow
- $654
Break-even live
Sensitivity live
| Price | -10% $723 | -5% $688 | +0% $654 | +5% $619 | +10% $585 |
|---|---|---|---|---|---|
| Rent | -10% $458 | -5% $556 | +0% $654 | +5% $751 | +10% $849 |
| Rate | -1.0pp $704 | -0.5pp $679 | base $654 | +0.5pp $628 | +1.0pp $601 |
UW: 25.0% down · 7.5% · 30yr · 1.5% tax · 5.0% vac · 8.0% maint · 8.0% mgmt
Financing live
Cash to close
- Down payment
- $24,975
- Closing costs
- $2,997
- Reserves months
- —
- Total cash needed
- —
Loan-product check · same deal, 3 products live
Conventional
25% down · 7.5% · 30yr
- Down + closing
- —
- Monthly P&I
- —
- Monthly cashflow
- —
- DSCR
- —
- Eligible?
- —
Personal DTI + credit; lowest rate.
DSCR
20% down · 8.5% · 30yr
- Down + closing
- —
- Monthly P&I
- —
- Monthly cashflow
- —
- DSCR
- —
- Eligible?
- —
No personal income docs; deal must DSCR.
Hard money
10% down · 12.0% · 12mo
- Down + closing
- —
- Monthly P&I
- —
- Monthly cashflow
- —
- DSCR
- —
- Eligible?
- —
Short-term bridge; refi at stabilization.
Rent comps 4 comps
| Address | Beds | Baths | Sqft | Rent | $/sqft | DOM | Units | Dist |
|---|---|---|---|---|---|---|---|---|
| 105 Pheasants Run Clinton, NY | 2.0 | 1.5 | 1050 | $2,150 | $2.05 | 44d | 1 | 0.45mi |
| 122 Pheasants Run Kirkland, NY | 2.0 | 2.0 | 1200 | $3,100 | $2.58 | 44d | 1 | 0.48mi |
| 135 Pheasants Run Clark Mills, NY | 2.0 | 1.5 | 1100 | $2,350 | $2.14 | 44d | 1 | 0.50mi |
| 130 Pheasants Run Clinton, NY | 2.0 | 1.5 | 1200 | $2,250 | $1.88 | 44d | 1 | 0.52mi |
HOA detail
- Monthly dues
- $610 · $7,320/yr
- Likely covers
- trashgas
Listing history 18 events
-
2026-06-19days on market $99,900 Active 22 DOM
-
2026-06-18days on market $99,900 Active 21 DOM
-
2026-06-17days on market $99,900 Active 20 DOM
-
2026-06-16days on market $99,900 Active 19 DOM
-
2026-06-15days on market $99,900 Active 18 DOM
-
2026-06-14days on market $99,900 Active 16 DOM
-
2026-06-13days on market $99,900 Active 15 DOM
-
2026-06-10days on market $99,900 Active 13 DOM
-
2026-06-09days on market $99,900 Active 12 DOM
-
2026-06-08days on market $99,900 Active 11 DOM
-
2026-06-07days on market $99,900 Active 10 DOM
-
2026-06-05days on market $99,900 Active 7 DOM
-
2026-06-03days on market $99,900 Active 6 DOM
-
2026-06-02days on market $99,900 Active 5 DOM
-
2026-06-01days on market $99,900 Active 4 DOM
-
2026-05-31days on market $99,900 Active 3 DOM
-
2026-05-30days on market $99,900 Active 2 DOM
-
2026-05-28$99,900 Active
ⓘ Source: listings_history table (triggers on properties + properties_extension) + one-shot
backfill from property_details.listing_events for pre-trigger history.
Climate risk First Street
- Flood 1/10 Low FEMA zone X (unshaded) · 0% chance over 30 yrs
- Wildfire 1/10 Low
- Heat 3/10 Moderate 7 d/yr ≥95°F today · 17 d/yr by 30 yrs out
- Wind 1/10 Low 0% chance of damaging wind over 30 yrs
- Air quality 2/10 Low 0 unhealthy d/yr today · 2 by 30 yrs out
Nearby sold comps map
Loading sold comps map…
Walkable amenities ~0.75 mi
Loading nearby amenities…
Taxation est. · year 1
- Rental income
- $29,680
- − Mortgage interest
- −$5,596
- − Property taxes
- −$1,498
- − Insurance
- −$500
- − Repairs & maintenance
- −$2,374
- − Management
- −$2,374
- − HOA
- −$7,320
- − Depreciation
- −$2,906
- Taxable income
- $7,111
- Est. tax owed @ 24.0%
- −$1,707
- After-tax cash flow
- $6,136/yr
For passive investors: Depreciation is non-cash, so a rental often shows a tax loss while cash-flowing — sheltering income. Rental losses are passive: they offset passive income freely, and up to $25,000/yr can offset ordinary (W-2) income if you actively participate and your MAGI is under $100k (phasing out to $0 by $150k); unused losses carry forward. On sale, claimed depreciation is recaptured at up to 25%, and gains may owe capital-gains tax (a 1031 exchange can defer both). Figures are a year-1 estimate at your 24.0% rate — not tax advice; consult a CPA.
Condition & rehab AI · 1 photo
This well-maintained, move-in-ready manufactured home offers a spacious layout and is ready for a new owner or tenant.
Value-add opportunities
- Both Paint exterior — Enhances curb appeal and value
- Both Landscaping — Improves curb appeal and rental value
- Both Replace windows — Improves energy efficiency and value
Renovation cost estimate screening
Value-add ROI direction
- Both Paint exterior — Enhances curb appeal and value ↑
- Both Landscaping — Improves curb appeal and rental value ↑
- Both Replace windows — Improves energy efficiency and value ↑
ⓘ Cost ranges are severity-bucket heuristics (US national rule-of-thumb). Get contractor quotes + a written scope before underwriting a rehab budget.
Schools (NCES district)
- District
- Clinton Central School District
- NCES district ID
- 3607770
- Math proficiency
- 57% ▼ -11.00%
- Reading proficiency
- 71% ▲ 6.00%
- Median HH income
- $57,439
- Composite
- 55.05/100
- National rank
- #1290
- State rank
- #185 of 590 in NY
Livability — Clark Mills
- Score
- 71/100
- State rank
- #383
- US rank
- #6606
Category grades
Schools grade is shown separately in the Schools card above.
Census & demographics
- Census place
- Clark Mills, NY
- City population
- 815
- Population (ZIP)
- 815
Population outlook (Oneida County) Hauer SSP2
- Today (2025)
- 225,223 people
- By 2030
- 220,384 · -2.1%
- By 2040
- 209,071 · -7.2%
- By 2050
- 197,920 · -12.1%
- By 2075
- 175,541 · -22.1%
- By 2100
- 148,491 · -34.1%
Race, ethnicity, and origin ACS 2023
- Neighborhood character
- Predominantly White (92%)
- Race & ethnicity
- White 92% Hispanic / Latino 7%
- Hispanic origin (detail)
- Mexican 7%
- Common ancestry
- Subsaharan African 11% Romanian 8% Lithuanian 4%
- Foreign-born
- 7% · Canada
Political lean MEDSL · Oneida
- 2024 margin
- Strong R (+21.3) · D 39.4% · R 60.6%
- 2008→2024 swing
- -15.2pp toward R · 2008: -6.1pp · 2024: -21.3pp
- All cycles
- 2024: R+21.3 2020: R+15.5 2016: R+21.1 2012: R+5.3 2008: R+6.1
Not yet ingested
- Civics
- —
Market trends
- HPI YoY
- ▲ 0.98%
- Current HPI
- 281.0024
- Rent YoY
- —
- Metro
- —
- State GDP YoY
- ▲ 2.60%
- F500 in state
- 92
Industry mix (Fortune 500 HQ in NY)
| Industry | F500 HQs | Revenue |
|---|---|---|
| Financial Services | 10 | $950B |
|
||
| Consumer Goods | 9 | $162B |
|
||
| Insurance | 4 | $225B |
|
||
| Telecommunications | 2 | $144B |
|
||
| Pharmaceuticals | 2 | $112B |
|
||
| Media / Entertainment | 2 | $69B |
|
||
Price history
1 event — show timeline
- 2026-05-28 Listed $99,900 CNYIS
Cash-flow waterfall
monthlySold comps — $/sqft
last 12 mo · ≤1 miLoading sold comps…