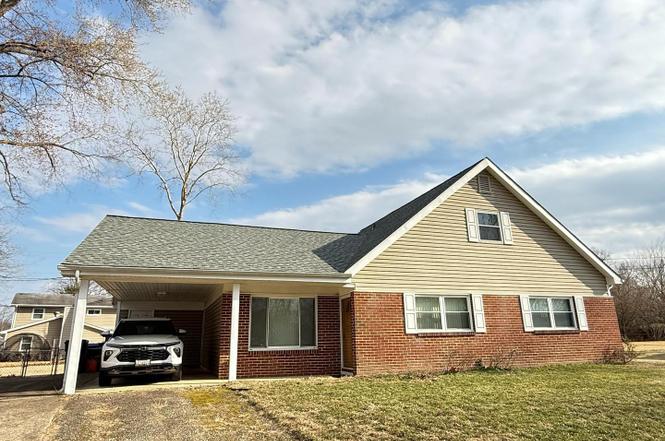
1111 Stone Ct · Waldorf, MD
Flood risk 1/10 · Minimal
- FEMA flood zone
- X (unshaded)
- Chance of flooding over 30 yrs
- 0.0%
- Est. flood insurance / yr
- $507 – $1,088
Fire risk 2/10 · Minimal
- Est. fire insurance / yr
- $755 – $1,403
Heat risk 8/10 · Major
- Hot days now (above 103°F)
- 7 days/yr
- Hot days in 30 yrs
- 16 days/yr
Wind risk 6/10 · Moderate
- Chance of severe wind over 30 yrs
- 27.0%
Air-quality risk 2/10 · Minimal
- Unhealthy air days now
- 1 days/yr
- Unhealthy air days in 30 yrs
- 2 days/yr
Risk factors via First Street. Map © Google.
Why this score? — see what drove the C- grade
The composite is a weighted blend of 9 inputs, each scored 0–100. Each bar is that input's sub-score; the figure is the points it added to the 100-point composite (weight × sub-score).
- Cash flow +15.9/30.0
- ARV discount +14.4/15.0
- DSCR +4.9/10.0
- 1% rule +4.1/10.0
- Livability +3.6/5.0
- Rent growth +2.5/5.0
- Condition / age +2.5/5.0
- Schools +2.3/10.0
- Appreciation +0.0/10.0
$350,000
🖨 Deal sheet (PDF) 📄 Offer letter ✓ Due diligence
Listing remarks
Sitting on a true cul-de-sac in Waldorf's Carrington subdivision, this solid Cape Cod delivers exactly what owner-occupants are searching for — a large, level, fully fenced lot with room to breathe, play, garden, or simply enjoy your own private outdoor space without through traffic or noise. Inside, the layout makes smart use of every square foot. The spacious formal living room flows naturally into a formal dining room with built-in shelving, then into the kitchen. A separate dining nook opens through French doors directly to the rear patio, ideal for morning coffee, grilling, or seamless indoor-outdoor entertaining. The main level hosts the primary bedroom plus two additional bedro
Key facts
- 0.25 acre lot
- Parking
- Community pool
Neighborhood map
What this means for you Summary
Snapshot
- This is a 5-bed/2.0-bath single-family listed at $350k.
Deal economics
- At list price, monthly cash flow is $168 ($2k/yr) — positive.
- The deal already cash-flows at list — no discount required.
- To meet the 1% rule (rent ≥ 1% of price), the offer needs to be $317k (9.4% below list).
- Recommended offer: $317k (9.4% below list) — sets the bar for 1% rule.
- Cap rate 6.9% vs local median 4.8% in Waldorf — top-decile yield for the area; either an underpriced asset or a hidden risk that comps aren't pricing in. Stress-test before assuming the spread holds.
Location & tenants
- Location reads 72/100 on livability (#141 in MD) — a middle-class / working-renter tenant base. Strengths: commute A+, employment A+, housing A+; Watch: crime D-, amenities F, cost of living F.
- Charles County Public Schools (suburban): math 13% / reading 29% proficiency, ranked #14 of 24 in MD (top 58%) — low school quality limits family demand, transient renter base, plan for 1-2y turnover.
- Zoned schools: Arthur Middleton Elementary School (math 6% / reading 9%, grade F, #681 of 860 statewide, top 81%, 619 students, 52% FRL); Benjamin Stoddert Middle School (math 7% / reading 26%, grade F, #174 of 225 statewide, top 81%, 925 students, 59% FRL); St. Charles High School (math 26% / reading 41%, grade F, #148 of 222 statewide, top 67%, 1,569 students, 48% FRL) — zoned schools average 53% FRL vs 28% district-wide (26 pts higher); higher-poverty schools than district average — tighter screening recommended.
- Market conditions: 94 active listings in the ZIP; 5 comparable units currently listed for rent nearby; rentals lingering (median 46d on market — plan ~5-8 weeks vacancy on turnover, expect pricing pressure); 100% of comp listings sitting > 30 days — soft ceiling on asking rent; solid renter incomes; 1,542 units permitted in Charles County in 2024 (516 in 5+ unit buildings).
- This rent runs 35% of the median local income ($107k/yr) — at the standard rent-burdened threshold; future hikes will face affordability resistance.
Forward outlook
- Local home prices are declining (-3.0%/yr); year-one equity from $2k of loan paydown is wiped out by about $10k of value loss. Plan a longer hold.
- Charles County population projected at +27% by 2050 — long-run rental-demand tailwind backs the buy-and-hold thesis.
Negotiation context
- Only 9 days on market — expect competitive offers; lowballing is unlikely to land.
Risks & watch-outs
- Climate carrying-cost: major wind risk, 27% chance of damaging wind over 30y; extreme-heat days projected 7→16/yr by 2055 (HVAC capex compounding) — expect insurance premiums to compound above CPI over the hold.
Questions for the listing agent
- Built in 1968 — when were the roof, HVAC, electrical panel, plumbing, and water heater last replaced?
- Is there a deadline driving the sale (1031 exchange, divorce, estate, relocation)? That informs how much negotiation room exists.
- Schools are D-rated, which usually means shorter tenancies and higher turnover. Who's the typical renter profile here, and what's been the actual vacancy rate?
- Crime grade is D in this area — have there been break-ins, vandalism, or insurance claims at this property in the last 3 years? What carrier currently insures it and at what premium?
- What's the average days-on-market for RENTAL listings here right now (not sales)? A rising rental-DOM trend means longer vacancies and softer asking-rent achievability than the comps imply.
- What's the recent tenant-quality profile in this submarket — average credit score on applications, eviction rate, late-payment / NSF rate, and stable-employment percentage? A property-management company in the area should have these aggregated.
- How much new for-sale + rental construction is in the pipeline within 1–3 miles? Heavy new supply typically softens prices + rents 12–24 months out; constrained supply supports both.
Investment metrics
- 1% rule
- 0.91% ✗
- Cap rate
- 6.87%
- Cash-on-cash
- 2.05%
- DSCR
- 1.09
- GRM
- 9.2
CMA / ARV
- ARV (on-the-fly)
- $413,000
- Comps found
- 12
Show comp detail 12 sales within ~0.75 mi
| Address | Dist | Beds/Ba | Sqft | Sold | Price | $/sf | Match |
|---|---|---|---|---|---|---|---|
| 1111 Stone Ct | 0.00mi | 5/2.0 | 1,750 (0%) | 1mo | $360,000 | $206 | 99 |
| 215 Compton Rd | 0.21mi | 4/1.5 (-1) | 1,689 (-4%) | 0mo | $300,000 | $178 | 78 |
| 221 Brent Rd | 0.26mi | 4/2.0 (-1) | 1,688 (-4%) | 6mo | $438,000 | $259 | 72 |
| 22 Amwich Ct | 0.32mi | 4/2.0 (-1) | 1,821 (+4%) | 6mo | $385,000 | $211 | 68 |
| 228 Garner Ave | 0.11mi | 4/3.0 (-1) | 1,914 (+9%) | 4mo | $385,000 | $201 | 67 |
| 1102 Coolidge Ct | 0.47mi | 4/2.0 (-1) | 1,821 (+4%) | 3mo | $325,000 | $178 | 64 |
| 527 Garner Ave | 0.57mi | 4/2.0 (-1) | 1,689 (-4%) | 1mo | $398,900 | $236 | 62 |
| 1006 Stone Ave | 0.29mi | 4/2.0 (-1) | 1,581 (-10%) | 5mo | $389,000 | $246 | 62 |
| 879 Copley Ave | 0.69mi | 4/2.0 (-1) | 1,689 (-4%) | 1mo | $424,900 | $252 | 56 |
| 1404 Boswell Ct | 0.75mi | 4/2.5 (-1) | 1,803 (+3%) | 4mo | $430,000 | $238 | 50 |
| 15 Cardigan Ct | 0.56mi | 4/2.0 (-1) | 1,524 (-13%) | 5mo | $405,000 | $266 | 43 |
| 52 Garner Ave | 0.70mi | 4/2.5 (-1) | 1,991 (+14%) | 5mo | $365,000 | $183 | 33 |
Match score weights: distance 35% · size 25% · config 20% · recency 20%. Top-matched comps best support the ARV.
Projected returns pro-forma
-3.0% appreciation · 3.0% rent growth · sell at horizon
- IRR
- -13.0%
- Equity multiple
- 0.53×
- Total profit
- $-46,047
- Equity at exit
- $52,186
- IRR
- -4.1%
- Equity multiple
- 0.73×
- Total profit
- $-26,368
- Equity at exit
- $30,262
Cash invested: $98,000 (down + closing). Projections, not guarantees.
Landlord ↔ Tenant lean methodology
- Overall (STATE)
- 27 Tenant-Leaning
- State Maryland
- 27 Tenant-Leaning · D+14
- County
- — inherits STATE
- City
- — inherits STATE
ZIP-level market 20602
- Active inventory
- 94
- Price-to-rent
- 9.2×
Monthly cashflow live
- Estimated rent
- $3,170 high interval (Pro) →
- Mortgage (P&I)
- −$1,835
- Tax from tax record
- −$355 /mo · $4,262/yr
- Insurance
- −$146
- HOA
- −$0
- Vacancy / Maint / Mgmt
- −$666
- Net cashflow
- $168
Break-even live
Sensitivity live
| Price | -10% $366 | -5% $267 | +0% $168 | +5% $68 | +10% $-31 |
|---|---|---|---|---|---|
| Rent | -10% $-83 | -5% $42 | +0% $168 | +5% $293 | +10% $418 |
| Rate | -1.0pp $344 | -0.5pp $257 | base $168 | +0.5pp $77 | +1.0pp $-15 |
UW: 25.0% down · 7.5% · 30yr · 1.5% tax · 5.0% vac · 8.0% maint · 8.0% mgmt
Financing live
Cash to close
- Down payment
- $87,500
- Closing costs
- $10,500
- Reserves months
- —
- Total cash needed
- —
Loan-product check · same deal, 3 products live
Conventional
25% down · 7.5% · 30yr
- Down + closing
- —
- Monthly P&I
- —
- Monthly cashflow
- —
- DSCR
- —
- Eligible?
- —
Personal DTI + credit; lowest rate.
DSCR
20% down · 8.5% · 30yr
- Down + closing
- —
- Monthly P&I
- —
- Monthly cashflow
- —
- DSCR
- —
- Eligible?
- —
No personal income docs; deal must DSCR.
Hard money
10% down · 12.0% · 12mo
- Down + closing
- —
- Monthly P&I
- —
- Monthly cashflow
- —
- DSCR
- —
- Eligible?
- —
Short-term bridge; refi at stabilization.
Rent comps 5 comps
| Address | Beds | Baths | Sqft | Rent | $/sqft | DOM | Units | Dist |
|---|---|---|---|---|---|---|---|---|
| 326 Garner Ave Waldorf, MD | 4.0 | 2.0 | 2280 | $2,500 | $1.10 | 45d | 1 | 0.11mi |
| 13 Cardigan Ct Waldorf, MD | 4.0 | 2.0 | 1648 | $2,849 | $1.73 | 45d | 1 | 0.56mi |
| 6 Greystone Cir Waldorf, MD | 4.0 | 2.0 | 1781 | $2,900 | $1.63 | 45d | 1 | 0.75mi |
| 1010 Allward Dr Waldorf, MD | 4.0 | 2.0 | 2176 | $2,999 | $1.38 | 45d | 1 | 0.87mi |
| 11497 Scotch Hills Pl Waldorf, MD | 4.0 | 3.5 | 2068 | $3,000 | $1.45 | 45d | 1 | 0.96mi |
Listing history 3 events
-
2026-04-03status Pending
-
2026-03-26$350,000 Active
-
2026-03-09historical $350,000
ⓘ Source: listings_history table (triggers on properties + properties_extension) + one-shot
backfill from property_details.listing_events for pre-trigger history.
Tax reassessment forecast MD · Partial reset (capped growth)
- Current annual tax
- $4,262 · $355/mo
- Projected year-2 tax
- $4,262 · $355/mo
- Expected delta
- $0/yr ($0/mo · 0.0%)
ⓘ Screening estimate from a state-policy table — verify with the county assessor before closing.
Climate risk First Street
- Flood 1/10 Low FEMA zone X (unshaded) · 0% chance over 30 yrs
- Wildfire 2/10 Low
- Heat 8/10 Severe 7 d/yr ≥103°F today · 16 d/yr by 30 yrs out
- Wind 6/10 Major 27% chance of damaging wind over 30 yrs
- Air quality 2/10 Low 1 unhealthy d/yr today · 2 by 30 yrs out
Nearby sold comps map
Loading sold comps map…
Walkable amenities ~0.75 mi
Loading nearby amenities…
Taxation est. · year 1
- Rental income
- $38,035
- − Mortgage interest
- −$19,605
- − Property taxes
- −$4,262
- − Insurance
- −$1,750
- − Repairs & maintenance
- −$3,043
- − Management
- −$3,043
- − Depreciation
- −$10,182
- Taxable loss
- −$3,850
- Est. tax savings @ 24.0%
- +$924
- After-tax cash flow
- $2,934/yr
For passive investors: Depreciation is non-cash, so a rental often shows a tax loss while cash-flowing — sheltering income. Rental losses are passive: they offset passive income freely, and up to $25,000/yr can offset ordinary (W-2) income if you actively participate and your MAGI is under $100k (phasing out to $0 by $150k); unused losses carry forward. On sale, claimed depreciation is recaptured at up to 25%, and gains may owe capital-gains tax (a 1031 exchange can defer both). Figures are a year-1 estimate at your 24.0% rate — not tax advice; consult a CPA.
Schools (NCES district)
- District
- Charles County Public Schools
- NCES district ID
- 2400270
- Math proficiency
- 13% ▼ -19.00%
- Reading proficiency
- 29% ▼ -13.00%
- Median HH income
- $90,389
- Composite
- 22.54/100
- National rank
- #8087
- State rank
- #14 of 24 in MD
Livability — Waldorf
- Score
- 72/100
- State rank
- #141
- US rank
- #6083
Category grades
Schools grade is shown separately in the Schools card above.
Census & demographics
- Census place
- Waldorf, MD
- County
- Charles County · 103,527 people
- City population
- 103,527
- Metro
- Washington-Arlington-Alexandria, DC-VA-MD-WV
- Population (ZIP)
- 28,331
- Household income
- $107,360
- Rent vs Own
- Severe rent burden
- 867.0
Population outlook (Charles County) Hauer SSP2
- Today (2025)
- 176,616 people
- By 2030
- 186,471 · +5.6%
- By 2040
- 206,472 · +16.9%
- By 2050
- 224,883 · +27.3%
- By 2075
- 272,101 · +54.1%
- By 2100
- 303,564 · +71.9%
Race, ethnicity, and origin ACS 2023
- Neighborhood character
- Diverse neighborhood (Simpson 0.57)
- Race & ethnicity
- Black 62% White 19% Two or more races 11% Hispanic / Latino 9% Asian 2%
- Hispanic origin (detail)
- Common ancestry
- Lithuanian 1% Iranian 1% Italian 1%
- Foreign-born
- 11% · Canada, South Korea, Jamaica
- Languages at home
- 88% English-only · Spanish 6% Other Indo-European 1% Tagalog/Filipino 1%
Political lean MEDSL · Charles
- 2024 margin
- Solid D (+40.7) · D 69.2% · R 28.5% · Other 2.2%
- 2008→2024 swing
- +15.2pp toward D · 2008: 25.5pp · 2024: 40.7pp
- All cycles
- 2024: D+40.7 2020: D+40.9 2016: D+30.2 2012: D+31.3 2008: D+25.5
Not yet ingested
- Civics
- —
Market trends
- HPI YoY
- ▼ -261.39%
- Current HPI
- 267.3445
- Rent YoY
- —
- Metro
- Washington-Arlington-Alexandria, DC-VA-MD-WV
- State GDP YoY
- ▲ 2.97%
- F500 in state
- 12
Industry mix (Fortune 500 HQ in MD)
| Industry | F500 HQs | Revenue |
|---|---|---|
| Aerospace / Defense | 1 | $71B |
|
||
| Utilities | 1 | $25B |
|
||
| Hotels | 1 | $24B |
|
||
| Consumer Goods | 1 | $7B |
|
||
| Real Estate | 1 | $6B |
|
||
| Chemicals | 1 | $2B |
|
||
Price history
+0.0% since first listed3 events — show timeline
- 2026-04-03 Pending — BRIGHT MLS
- 2026-03-26 Listed $350,000 BRIGHT MLS
- 2026-03-09 Coming Soon $350,000 BRIGHT MLS
Property tax history
+4.5%/yrLatest (2025): $4,262 · +3.9% YoY. Source: county tax records.
Cash-flow waterfall
monthlySold comps — $/sqft
last 12 mo · ≤1 miLoading sold comps…