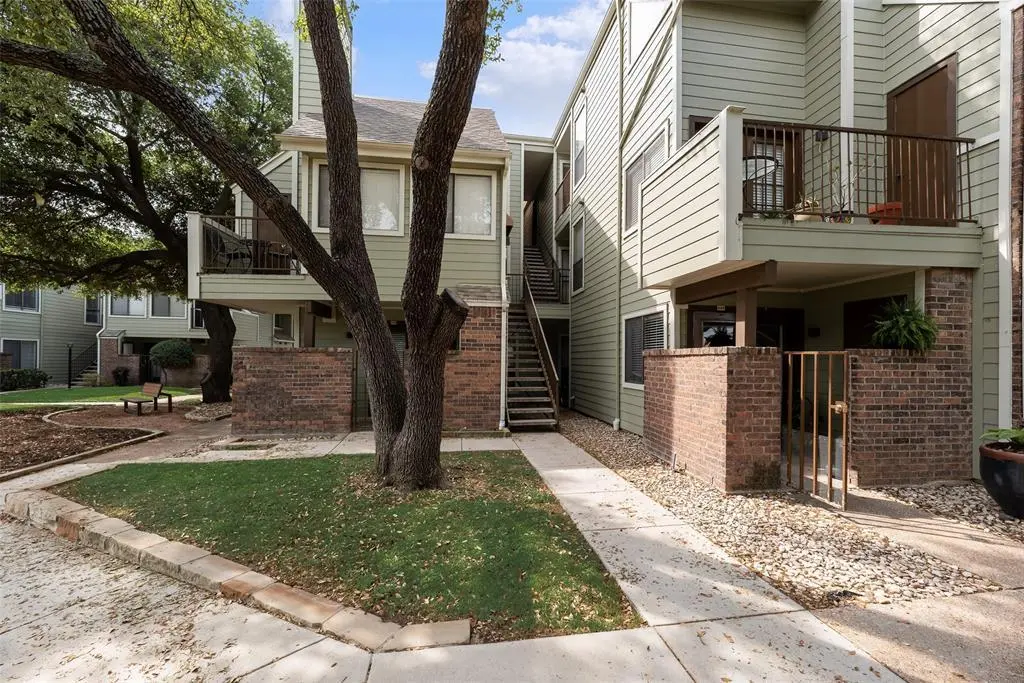
3109 Sondra Dr #302 · Fort Worth, TX
Flood risk 6/10 · Moderate
- FEMA flood zone
- X (unshaded)
- Chance of flooding over 30 yrs
- 0.7%
- Est. flood insurance / yr
- $507 – $1,088
Fire risk 3/10 · Minor
- Est. fire insurance / yr
- $1,222 – $2,270
Heat risk 7/10 · Major
- Hot days now (above 109°F)
- 7 days/yr
- Hot days in 30 yrs
- 23 days/yr
Wind risk 4/10 · Minor
- Chance of severe wind over 30 yrs
- 21.0%
Air-quality risk 3/10 · Minor
- Unhealthy air days now
- 3 days/yr
- Unhealthy air days in 30 yrs
- 4 days/yr
Risk factors via First Street. Map © Google.
Why this score? — see what drove the B grade
The composite is a weighted blend of 9 inputs, each scored 0–100. Each bar is that input's sub-score; the figure is the points it added to the 100-point composite (weight × sub-score).
- Cash flow +26.7/30.0
- ARV discount +15.0/15.0
- 1% rule +9.5/10.0
- DSCR +9.1/10.0
- Livability +4.0/5.0
- Rent growth +3.2/5.0
- Condition / age +2.5/5.0
- Schools +2.0/10.0
- Appreciation +0.0/10.0
$109,900
🖨 Deal sheet 📄 Offer letter ✓ Due diligence
Listing remarks MLS
Amazing opportunity to get a clean, well-maintained, recently updated, studio condo in sought-after University Park Condominiums. Check out the unique and cozy, efficiency, floor plan that still has everything you need. The unit includes the appliances, washer-dryer, brand new carpet, updated lighting, and more! The home also boasts a private balcony. The complex is undergoing updates with major improvements including siding, painting, landscaping, etc. The gated and fenced grounds are well-lit at night providing a peaceful environment. The community pool is beautiful and open year-round for usage of the hot-tub and grills. Perhaps the best amenity for the complex is it's proximity to the museums, UNTHSC, and the 7th Street shopping and nightlife. HURRY to be a part of the amazing growth and development in the 7th Street, Panther Island, Cultural District region! This condo is perfectly priced for a live-in owner, crash-pad, or investor. The seller has additional units if looking to purchase multiple!
Key facts
- Well-lit grounds
- Community pool
- Private balcony
Tags
Neighborhood map
What this means for you Summary
Snapshot
- This is a 2-bed/1.0-bath condo listed at $110k.
Deal economics
- At list price, monthly cash flow is $296 ($4k/yr) — positive.
- The deal already cash-flows at list — no discount required.
- Meets the 1% rule at list price ($2k rent vs $110k).
- Recommended offer: $103k (6.0% below list) — sets the bar for market timing.
- Cap rate 9.5% vs local median 3.9% in Fort Worth — top-decile yield for the area; either an underpriced asset or a hidden risk that comps aren't pricing in. Stress-test before assuming the spread holds.
Location & tenants
- Location reads 80/100 on livability (#49 in TX, #1,954 nationally) — a professional / high-income tenant draw. Strengths: amenities A+, cost of living A+, housing A+; Watch: schools D+, crime F.
- Fort Worth ISD (urban): math 18% / reading 28% proficiency, ranked #742 of 826 in TX (top 90%) — low school quality limits family demand, transient renter base, plan for 1-2y turnover; 73% free/reduced lunch — lower-income household profile, screen leases tightly.
- Market conditions: Rents rising (+2.9%/yr); 271 active listings in the ZIP; 1 comparable units currently listed for rent nearby; solid renter incomes; 18,938 units permitted in Tarrant County in 2024 (8,336 in 5+ unit buildings).
Forward outlook
- Local home prices are declining (-3.0%/yr); year-one equity from $760 of loan paydown is wiped out by about $3k of value loss. Plan a longer hold.
- Tarrant County population projected at +41% by 2050 — long-run rental-demand tailwind backs the buy-and-hold thesis.
- At projected returns (-3.0% appreciation + 2.9% rent growth), your $31k cash investment doubles in ~10 years — after that, you're playing with house money.
Negotiation context
- It's been on market 77 days — a 6% lower offer ($103k) is reasonable based on typical stale-listing flexibility.
- Current owner paid $12k; list at $110k implies a 818% gain — meaningful room to come down on a strong offer.
Risks & watch-outs
- Climate carrying-cost: major flood risk; extreme-heat days projected 7→23/yr by 2055 (HVAC capex compounding) — expect insurance premiums to compound above CPI over the hold.
Questions for the listing agent
- It's been on market 77 days. Have you received any prior offers? Is the seller open to a 6% concession, seller financing, or rate buy-down credit?
- What does the HOA fee cover, when was the last increase, and are there any pending special assessments or reserve-fund shortfalls?
- Any open or pending special assessments — roof, HVAC, plumbing, elevator, façade? What's the per-unit balance and payoff schedule, and is the seller paying it off at close or rolling it to the buyer?
- Why hasn't it sold? Are there any deal-killer items the seller is aware of (foundation, flood, title, zoning, code violations)?
- Is there a deadline driving the sale (1031 exchange, divorce, estate, relocation)? That informs how much negotiation room exists.
- Schools are D-rated, which usually means shorter tenancies and higher turnover. Who's the typical renter profile here, and what's been the actual vacancy rate?
- Crime grade is F in this area — have there been break-ins, vandalism, or insurance claims at this property in the last 3 years? What carrier currently insures it and at what premium?
- What's the average days-on-market for RENTAL listings here right now (not sales)? A rising rental-DOM trend means longer vacancies and softer asking-rent achievability than the comps imply.
- What's the recent tenant-quality profile in this submarket — average credit score on applications, eviction rate, late-payment / NSF rate, and stable-employment percentage? A property-management company in the area should have these aggregated.
- How much new apartment / multifamily construction is in the pipeline within 1–3 miles? Heavy new supply (>2% of stock underway) typically softens rents 12–24 months out; light construction supports rent growth.
Investment metrics
- 1% rule
- 1.45% ✓
- Cap rate
- 9.53%
- Cash-on-cash
- 11.55%
- DSCR
- 1.51
- GRM
- 5.7
CMA / ARV
- ARV (median comp)
- $133,885
- List price
- $109,900
- Delta
- -17.91%
- Verdict
- UNDERPRICED
- Comps
- 5 within 1.0 mi
Projected returns pro-forma
-3.0% appreciation · 2.94% rent growth · sell at horizon
- IRR
- 0.9%
- Equity multiple
- 1.04×
- Total profit
- $1,101
- Equity at exit
- $16,386
- IRR
- 10.6%
- Equity multiple
- 1.83×
- Total profit
- $25,452
- Equity at exit
- $9,502
Cash invested: $30,772 (down + closing). Projections, not guarantees.
Landlord ↔ Tenant lean methodology
- Overall (STATE)
- 87 Strongly Landlord-Friendly
- State Texas
- 87 Strongly Landlord-Friendly · R+5
- County
- — inherits STATE
- City
- — inherits STATE
ZIP-level market 76107
- Rents YoY
- 2.9%
- Active inventory
- 271
- Price-to-rent
- 5.7×
Monthly cashflow live
- Estimated rent
- $1,595 medium interval (Pro) →
- Mortgage (P&I)
- −$576
- Tax from tax record
- −$171 /mo · $2,046/yr
- Insurance
- −$46
- HOA
- −$171
- Vacancy / Maint / Mgmt
- −$335
- Net cashflow
- $296
Break-even live
UW: 25.0% down · 7.5% · 30yr · 1.5% tax · 5.0% vac · 8.0% maint · 8.0% mgmt
Financing live
Cash to close
- Down payment
- $27,475
- Closing costs
- $3,297
- Reserves months
- —
- Total cash needed
- —
Loan-product check · same deal, 3 products live
Conventional
25% down · 7.5% · 30yr
- Down + closing
- —
- Monthly P&I
- —
- Monthly cashflow
- —
- DSCR
- —
- Eligible?
- —
Personal DTI + credit; lowest rate.
DSCR
20% down · 8.5% · 30yr
- Down + closing
- —
- Monthly P&I
- —
- Monthly cashflow
- —
- DSCR
- —
- Eligible?
- —
No personal income docs; deal must DSCR.
Hard money
10% down · 12.0% · 12mo
- Down + closing
- —
- Monthly P&I
- —
- Monthly cashflow
- —
- DSCR
- —
- Eligible?
- —
Short-term bridge; refi at stabilization.
Rent comps 1 comps
| Address | Beds | Baths | Sqft | Rent | $/sqft | DOM | Units | Dist |
|---|---|---|---|---|---|---|---|---|
| 900 Matisse Dr Fort Worth, TX | 2.0 | 1.0–2.0 | 911 | $2,625 | $2.88 | 1d | 39 | 0.78mi |
HOA detail condo
- Monthly dues
- $171 · $2,052/yr
- Likely covers
- landscapingpoolsecurity
- Assessments
- None detected in remarks — confirm with the listing agent.
Listing history 18 events
-
2026-06-18days on market $109,900 Active 77 DOM
-
2026-06-17days on market $109,900 Active 76 DOM
-
2026-06-16days on market $109,900 Active 75 DOM
-
2026-06-15days on market $109,900 Active 74 DOM
-
2026-06-13days on market $109,900 Active 72 DOM
-
2026-06-09days on market $109,900 Active 68 DOM
-
2026-06-08days on market $109,900 Active 67 DOM
-
2026-06-07days on market $109,900 Active 66 DOM
-
2026-06-04days on market $109,900 Active 63 DOM
-
2026-06-03days on market $109,900 Active 62 DOM
-
2026-06-02days on market $109,900 Active 61 DOM
-
2026-06-02days on market $109,900 Active 60 DOM
-
2026-05-31days on market $109,900 Active 59 DOM
-
2026-04-01$109,900 Active 1021-char remark
Show marketing remark (1021 chars)
Amazing opportunity to get a clean, well-maintained, recently updated, studio condo in sought-after University Park Condominiums. Check out the unique and cozy, efficiency, floor plan that still has everything you need. The unit includes the appliances, washer-dryer, brand new carpet, updated lighting, and more! The home also boasts a private balcony. The complex is undergoing updates with major improvements including siding, painting, landscaping, etc. The gated and fenced grounds are well-lit at night providing a peaceful environment. The community pool is beautiful and open year-round for usage of the hot-tub and grills. Perhaps the best amenity for the complex is it's proximity to the museums, UNTHSC, and the 7th Street shopping and nightlife. HURRY to be a part of the amazing growth and development in the 7th Street, Panther Island, Cultural District region! This condo is perfectly priced for a live-in owner, crash-pad, or investor. The seller has additional units if looking to purchase multiple!
-
2012-10-16soldstatus
-
2003-11-24soldstatus
-
1994-07-15soldstatus $11,970
-
1990-11-16soldstatus
ⓘ Source: listings_history table (triggers on properties + properties_extension) + one-shot
backfill from property_details.listing_events for pre-trigger history.
Tax reassessment forecast TX · Resets to sale price
- Current annual tax
- $2,046 · $171/mo
- Projected year-2 tax
- $2,046 · $171/mo
- Expected delta
- $0/yr ($0/mo · 0.0%)
ⓘ Screening estimate from a state-policy table — verify with the county assessor before closing.
Climate risk First Street
- Flood 6/10 Major FEMA zone X (unshaded) · 70% chance over 30 yrs
- Wildfire 3/10 Moderate
- Heat 7/10 Severe 7 d/yr ≥109°F today · 23 d/yr by 30 yrs out
- Wind 4/10 Moderate 21% chance of damaging wind over 30 yrs
- Air quality 3/10 Moderate 3 unhealthy d/yr today · 4 by 30 yrs out
Nearby sold comps map
Loading sold comps map…
Walkable amenities ~0.75 mi
Loading nearby amenities…
Taxation est. · year 1
- Rental income
- $19,135
- − Mortgage interest
- −$6,156
- − Property taxes
- −$2,046
- − Insurance
- −$550
- − Repairs & maintenance
- −$1,531
- − Management
- −$1,531
- − HOA
- −$2,052
- − Depreciation
- −$3,197
- Taxable income
- $2,072
- Est. tax owed @ 24.0%
- −$497
- After-tax cash flow
- $3,055/yr
For passive investors: Depreciation is non-cash, so a rental often shows a tax loss while cash-flowing — sheltering income. Rental losses are passive: they offset passive income freely, and up to $25,000/yr can offset ordinary (W-2) income if you actively participate and your MAGI is under $100k (phasing out to $0 by $150k); unused losses carry forward. On sale, claimed depreciation is recaptured at up to 25%, and gains may owe capital-gains tax (a 1031 exchange can defer both). Figures are a year-1 estimate at your 24.0% rate — not tax advice; consult a CPA.
Schools (NCES district)
- District
- Fort Worth ISD
- NCES district ID
- 4819700
- Math proficiency
- 18% ▼ -16.00%
- Reading proficiency
- 28% ▼ -6.00%
- Median HH income
- $42,109
- Composite
- 19.61/100
- National rank
- #8753
- State rank
- #742 of 826 in TX
Livability — Fort Worth
- Score
- 80/100
- State rank
- #49
- US rank
- #1954
Category grades
Schools grade is shown separately in the Schools card above.
Census & demographics
- Census place
- Fort Worth, TX
- County
- Tarrant County · 2,033,669 people
- City population
- 911,619
- Metro
- Dallas-Fort Worth-Arlington, TX
- Population (ZIP)
- 30,994
- Household income
- $79,990
- Rent vs Own
- Severe rent burden
- 2303.0
Population outlook (Tarrant County) Hauer SSP2
- Today (2025)
- 2,380,417 people
- By 2030
- 2,578,900 · +8.3%
- By 2040
- 2,974,995 · +25.0%
- By 2050
- 3,350,489 · +40.8%
- By 2075
- 4,216,909 · +77.2%
- By 2100
- 4,741,527 · +99.2%
Race, ethnicity, and origin ACS 2023
- Neighborhood character
- Diverse neighborhood (Simpson 0.58)
- Race & ethnicity
- White 59% Hispanic / Latino 20% Black 15% Two or more races 8% Asian 3%
- Hispanic origin (detail)
- Mexican 17%
- Common ancestry
- Slovak 3% Lithuanian 2% Romanian 1%
- Foreign-born
- 9% · Canada, China, Vietnam
- Languages at home
- 82% English-only · Spanish 14% French/Haitian/Cajun 1% Chinese 1%
Political lean MEDSL · Tarrant
- 2024 margin
- Lean R (+5.1) · D 46.7% · R 51.9% · Other 1.4%
- 2008→2024 swing
- +6.6pp toward D · 2008: -11.7pp · 2024: -5.1pp
- All cycles
- 2024: R+5.1 2020: D+0.2 2016: R+8.7 2012: R+15.7 2008: R+11.7
Not yet ingested
- Civics
- —
Market trends
- HPI YoY
- ▼ -447.90%
- Current HPI
- 296.4355
- Rent YoY
- ▲ 2.94%
- Metro
- Dallas-Fort Worth-Arlington, TX
- State GDP YoY
- ▲ 3.95%
- F500 in state
- 110
Industry mix (Fortune 500 HQ in TX)
| Industry | F500 HQs | Revenue |
|---|---|---|
| Energy | 16 | $1,198B |
|
||
| Technology | 5 | $198B |
|
||
| Engineering / Construction | 4 | $72B |
|
||
| Energy Services | 3 | $60B |
|
||
| Utilities | 3 | $41B |
|
||
| Healthcare | 2 | $330B |
|
||
Price history
+818.1% since first listed5 events — show timeline
- 2026-04-01 Listed $109,900 NTREIS
- 2012-10-16 Sold (Public Records) — Public Records
- 2003-11-24 Sold (Public Records) — Public Records
- 1994-07-15 Sold (Public Records) $11,970 Public Records
- 1990-11-16 Sold (Public Records) — Public Records
Property tax history
+4.4%/yrLatest (2025): $2,046 · -20.7% YoY. Source: county tax records.
Cash-flow waterfall
monthlySold comps — $/sqft
last 12 mo · ≤1 miLoading sold comps…