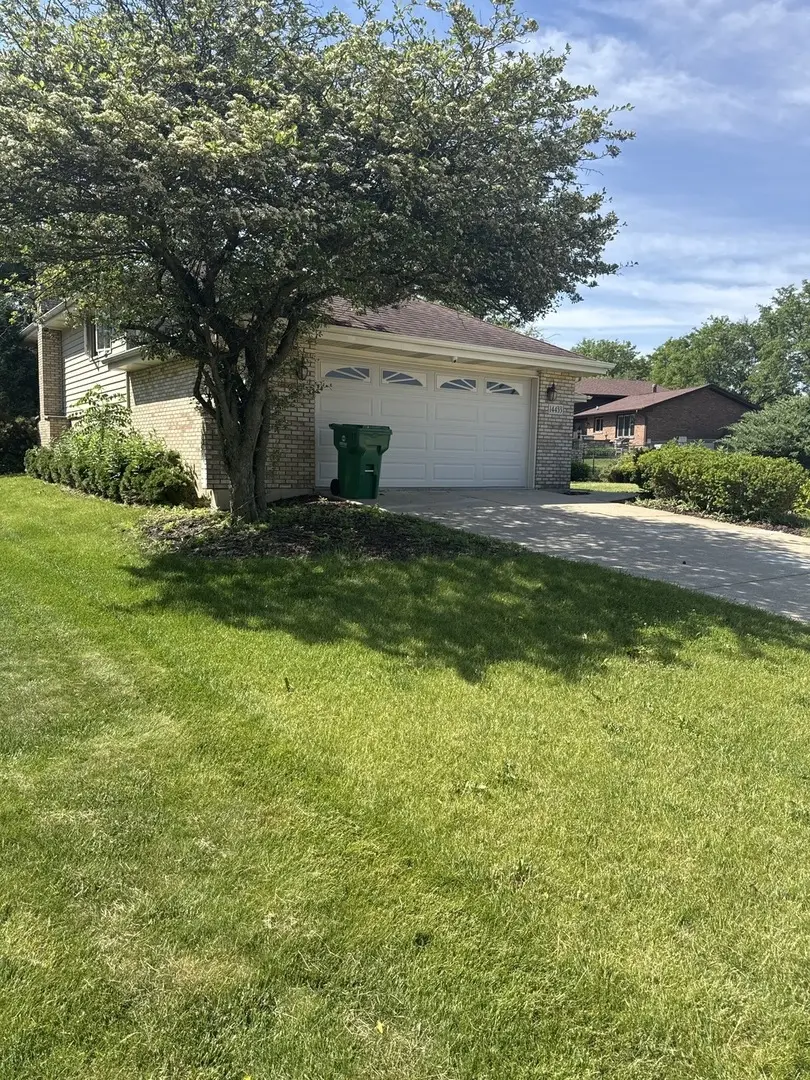
14433 Mallard Dr · Homer Glen, IL
Flood risk 1/10 · Minimal
- FEMA flood zone
- X (unshaded)
- Chance of flooding over 30 yrs
- 0.0%
- Est. flood insurance / yr
- $507 – $1,088
Fire risk 2/10 · Minimal
- Est. fire insurance / yr
- $804 – $1,492
Heat risk 3/10 · Minor
- Hot days now (above 102°F)
- 7 days/yr
- Hot days in 30 yrs
- 15 days/yr
Wind risk 2/10 · Minimal
- Chance of severe wind over 30 yrs
- —
Air-quality risk 2/10 · Minimal
- Unhealthy air days now
- 1 days/yr
- Unhealthy air days in 30 yrs
- 1 days/yr
Risk factors via First Street. Map © Google.
Why this score? — see what drove the F grade
The composite is a weighted blend of 9 inputs, each scored 0–100. Each bar is that input's sub-score; the figure is the points it added to the 100-point composite (weight × sub-score).
- ARV discount +7.5/15.0
- Cash flow +3.8/30.0
- Schools +3.4/10.0
- Livability +3.4/5.0
- Rent growth +2.5/5.0
- Condition / age +2.5/5.0
- 1% rule +0.0/10.0
- DSCR +0.0/10.0
- Appreciation +0.0/10.0
$605,000
🖨 Deal sheet (PDF) 📄 Offer letter ✓ Due diligence
Key facts
- 2 garage spots
- Built 1978
- Listed 10 days
Neighborhood map
What this means for you Summary
Snapshot
- This is a 4-bed/2.5-bath single-family listed at $605k.
Deal economics
- At list price, monthly cash flow is $-2k ($-21k/yr) — negative.
- To cash-flow at today's rent, offer at most $296k (51.1% below list).
- To meet the 1% rule (rent ≥ 1% of price), the offer needs to be $300k (50.4% below list).
- Recommended offer: $296k (51.1% below list) — sets the bar for cash-flow.
Location & tenants
- Location reads 68/100 on livability (#449 in IL) — a middle-class / working-renter tenant base. Strengths: crime A+, employment A+, housing A+; Watch: cost of living D, amenities F, commute F.
- Lockport Twp Hsd 205 (suburban): math 35% / reading 38% proficiency, ranked #153 of 620 in IL (top 25%) — families likely to look elsewhere, expect single-tenant / working-renter base with shorter leases.
- Zoned schools: Lockport Township High Sch East (math 35% / reading 38%, grade F, #117 of 693 statewide, top 17%, 3,872 students, 0% FRL).
- Market conditions: 82 active listings in the ZIP; 1 comparable units currently listed for rent nearby; 2,028 units permitted in Will County in 2024 (530 in 5+ unit buildings).
Forward outlook
- Local home prices are declining (-3.0%/yr); year-one equity from $4k of loan paydown is wiped out by about $18k of value loss. Plan a longer hold.
- Will County population projected to shrink 4% by 2050 — rents likely to lag national; underwrite the cash flow, not the appreciation.
Negotiation context
- Only 11 days on market — expect competitive offers; lowballing is unlikely to land.
- 8 sale attempts since 3y ago; this cycle's ask is 15821% above the opening price — seller raised mid-cycle; expect resistance to lowballs.
- Current owner paid $449k; 35% above their basis — modest negotiation headroom, anchor on the comps not their cost.
Questions for the listing agent
- What do current leases actually rent for vs. the listed asking? Can we see a recent rent roll and the last 12 months of T-12 income?
- Built in 1978 — when were the roof, HVAC, electrical panel, plumbing, and water heater last replaced?
- Is there a deadline driving the sale (1031 exchange, divorce, estate, relocation)? That informs how much negotiation room exists.
- Schools are B-rated — typically a magnet for longer-tenancy family renters. What's the average tenant stay here, and is there a school-zone premium baked into asking?
- The area grade is low — what's the realistic commute time and amenity access for the typical tenant pool here? Any planned neighborhood developments (good or bad) we should know about?
- What's the average days-on-market for RENTAL listings here right now (not sales)? A rising rental-DOM trend means longer vacancies and softer asking-rent achievability than the comps imply.
- What's the recent tenant-quality profile in this submarket — average credit score on applications, eviction rate, late-payment / NSF rate, and stable-employment percentage? A property-management company in the area should have these aggregated.
- How much new for-sale + rental construction is in the pipeline within 1–3 miles? Heavy new supply typically softens prices + rents 12–24 months out; constrained supply supports both.
Investment metrics
- 1% rule
- 0.50% ✗
- Cap rate
- 2.82%
- Cash-on-cash
- -12.39%
- DSCR
- 0.45
- GRM
- 16.8
CMA / ARV
- ARV (on-the-fly)
- $363,394
- Comps found
- 4
Show comp detail 4 sales within ~0.75 mi
| Address | Dist | Beds/Ba | Sqft | Sold | Price | $/sf | Match |
|---|---|---|---|---|---|---|---|
| 12337 Derby Ln | 0.54mi | 3/2.5 (-1) | 1,382 (-0%) | 14mo | $399,000 | $289 | 58 |
| 71 Ruggles Ct | 0.71mi | 3/2.0 (-1) | 1,465 (+6%) | 11mo | $355,000 | $242 | 42 |
| 111 Ruggles Ct | 0.60mi | 3/2.0 (-1) | 1,483 (+7%) | 20mo | $355,000 | $239 | 37 |
| 102 Ruggles Ct | 0.65mi | 3/2.0 (-1) | 1,488 (+7%) | 17mo | $389,900 | $262 | 37 |
Match score weights: distance 35% · size 25% · config 20% · recency 20%. Top-matched comps best support the ARV.
Projected returns pro-forma
-3.0% appreciation · 3.0% rent growth · sell at horizon
- IRR
- -39.3%
- Equity multiple
- -0.24×
- Total profit
- $-209,403
- Equity at exit
- $90,207
- IRR
- -61.1%
- Equity multiple
- -0.92×
- Total profit
- $-325,727
- Equity at exit
- $52,309
Cash invested: $169,400 (down + closing). Projections, not guarantees.
Landlord ↔ Tenant lean methodology
- Overall (STATE)
- 43 Moderately Tenant-Leaning
- State Illinois
- 43 Moderately Tenant-Leaning · D+7
- County
- — inherits STATE
- City
- — inherits STATE
ZIP-level market 60491
- Active inventory
- 82
- Price-to-rent
- 16.8×
Monthly cashflow live
- Estimated rent
- $3,000 medium interval (Pro) →
- Mortgage (P&I)
- −$3,173
- Tax from tax record
- −$694 /mo · $8,327/yr
- Insurance
- −$252
- HOA
- −$0
- Vacancy / Maint / Mgmt
- −$630
- Net cashflow
- $-1,749
Break-even live
Sensitivity live
| Price | -10% $-1,406 | -5% $-1,577 | +0% $-1,749 | +5% $-1,920 | +10% $-2,091 |
|---|---|---|---|---|---|
| Rent | -10% $-1,986 | -5% $-1,867 | +0% $-1,749 | +5% $-1,630 | +10% $-1,512 |
| Rate | -1.0pp $-1,444 | -0.5pp $-1,595 | base $-1,749 | +0.5pp $-1,905 | +1.0pp $-2,065 |
UW: 25.0% down · 7.5% · 30yr · 1.5% tax · 5.0% vac · 8.0% maint · 8.0% mgmt
Financing live
Cash to close
- Down payment
- $151,250
- Closing costs
- $18,150
- Reserves months
- —
- Total cash needed
- —
Loan-product check · same deal, 3 products live
Conventional
25% down · 7.5% · 30yr
- Down + closing
- —
- Monthly P&I
- —
- Monthly cashflow
- —
- DSCR
- —
- Eligible?
- —
Personal DTI + credit; lowest rate.
DSCR
20% down · 8.5% · 30yr
- Down + closing
- —
- Monthly P&I
- —
- Monthly cashflow
- —
- DSCR
- —
- Eligible?
- —
No personal income docs; deal must DSCR.
Hard money
10% down · 12.0% · 12mo
- Down + closing
- —
- Monthly P&I
- —
- Monthly cashflow
- —
- DSCR
- —
- Eligible?
- —
Short-term bridge; refi at stabilization.
Rent comps 1 comps
| Address | Beds | Baths | Sqft | Rent | $/sqft | DOM | Units | Dist |
|---|---|---|---|---|---|---|---|---|
| 14310 Mallard Dr Homer Glen, IL | 4.0 | 3.0 | 1610 | $3,000 | $1.86 | 17d | 1 | 0.21mi |
Listing history 14 events
-
2026-06-21days on market $605,000 Active 11 DOM
-
2026-06-18days on market $605,000 Active 8 DOM
-
2026-06-17days on market $605,000 Active 7 DOM
-
2026-06-16days on market $605,000 Active 6 DOM
-
2026-06-15days on market $605,000 Active 5 DOM
-
2026-06-13statusdays on market $605,000 Active 3 DOM
-
2026-06-09days on market $605,000 Active (Private) 11 DOM
-
2026-06-08days on market $605,000 Active (Private) 10 DOM
-
2026-06-07days on market $605,000 Active (Private) 9 DOM
-
2026-06-04days on market $605,000 Active (Private) 6 DOM
-
2026-06-03days on market $605,000 Active (Private) 5 DOM
-
2026-06-02days on market $605,000 Active (Private) 4 DOM
-
2026-06-01days on market $605,000 Active (Private) 3 DOM
-
2026-05-31days on market $605,000 Active (Private) 2 DOM
ⓘ Source: listings_history table (triggers on properties + properties_extension) + one-shot
backfill from property_details.listing_events for pre-trigger history.
Tax reassessment forecast IL · Partial reset (capped growth)
- Current annual tax
- $8,327 · $694/mo
- Projected year-2 tax
- $11,030 · $919/mo
- Expected delta
- +$2,703/yr (+$225/mo · 32.5%)
ⓘ Screening estimate from a state-policy table — verify with the county assessor before closing.
Climate risk First Street
- Flood 1/10 Low FEMA zone X (unshaded) · 0% chance over 30 yrs
- Wildfire 2/10 Low
- Heat 3/10 Moderate 7 d/yr ≥102°F today · 15 d/yr by 30 yrs out
- Wind 2/10 Low
- Air quality 2/10 Low 1 unhealthy d/yr today · 1 by 30 yrs out
Nearby sold comps map
Loading sold comps map…
Walkable amenities ~0.75 mi
Loading nearby amenities…
Taxation est. · year 1
- Rental income
- $36,000
- − Mortgage interest
- −$33,889
- − Property taxes
- −$8,327
- − Insurance
- −$3,025
- − Repairs & maintenance
- −$2,880
- − Management
- −$2,880
- − Depreciation
- −$17,600
- Taxable loss
- −$32,601
- Est. tax savings @ 24.0%
- +$7,824
- After-tax cash flow
- $-13,160/yr
For passive investors: Depreciation is non-cash, so a rental often shows a tax loss while cash-flowing — sheltering income. Rental losses are passive: they offset passive income freely, and up to $25,000/yr can offset ordinary (W-2) income if you actively participate and your MAGI is under $100k (phasing out to $0 by $150k); unused losses carry forward. On sale, claimed depreciation is recaptured at up to 25%, and gains may owe capital-gains tax (a 1031 exchange can defer both). Figures are a year-1 estimate at your 24.0% rate — not tax advice; consult a CPA.
Schools (NCES district)
- District
- Lockport Twp Hsd 205
- NCES district ID
- 1723350
- Math proficiency
- 35% ▼ -5.00%
- Reading proficiency
- 38% ▼ -4.00%
- Median HH income
- $69,994
- Composite
- 33.5/100
- National rank
- #5440
- State rank
- #153 of 620 in IL
Livability — Homer Glen
- Score
- 68/100
- State rank
- #449
- US rank
- #9274
Category grades
Schools grade is shown separately in the Schools card above.
Census & demographics
- Census place
- Homer Glen, IL
- City population
- 22,585
- Population (ZIP)
- 22,585
Population outlook (Will County) Hauer SSP2
- Today (2025)
- 705,368 people
- By 2030
- 708,154 · +0.4%
- By 2040
- 702,692 · -0.4%
- By 2050
- 680,249 · -3.6%
- By 2075
- 611,990 · -13.2%
- By 2100
- 516,215 · -26.8%
Race, ethnicity, and origin ACS 2023
- Neighborhood character
- Predominantly White (88%)
- Race & ethnicity
- White 88% Hispanic / Latino 8% Two or more races 5% Asian 1%
- Hispanic origin (detail)
- Mexican 6%
- Common ancestry
- Romanian 24% Iranian 2% Lithuanian 1%
- Foreign-born
- 12% · Canada
- Languages at home
- 79% English-only · Russian/Polish/Slavic 9% Arabic 5% Spanish 3%
Political lean MEDSL · Will
- 2024 margin
- Toss-up / Even · D 50.1% · R 48.5% · Other 1.4%
- 2008→2024 swing
- -11.6pp toward R · 2008: 13.2pp · 2024: 1.6pp
- All cycles
- 2024: D+1.6 2020: D+8.3 2016: D+5.7 2012: D+3.7 2008: D+13.2
Not yet ingested
- Civics
- —
Market trends
- HPI YoY
- ▼ -124.66%
- Current HPI
- 208.115
- Rent YoY
- —
- Metro
- —
- State GDP YoY
- ▲ 1.59%
- F500 in state
- 60
Industry mix (Fortune 500 HQ in IL)
| Industry | F500 HQs | Revenue |
|---|---|---|
| Insurance | 4 | $201B |
|
||
| Consumer Goods | 4 | $87B |
|
||
| Industrial Machinery | 3 | $64B |
|
||
| Healthcare | 2 | $55B |
|
||
| Retail / Pharmacy | 1 | $148B |
|
||
| Agriculture / Food | 1 | $86B |
|
||
Price history
+2320.0% since first listed27 events — show timeline
- 2026-05-30 Coming Soon $605,000 MRED as Distributed by MLS Grid
- 2026-05-14 Rental Removed $3,800 MRED
- 2026-04-23 Listed for Rent $3,800 MRED
- 2026-04-22 Listing Removed — MRED as Distributed by MLS Grid
- 2026-04-15 Listed — MRED as Distributed by MLS Grid
- 2026-04-09 Listing Removed — MRED as Distributed by MLS Grid
- 2026-02-18 Price Changed — MRED as Distributed by MLS Grid
- 2026-02-02 Price Changed — MRED as Distributed by MLS Grid
- 2026-02-02 Price Changed — MRED as Distributed by MLS Grid
- 2026-01-28 Listed — MRED as Distributed by MLS Grid
- 2024-08-21 Sold (Public Records) $449,000 Public Records
- 2024-07-15 Sold (MLS) $449,000 MRED as Distributed by MLS Grid
- 2024-06-06 Listed — MRED as Distributed by MLS Grid
- 2024-06-05 Listing Removed — MRED as Distributed by MLS Grid
- 2024-06-05 Listed $449,900 MRED as Distributed by MLS Grid
- 2024-05-29 Price Changed — MRED as Distributed by MLS Grid
- 2024-05-17 Listed — MRED as Distributed by MLS Grid
- 2024-05-07 Contingent — MRED as Distributed by MLS Grid
- 2024-05-07 Price Changed — MRED as Distributed by MLS Grid
- 2024-05-07 Listing Removed — MRED as Distributed by MLS Grid
- 2024-04-26 Listed — MRED as Distributed by MLS Grid
- 2023-03-07 Sold (Public Records) $275,000 Public Records
- 2023-03-01 Sold (MLS) $275,000 MRED as Distributed by MLS Grid
- 2023-02-14 Contingent — MRED as Distributed by MLS Grid
- 2023-02-08 Listed $350,000 MRED as Distributed by MLS Grid
- 1987-01-13 Sold (Public Records) $125,000 Public Records
- 1986-07-01 Sold (Public Records) $25,000 Public Records
Property tax history
+2.9%/yrLatest (2024): $8,327 · +22.3% YoY. Source: county tax records.
Cash-flow waterfall
monthlySold comps — $/sqft
last 12 mo · ≤1 miLoading sold comps…