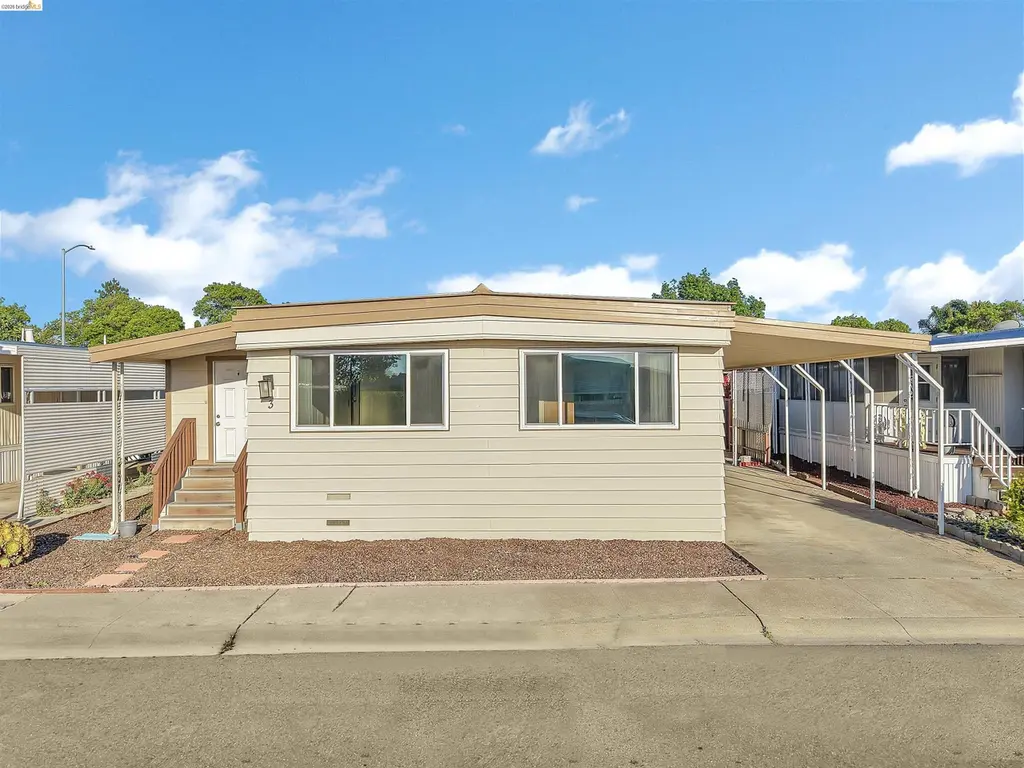
4141 Deep Creek Rd #3 · Fremont, CA
Flood risk 1/10 · Minimal
- FEMA flood zone
- X (unshaded)
- Chance of flooding over 30 yrs
- 0.0%
- Est. flood insurance / yr
- $507 – $1,088
Fire risk 1/10 · Minimal
- Est. fire insurance / yr
- $659 – $1,223
Heat risk 4/10 · Minor
- Hot days now (above 90°F)
- 7 days/yr
- Hot days in 30 yrs
- 13 days/yr
Wind risk 1/10 · Minimal
- Chance of severe wind over 30 yrs
- —
Air-quality risk 7/10 · Major
- Unhealthy air days now
- 12 days/yr
- Unhealthy air days in 30 yrs
- 12 days/yr
Risk factors via First Street. Map © Google.
Why this score? — see what drove the B+ grade
The composite is a weighted blend of 9 inputs, each scored 0–100. Each bar is that input's sub-score; the figure is the points it added to the 100-point composite (weight × sub-score).
- Cash flow +30.0/30.0
- 1% rule +10.0/10.0
- DSCR +10.0/10.0
- ARV discount +9.1/15.0
- Schools +7.3/10.0
- Livability +4.2/5.0
- Condition / age +3.8/5.0
- Rent growth +3.3/5.0
- Appreciation +0.0/10.0
$220,000
🖨 Deal sheet (PDF) 📄 Offer letter ✓ Due diligence
Listing remarks
Welcome to Besaro Mobile Home Community, a desirable 55+ community located in the heart of Fremont. This light-filled and inviting home offers one of the more versatile floor plans in the community, with multiple living spaces designed for comfort and flexibility. The updated kitchen features modern cabinetry, countertops, and appliances, creating a functional and welcoming space for everyday living. The spacious living room flows into an enclosed front room, providing additional flexible living space ideal for a home office, hobby room, reading retreat, or guest area. A separate family room with a sliding glass door opens to a newer deck, creating the perfect setting for relaxing, entertai
Key facts
- Large windows
- Enclosed front room
- Newer deck
Tags
Property features AI
Finance
- HOA & community: Pets allowed upon approval; Senior community; Community clubhouse; Community pool; Community spa; Located in BESARO MHP
Exterior
- Parking: Carport
- Utilities: Public water; Public sewer
- Home design: Manufactured in park (mobile home); Double wide
- Construction: Aluminum siding
- Exterior features: Front yard; Back yard; Patio; Shed(s)
Interior
- Kitchen: Dishwasher; Gas range / cooktop; Refrigerator; Disposal; Laminate counters; Updated kitchen
- Bedrooms: 2 bedrooms (street level)
- Flooring: Laminate flooring; Carpet
- Bathrooms: 2 full bathrooms; Primary bathroom with stall shower and solid-surface counters; Other bathroom with shower-over-tub and solid-surface counters
- Heating & cooling: Forced air heating; Central air; Ceiling fan(s)
- Interior features: Updated kitchen; Bonus/plus room; Main entry at street level; 2 bedrooms and 2 baths on street level; 5 total rooms
- Laundry & utility: Laundry room with sink; Washer; Dryer
Neighborhood map
What this means for you Summary
Snapshot
- This is a 2-bed/2.0-bath manufactured listed at $220k. Condition is rated good.
Deal economics
- At list price, monthly cash flow is $1k ($16k/yr) — positive.
- The deal already cash-flows at list — no discount required.
- Meets the 1% rule at list price ($4k rent vs $220k).
- Recommended offer: $217k (1.5% below list) — sets the bar for market timing.
- Cap rate 13.3% vs local median 1.2% in Fremont — top-decile yield for the area; either an underpriced asset or a hidden risk that comps aren't pricing in. Stress-test before assuming the spread holds.
Location & tenants
- Location reads 85/100 on livability (#10 in CA, #561 nationally) — a professional / high-income tenant draw. Strengths: amenities A+, commute A+, employment A+; Watch: cost of living F.
- Fremont Unified (suburban): math 76% / reading 84% proficiency, ranked #23 of 517 in CA (top 4%) — strong family-tenant draw, lease renewals of 3-5y typical; only 15% free/reduced lunch — higher-income household profile.
- Zoned schools: Ardenwood Elementary (778 students, 14% FRL); Thornton Junior High (1,302 students, 17% FRL); American High (math 82% / reading 90%, grade A, #25 of 1,170 statewide, top 2%, 2,501 students, 15% FRL) — zoned schools at 16% FRL track the district average.
- Market conditions: Rents rising (+3.2%/yr); 76 active listings in the ZIP; 23 comparable units currently listed for rent nearby; rentals at typical pace (median 17d on market — plan ~3-4 weeks tenant-placement turnaround); high-income renter base; 1,742 units permitted in Alameda County in 2024 (856 in 5+ unit buildings).
Forward outlook
- Local home prices are declining (-3.0%/yr); year-one equity from $2k of loan paydown is wiped out by about $7k of value loss. Plan a longer hold.
- Alameda County population projected at +34% by 2050 — long-run rental-demand tailwind backs the buy-and-hold thesis.
- At projected returns (-3.0% appreciation + 3.2% rent growth), your $62k cash investment doubles in ~5 years — after that, you're playing with house money.
Negotiation context
- It's been on market 20 days — a 2% lower offer ($217k) is reasonable based on typical stale-listing flexibility.
Questions for the listing agent
- Built in 1972 — when were the roof, HVAC, electrical panel, plumbing, and water heater last replaced?
- Is there a deadline driving the sale (1031 exchange, divorce, estate, relocation)? That informs how much negotiation room exists.
- Schools are A-rated — typically a magnet for longer-tenancy family renters. What's the average tenant stay here, and is there a school-zone premium baked into asking?
- What's the average days-on-market for RENTAL listings here right now (not sales)? A rising rental-DOM trend means longer vacancies and softer asking-rent achievability than the comps imply.
- What's the recent tenant-quality profile in this submarket — average credit score on applications, eviction rate, late-payment / NSF rate, and stable-employment percentage? A property-management company in the area should have these aggregated.
- How much new for-sale + rental construction is in the pipeline within 1–3 miles? Heavy new supply typically softens prices + rents 12–24 months out; constrained supply supports both.
Investment metrics
- 1% rule
- 1.62% ✓
- Cap rate
- 13.35%
- Cash-on-cash
- 25.20%
- DSCR
- 2.12
- GRM
- 5.1
CMA / ARV
- ARV (on-the-fly)
- $228,288
- Comps found
- 12
Show comp detail 12 sales within ~0.75 mi
| Address | Dist | Beds/Ba | Sqft | Sold | Price | $/sf | Match |
|---|---|---|---|---|---|---|---|
| 4141 Deepcreek #106 | 0.15mi | 2/2.0 | 1,440 (+3%) | 9mo | $130,000 | $90 | 79 |
| 4141 Deep Creek Rd #98 | 0.04mi | 2/2.0 | 1,344 (-3%) | 16mo | $275,000 | $205 | 79 |
| 4141 Deep Creed Rd #129 | 0.22mi | 2/2.0 | 1,440 (+3%) | 12mo | $235,000 | $163 | 74 |
| 4141 Deep Creek Rd #146 | 0.09mi | 2/2.0 | 1,248 (-10%) | 22mo | $225,000 | $180 | 60 |
| 4141 Deep Creek Rd #176 | 0.09mi | 3/2.0 (+1) | 1,536 (+10%) | 18mo | $252,000 | $164 | 58 |
| 324 Waikiki Cir | 0.72mi | 2/2.0 | 1,440 (+3%) | 3mo | $165,000 | $115 | 58 |
| 328 Waikiki Cir | 0.75mi | 2/2.0 | 1,344 (-3%) | 3mo | $215,000 | $160 | 57 |
| 293 Maui Cir | 0.73mi | 2/2.0 | 1,368 (-2%) | 13mo | $250,000 | $183 | 52 |
| 297 Maui Cir #297 | 0.70mi | 2/2.0 | 1,368 (-2%) | 16mo | $165,000 | $121 | 51 |
| 63 Palm Dr | 0.73mi | 2/2.0 | 1,344 (-3%) | 16mo | $225,000 | $167 | 47 |
| 365 Tahitian Cir #365 | 0.74mi | 2/2.0 | 1,440 (+3%) | 21mo | $220,000 | $153 | 42 |
| 289 Maui Cir | 0.72mi | 3/2.0 (+1) | 1,541 (+11%) | 12mo | $432,500 | $281 | 34 |
Match score weights: distance 35% · size 25% · config 20% · recency 20%. Top-matched comps best support the ARV.
Projected returns pro-forma
-3.0% appreciation · 3.21% rent growth · sell at horizon
- IRR
- 19.0%
- Equity multiple
- 1.77×
- Total profit
- $47,534
- Equity at exit
- $32,803
- IRR
- 27.5%
- Equity multiple
- 3.45×
- Total profit
- $150,790
- Equity at exit
- $19,022
Cash invested: $61,600 (down + closing). Projections, not guarantees.
Landlord ↔ Tenant lean methodology
- Overall (STATE)
- 18 Strongly Tenant-Friendly
- State California
- 18 Strongly Tenant-Friendly · D+13
- County
- — inherits STATE
- City
- — inherits STATE
ZIP-level market 94555
- Rents YoY
- 3.2%
- Active inventory
- 76
- Price-to-rent
- 5.1×
Monthly cashflow live
- Estimated rent
- $3,562 high interval (Pro) →
- Mortgage (P&I)
- −$1,154
- Tax est. 1.5%
- −$275 /mo · $3,300/yr
- Insurance
- −$92
- HOA
- −$0
- Vacancy / Maint / Mgmt
- −$748
- Net cashflow
- $1,293
Break-even live
Sensitivity live
| Price | -10% $1,445 | -5% $1,369 | +0% $1,293 | +5% $1,217 | +10% $1,141 |
|---|---|---|---|---|---|
| Rent | -10% $1,012 | -5% $1,153 | +0% $1,293 | +5% $1,434 | +10% $1,575 |
| Rate | -1.0pp $1,404 | -0.5pp $1,349 | base $1,293 | +0.5pp $1,236 | +1.0pp $1,178 |
UW: 25.0% down · 7.5% · 30yr · 1.5% tax · 5.0% vac · 8.0% maint · 8.0% mgmt
Financing live
Cash to close
- Down payment
- $55,000
- Closing costs
- $6,600
- Reserves months
- —
- Total cash needed
- —
Loan-product check · same deal, 3 products live
Conventional
25% down · 7.5% · 30yr
- Down + closing
- —
- Monthly P&I
- —
- Monthly cashflow
- —
- DSCR
- —
- Eligible?
- —
Personal DTI + credit; lowest rate.
DSCR
20% down · 8.5% · 30yr
- Down + closing
- —
- Monthly P&I
- —
- Monthly cashflow
- —
- DSCR
- —
- Eligible?
- —
No personal income docs; deal must DSCR.
Hard money
10% down · 12.0% · 12mo
- Down + closing
- —
- Monthly P&I
- —
- Monthly cashflow
- —
- DSCR
- —
- Eligible?
- —
Short-term bridge; refi at stabilization.
Rent comps 23 comps
| Address | Beds | Baths | Sqft | Rent | $/sqft | DOM | Units | Dist |
|---|---|---|---|---|---|---|---|---|
| 3842 Cardinal Ter Fremont, CA | 3.0 | 2.5 | 1607 | $4,100 | $2.55 | 19d | 1 | 0.48mi |
| 33877 Raven Ter Fremont, CA | 2.0 | 1.5 | 1315 | $3,700 | $2.81 | 16d | 1 | 0.53mi |
| 4806 Balthazar Ter Fremont, CA | 3.0 | 3.0 | 1755 | $4,250 | $2.42 | 0d | 1 | 0.73mi |
| 5016 Paseo Padre Pkwy Fremont, CA | 2.0 | 1.0–2.0 | 719 | $3,150 | $4.38 | 0d | 9 | 0.76mi |
| 4123 Asimuth Cir Union City, CA | 3.0 | 1.5 | 1280 | $3,350 | $2.62 | 45d | 1 | 0.83mi |
| 4292 Comet Cir Union City, CA | 3.0 | 1.5 | 1250 | $2,950 | $2.36 | 26d | 1 | 0.86mi |
| 34077 Paseo Padre Pkwy Fremont, CA | 1.0–2.0 | 1.0 | 788 | $2,887 | $3.66 | 0d | 12 | 0.89mi |
| 4132 Jamaica Ter Fremont, CA | 3.0 | 1.5 | 1166 | $2,890 | $2.48 | 0d | 1 | 0.98mi |
| 32468 Deborah Dr Union City, CA | 3.0 | 2.0 | 1340 | $3,949 | $2.95 | 26d | 1 | 0.99mi |
| 4910 Lowry Rd Union City, CA | 3.0 | 1.5 | 1129 | $3,500 | $3.10 | 45d | 1 | 1.02mi |
| 34426 Bentley Pl Fremont, CA | 3.0 | 2.0 | 1290 | $3,500 | $2.71 | 22d | 1 | 1.07mi |
| 34141 Gannon Ter Fremont, CA | 3.0 | 2.5 | 1324 | $4,000 | $3.02 | 0d | 1 | 1.10mi |
| 34573 Falls Ter Fremont, CA | 2.0 | 1.0 | 1000 | $3,000 | $3.00 | 14d | 1 | 1.12mi |
| 34573 Falls Ter Fremont, CA | 2.0 | 1.0 | 1000 | $3,000 | $3.00 | 0d | 1 | 1.12mi |
| 4739 Louise Ln Union City, CA | 3.0 | 2.0 | 1320 | $4,000 | $3.03 | 45d | 1 | 1.15mi |
| 34132 Spezia Ter Fremont, CA | 3.0 | 3.5 | 1481 | $3,900 | $2.63 | 20d | 1 | 1.16mi |
| 34130 Lugano Ter Fremont, CA | 3.0 | 3.5 | 1701 | $3,800 | $2.23 | 45d | 1 | 1.23mi |
| 2262 Eric Ct #4 Union City, CA | 3.0 | 1.5 | 1003 | $3,400 | $3.39 | 5d | 1 | 1.26mi |
| 5764 Via Lugano Fremont, CA | 3.0 | 3.5 | 1617 | $4,100 | $2.54 | 3d | 1 | 1.30mi |
| 33411 Madelyn Ter Union City, CA | 2.0 | 2.5 | 1441 | $3,798 | $2.64 | 19d | 1 | 1.39mi |
| 3307 San Marco Ct Union City, CA | 3.0 | 2.0 | 1349 | $3,900 | $2.89 | 4d | 1 | 1.45mi |
| 4402 Queen Anne Dr Union City, CA | 3.0 | 2.0 | 1357 | $4,200 | $3.10 | 3d | 1 | 1.46mi |
| 34397 Anzio Ter #21 Fremont, CA | 2.0 | 2.5 | 1395 | $3,500 | $2.51 | 45d | 1 | 1.47mi |
Listing history 14 events
-
2026-06-21days on market $220,000 Active 20 DOM
-
2026-06-18days on market $220,000 Active 17 DOM
-
2026-06-17days on market $220,000 Active 16 DOM
-
2026-06-16days on market $220,000 Active 15 DOM
-
2026-06-15days on market $220,000 Active 14 DOM
-
2026-06-13days on market $220,000 Active 12 DOM
-
2026-06-13days on market $220,000 Active 11 DOM
-
2026-06-09days on market $220,000 Active 8 DOM
-
2026-06-08days on market $220,000 Active 7 DOM
-
2026-06-07days on market $220,000 Active 6 DOM
-
2026-06-04days on market $220,000 Active 3 DOM
-
2026-06-03days on market $220,000 Active 2 DOM
-
2026-06-02remarks 699-char remark
-
2026-06-02$220,000 Active 1 DOM
ⓘ Source: listings_history table (triggers on properties + properties_extension) + one-shot
backfill from property_details.listing_events for pre-trigger history.
Climate risk First Street
- Flood 1/10 Low FEMA zone X (unshaded) · 0% chance over 30 yrs
- Wildfire 1/10 Low
- Heat 4/10 Moderate 7 d/yr ≥90°F today · 13 d/yr by 30 yrs out
- Wind 1/10 Low
- Air quality 7/10 Severe 12 unhealthy d/yr today · 12 by 30 yrs out
Nearby sold comps map
Loading sold comps map…
Walkable amenities ~0.75 mi
Loading nearby amenities…
Taxation est. · year 1
- Rental income
- $42,740
- − Mortgage interest
- −$12,323
- − Property taxes
- −$3,300
- − Insurance
- −$1,100
- − Repairs & maintenance
- −$3,419
- − Management
- −$3,419
- − Depreciation
- −$6,400
- Taxable income
- $12,779
- Est. tax owed @ 24.0%
- −$3,067
- After-tax cash flow
- $12,454/yr
For passive investors: Depreciation is non-cash, so a rental often shows a tax loss while cash-flowing — sheltering income. Rental losses are passive: they offset passive income freely, and up to $25,000/yr can offset ordinary (W-2) income if you actively participate and your MAGI is under $100k (phasing out to $0 by $150k); unused losses carry forward. On sale, claimed depreciation is recaptured at up to 25%, and gains may owe capital-gains tax (a 1031 exchange can defer both). Figures are a year-1 estimate at your 24.0% rate — not tax advice; consult a CPA.
Condition & rehab AI · 12 photos
This mobile home is in good condition with a good condition score of 75. It has a cosmetic rehab level and requires minimal repairs and maintenance. The highest-ROI updates would be painting, landscaping, window treatments, and kitchen appliances.
Value-add opportunities
- Both painting — Fresh paint can enhance curb appeal and interior aesthetics
- Both landscaping — A well-maintained yard can increase curb appeal and property value
- Both window treatments — Modern window treatments can improve energy efficiency and aesthetics
- Both kitchen appliances — Upgrading to more modern appliances can increase the home's appeal and value
Renovation cost estimate screening
Value-add ROI direction
- Both painting — Fresh paint can enhance curb appeal and interior aesthetics ↑
- Both landscaping — A well-maintained yard can increase curb appeal and property value ↑
- Both window treatments — Modern window treatments can improve energy efficiency and aesthetics ↑
- Both kitchen appliances — Upgrading to more modern appliances can increase the home's appeal and value ↑
ⓘ Cost ranges are severity-bucket heuristics (US national rule-of-thumb). Get contractor quotes + a written scope before underwriting a rehab budget.
Schools (NCES district)
- District
- Fremont Unified
- NCES district ID
- 0614400
- Math proficiency
- 76% ▲ 3.00%
- Reading proficiency
- 84% ▲ 6.00%
- Median HH income
- $105,489
- Composite
- 72.94/100
- National rank
- #191
- State rank
- #23 of 517 in CA
Livability — Fremont
- Score
- 85/100
- State rank
- #10
- US rank
- #561
Category grades
Schools grade is shown separately in the Schools card above.
Census & demographics
- Census place
- Fremont, CA
- County
- Alameda County · 1,614,355 people
- City population
- 228,297
- Metro
- San Francisco-Oakland-Berkeley, CA
- Population (ZIP)
- 37,501
- Household income
- $219,938
- Rent vs Own
- Severe rent burden
- 583.0
Population outlook (Alameda County) Hauer SSP2
- Today (2025)
- 1,928,884 people
- By 2030
- 2,069,146 · +7.3%
- By 2040
- 2,338,405 · +21.2%
- By 2050
- 2,586,608 · +34.1%
- By 2075
- 3,061,911 · +58.7%
- By 2100
- 3,234,133 · +67.7%
Race, ethnicity, and origin ACS 2023
- Neighborhood character
- Predominantly Asian (73%)
- Race & ethnicity
- Asian 73% White 13% Hispanic / Latino 7% Two or more races 7% Black 1%
- Hispanic origin (detail)
- Mexican 4%
- Common ancestry
- Lithuanian 1% Armenian 1% Russian 1%
- Foreign-born
- 53% · China, Canada, Vietnam
- Languages at home
- 33% English-only · Chinese 19% Other Indo-European 18% Other Asian/Pacific 15%
Political lean MEDSL · Alameda
- 2024 margin
- Solid D (+53.6) · D 74.6% · R 21.0% · Other 4.4%
- 2008→2024 swing
- -5.9pp toward R · 2008: 59.5pp · 2024: 53.6pp
- All cycles
- 2024: D+53.6 2020: D+62.5 2016: D+64.4 2012: D+59.8 2008: D+59.5
Not yet ingested
- Civics
- —
Market trends
- HPI YoY
- ▼ -1033.77%
- Current HPI
- 366.987
- Rent YoY
- ▲ 3.21%
- Metro
- San Francisco-Oakland-Berkeley, CA
- State GDP YoY
- ▲ 3.21%
- F500 in state
- 116
Industry mix (Fortune 500 HQ in CA)
| Industry | F500 HQs | Revenue |
|---|---|---|
| Technology | 27 | $1,492B |
|
||
| Financial Services | 3 | $174B |
|
||
| Retail | 3 | $44B |
|
||
| Insurance | 3 | $26B |
|
||
| Media / Entertainment | 2 | $115B |
|
||
| Pharmaceuticals / Biotech | 2 | $62B |
|
||
Price history
1 event — show timeline
- 2026-06-01 Listed $220,000 bridgeMLS, Bay East AOR, or Contra Costa AOR
Cash-flow waterfall
monthlySold comps — $/sqft
last 12 mo · ≤1 miLoading sold comps…