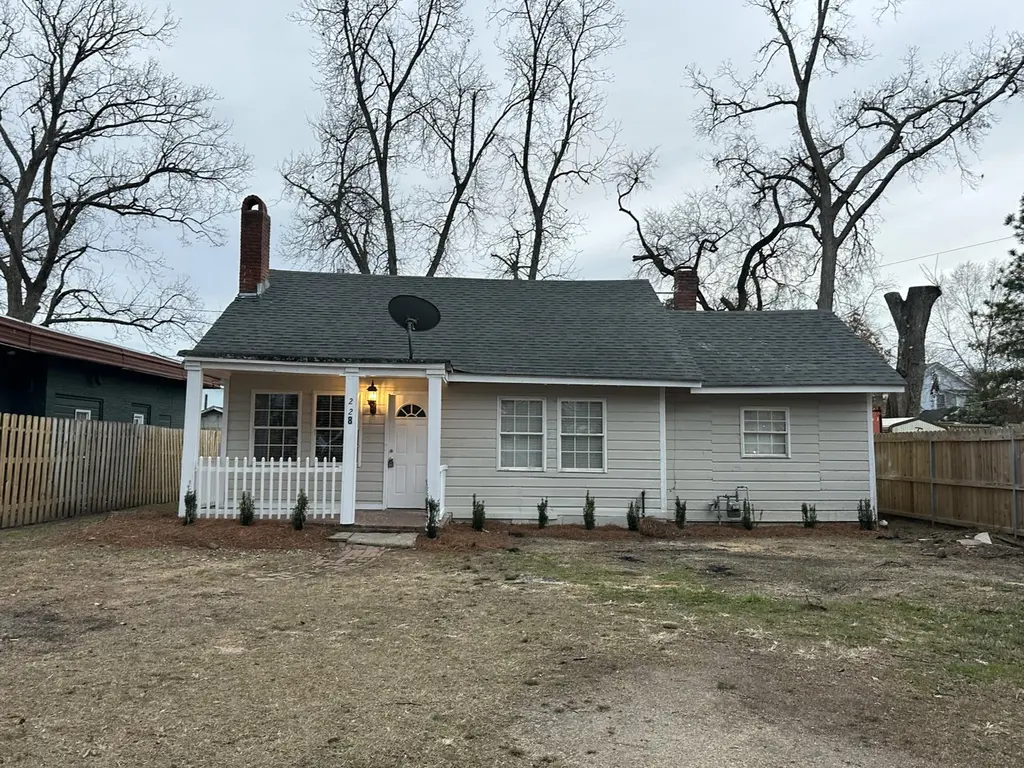
228 Greene St · Augusta-Richmond County consolidated government (balance), GA
Flood risk 1/10 · Minimal
- FEMA flood zone
- X
- Chance of flooding over 30 yrs
- 0.0%
- Est. flood insurance / yr
- $507 – $1,088
Fire risk 1/10 · Minimal
- Est. fire insurance / yr
- $963 – $1,789
Heat risk 8/10 · Major
- Hot days now (above 108°F)
- 7 days/yr
- Hot days in 30 yrs
- 17 days/yr
Wind risk 6/10 · Moderate
- Chance of severe wind over 30 yrs
- 67.0%
Air-quality risk 4/10 · Minor
- Unhealthy air days now
- 4 days/yr
- Unhealthy air days in 30 yrs
- 4 days/yr
Risk factors via First Street. Map © Google.
Why this score? — see what drove the D+ grade
The composite is a weighted blend of 9 inputs, each scored 0–100. Each bar is that input's sub-score; the figure is the points it added to the 100-point composite (weight × sub-score).
- ARV discount +15.0/15.0
- Cash flow +9.2/30.0
- Appreciation +9.1/10.0
- 1% rule +2.7/10.0
- DSCR +2.6/10.0
- Livability +2.5/5.0
- Condition / age +2.5/5.0
- Rent growth +2.2/5.0
- Schools +1.3/10.0
$135,000
🖨 Deal sheet 📄 Offer letter ✓ Due diligence
Listing remarks
Just in time to enjoy the newly updated streetscape on Greene Street, this Olde Town home is now available at 228 Greene. The home offers 3 bedrooms and 2 full bathrooms, along with a laundry room, dining room, and kitchen. The approximate square footage is 1,350 square feet, which differs from tax records. The property is set back off the street with parking in the front and sits on a wooded lot with a fenced backyard. Previously used as an investment property and rental, the home has had work done over time, though the quality is mixed. It's not perfect and could use TLC to make it your own, but it is clean, functional, and ready for its next owner. New hot water heater installed in 2025.
Key facts
- Wooded lot
- Fenced backyard
- 8,276 sq ft lot
Tags
Property features AI
Exterior
- Parking: Shared driveway
- Utilities: Public water; Public sewer
- Home design: Single-family residence; One story; Residential property in the Old Towne subdivision
- Construction: Wood siding; Metal and composition roof; Slab foundation; Built as a single-family home
- Exterior features: Porch; Fenced yard; Wooded lot; Street lights in the neighborhood
Interior
- Flooring: Ceramic tile; Hardwood
- Bathrooms: 2 full bathrooms
- Heating & cooling: Central air; Has heating
- Interior features: Fireplace(s); Ceramic tile and hardwood flooring; Total of 5 rooms; No basement
- Laundry & utility: Washer hookup
Neighborhood map
What this means for you Summary
Snapshot
- This is a 2-bed/1.5-bath single-family listed at $135k.
Deal economics
- At list price, monthly cash flow is $-102 ($-1k/yr) — negative.
- To cash-flow at today's rent, offer at most $117k (13.4% below list).
- To meet the 1% rule (rent ≥ 1% of price), the offer needs to be $103k (23.4% below list).
- Recommended offer: $103k (23.4% below list) — sets the bar for 1% rule.
Location & tenants
- Location reads: area grade D — affects rentability + tenant quality, not the cash-flow math above.
- Richmond County (urban): math 12% / reading 20% proficiency, ranked #154 of 174 in GA (top 88%) — low school quality limits family demand, transient renter base, plan for 1-2y turnover; 72% free/reduced lunch — lower-income household profile, screen leases tightly.
- Zoned schools: Lamar - Milledge Elementary School (math 12% / reading 12%, grade F, #1,041 of 1,228 statewide, top 87%, 301 students, 98% FRL); Langford Middle School (math 2% / reading 14%, grade F, #445 of 470 statewide, top 95%, 731 students, 98% FRL) — zoned schools average 98% FRL vs 72% district-wide (26 pts higher); higher-poverty schools than district average — tighter screening recommended.
- Market conditions: Rents soft (-1.3%/yr); 129 active listings in the ZIP; 40 comparable units currently listed for rent nearby; rentals lingering (median 44d on market — plan ~5-8 weeks vacancy on turnover, expect pricing pressure); 50% of comp listings sitting > 30 days — soft ceiling on asking rent; lower-income renter base — watch delinquency; 561 units permitted in Richmond County in 2024 (0 in 5+ unit buildings).
- At $1,034/mo this rent would consume 49% of the median local household income ($25k/yr) (locally 2063% of renters already pay >50% of income on rent) — very limited rent-growth headroom before tenants either downsize or default.
Forward outlook
- In year one you build about $12k of equity ($933 loan paydown + $11k appreciation (8.2% local appreciation)).
- Richmond County population projected to shrink 5% by 2050 — rents likely to lag national; underwrite the cash flow, not the appreciation.
- By year 4, paydown + projected appreciation supports a ~$42k cash-out refi (75% LTV) — recoverable capital for the next deal without selling this one.
Negotiation context
- It's been on market 38 days — a 3% lower offer ($131k) is reasonable based on typical stale-listing flexibility.
- 4 sale attempts; this cycle's ask has dropped $20k (13%) from the opening price — seller is motivated, your offer sets the floor, not the list.
- Current owner paid $25k; list at $135k implies a 440% gain — meaningful room to come down on a strong offer.
Risks & watch-outs
- Watch-outs: built in 1929 — expect roof / HVAC / electrical / plumbing capex.
- Climate carrying-cost: major wind risk, 67% chance of damaging wind over 30y; extreme-heat days projected 7→17/yr by 2055 (HVAC capex compounding) — expect insurance premiums to compound above CPI over the hold.
Questions for the listing agent
- What do current leases actually rent for vs. the listed asking? Can we see a recent rent roll and the last 12 months of T-12 income?
- It's been on market 38 days. Have you received any prior offers? Is the seller open to a 23% concession, seller financing, or rate buy-down credit?
- Built in 1929 — when were the roof, HVAC, electrical panel, plumbing, and water heater last replaced?
- Is there a deadline driving the sale (1031 exchange, divorce, estate, relocation)? That informs how much negotiation room exists.
- The area grade is low — what's the realistic commute time and amenity access for the typical tenant pool here? Any planned neighborhood developments (good or bad) we should know about?
- What's the average days-on-market for RENTAL listings here right now (not sales)? A rising rental-DOM trend means longer vacancies and softer asking-rent achievability than the comps imply.
- What's the recent tenant-quality profile in this submarket — average credit score on applications, eviction rate, late-payment / NSF rate, and stable-employment percentage? A property-management company in the area should have these aggregated.
- How much new for-sale + rental construction is in the pipeline within 1–3 miles? Heavy new supply typically softens prices + rents 12–24 months out; constrained supply supports both.
Investment metrics
- 1% rule
- 0.77% ✗
- Cap rate
- 5.38%
- Cash-on-cash
- -3.25%
- DSCR
- 0.86
- GRM
- 10.9
CMA / ARV
- ARV (median comp)
- $183,709
- List price
- $135,000
- Delta
- -26.51%
- Verdict
- UNDERPRICED
- Comps
- 20 within 1.0 mi
Show comp detail 8 sales within ~0.75 mi
| Address | Dist | Beds/Ba | Sqft | Sold | Price | $/sf | Match |
|---|---|---|---|---|---|---|---|
| 119 Telfair St | 0.15mi | 2/1.0 | 968 (-1%) | 13mo | $45,000 | $46 | 79 |
| 257 Watkins St | 0.18mi | 3/1.0 (+1) | 973 (-0%) | 11mo | $69,900 | $72 | 75 |
| 109 E E Walker St | 0.40mi | 3/1.5 (+1) | 1,100 (+13%) | 1mo | $50,000 | $45 | 54 |
| 109 Sibley St | 0.33mi | 2/2.0 | 1,062 (+9%) | 22mo | $165,000 | $155 | 50 |
| 821 1st St | 0.61mi | 2/1.0 | 909 (-7%) | 17mo | $75,500 | $83 | 44 |
| 608 Albany Ave | 0.69mi | 3/1.5 (+1) | 900 (-8%) | 9mo | $120,000 | $133 | 43 |
| 395 Azalea Ave | 0.64mi | 3/1.0 (+1) | 1,040 (+7%) | 15mo | $40,000 | $38 | 40 |
| 121 E Hall St | 0.69mi | 3/1.0 (+1) | 864 (-11%) | 20mo | $64,000 | $74 | 25 |
Match score weights: distance 35% · size 25% · config 20% · recency 20%. Top-matched comps best support the ARV.
Projected returns pro-forma
8.18% appreciation · 0.0% rent growth · sell at horizon
- IRR
- 17.0%
- Equity multiple
- 2.26×
- Total profit
- $47,632
- Equity at exit
- $104,223
- IRR
- 15.6%
- Equity multiple
- 4.64×
- Total profit
- $137,572
- Equity at exit
- $208,486
Cash invested: $37,800 (down + closing). Projections, not guarantees.
Landlord ↔ Tenant lean methodology
- Overall (STATE)
- 90 Strongly Landlord-Friendly
- State Georgia
- 90 Strongly Landlord-Friendly · R+3
- County
- — inherits STATE
- City
- — inherits STATE
ZIP-level market 30901
- Home prices YoY
- 4.1%
- Rents YoY
- -1.3%
- Active inventory
- 129
- Price-to-rent
- 10.9×
Monthly cashflow live
- Estimated rent
- $1,034 high interval (Pro) →
- Mortgage (P&I)
- −$708
- Tax from tax record
- −$155 /mo · $1,861/yr
- Insurance
- −$56
- HOA
- −$0
- Vacancy / Maint / Mgmt
- −$217
- Net cashflow
- $-102
Break-even live
UW: 25.0% down · 7.5% · 30yr · 1.5% tax · 5.0% vac · 8.0% maint · 8.0% mgmt
Financing live
Cash to close
- Down payment
- $33,750
- Closing costs
- $4,050
- Reserves months
- —
- Total cash needed
- —
Loan-product check · same deal, 3 products live
Conventional
25% down · 7.5% · 30yr
- Down + closing
- —
- Monthly P&I
- —
- Monthly cashflow
- —
- DSCR
- —
- Eligible?
- —
Personal DTI + credit; lowest rate.
DSCR
20% down · 8.5% · 30yr
- Down + closing
- —
- Monthly P&I
- —
- Monthly cashflow
- —
- DSCR
- —
- Eligible?
- —
No personal income docs; deal must DSCR.
Hard money
10% down · 12.0% · 12mo
- Down + closing
- —
- Monthly P&I
- —
- Monthly cashflow
- —
- DSCR
- —
- Eligible?
- —
Short-term bridge; refi at stabilization.
Rent comps 40 comps
| Address | Beds | Baths | Sqft | Rent | $/sqft | DOM | Units | Dist |
|---|---|---|---|---|---|---|---|---|
| 239 Greene St Augusta, GA | 1.0 | 1.0 | 700 | $825 | $1.18 | 43d | 1 | 0.10mi |
| 239 Greene St Unit A-3 Augusta, GA | 1.0 | 1.0 | 700 | $800 | $1.14 | 23d | 1 | 0.10mi |
| 320 3rd St Augusta, GA | 2.0 | 1.0 | 1117 | $1,200 | $1.07 | 43d | 1 | 0.12mi |
| 240 Ellis St Unit B Augusta, GA | 1.0 | 1.0 | 800 | $925 | $1.16 | 23d | 1 | 0.14mi |
| 240 Ellis St Unit A Augusta, GA | 1.0 | 1.0 | 600 | $885 | $1.48 | 23d | 1 | 0.14mi |
| 204 Ellis St Augusta, GA | 2.0 | 1.0 | 1029 | $1,350 | $1.31 | 13d | 1 | 0.14mi |
| 305 Walker St Unit A Augusta, GA | 2.0 | 1.0 | 925 | $925 | $1.00 | 43d | 1 | 0.14mi |
| 305 Walker St Unit A Augusta, GA | 2.0 | 1.0 | 925 | $925 | $1.00 | 23d | 1 | 0.14mi |
| 134 Broad St Augusta, GA | 2.0 | 1.0 | 1100 | $1,150 | $1.05 | 43d | 1 | 0.21mi |
| 410 4th St Unit A Augusta, GA | 2.0 | 1.5 | 925 | $985 | $1.06 | 23d | 1 | 0.21mi |
| 106 Ellis St Augusta, GA | 1.0 | 1.0 | 850 | $975 | $1.15 | 43d | 1 | 0.22mi |
| 112 3rd St Apt F Augusta, GA | 2.0 | 1.0 | 754 | $990 | $1.31 | 13d | 1 | 0.24mi |
| 401 Greene St Unit 204 Augusta, GA | 1.0 | 1.0 | 633 | $1,250 | $1.97 | 43d | 1 | 0.25mi |
| 110 3rd St Unit A Augusta, GA | 1.0 | 1.0 | 906 | $760 | $0.84 | 23d | 1 | 0.25mi |
| 110 3rd St Unit A Augusta, GA | 1.0 | 1.0 | 906 | $760 | $0.84 | 43d | 1 | 0.25mi |
| 133 Broad St Unit A Augusta, GA | 2.0 | 2.0 | 1000 | $975 | $0.97 | 43d | 1 | 0.25mi |
| 133 Broad St Unit A Augusta, GA | 2.0 | 2.0 | 1000 | $975 | $0.97 | 23d | 1 | 0.25mi |
| 133 Broad St Unit B Augusta, GA | 1.0 | 1.0 | 1000 | $800 | $0.80 | 43d | 1 | 0.25mi |
| 108 3rd St Unit A Augusta, GA | 2.0 | 1.0 | 754 | $900 | $1.19 | 23d | 1 | 0.26mi |
| 108 3rd St Unit A Augusta, GA | 2.0 | 1.0 | 754 | $900 | $1.19 | 43d | 1 | 0.26mi |
| 420 E Boundary Augusta, GA | 2.0 | 1.0 | 950 | $850 | $0.89 | 43d | 1 | 0.39mi |
| 537 Watkins St Unit B Augusta, GA | 1.0 | 1.0 | 725 | $705 | $0.97 | 43d | 1 | 0.51mi |
| 821 Forsythe St Augusta, GA | 2.0 | 1.0 | 754 | $895 | $1.19 | 13d | 1 | 0.55mi |
| 212 7th St Unit 301 Augusta, GA | 1.0 | 1.0 | 830 | $1,095 | $1.32 | 23d | 1 | 0.68mi |
| 714 Broad St Augusta, GA | 1.0 | 1.0 | 1000 | $895 | $0.90 | 13d | 1 | 0.73mi |
| 828 Broad St Unit B Augusta, GA | 2.0 | 1.0 | 750 | $995 | $1.33 | 43d | 1 | 0.86mi |
| 828 Broad St Augusta, GA | 2.0 | 1.0 | 750 | $995 | $1.33 | 23d | 1 | 0.86mi |
| 513 James Brown Blvd Augusta, GA | 1.0 | 1.0 | 718 | $1,375 | $1.91 | 13d | 2 | 0.95mi |
| 913 Walker St Augusta, GA | 2.0 | 2.0 | 1000 | $1,200 | $1.20 | 13d | 1 | 0.96mi |
| 709 Hall St Augusta, GA | 2.0 | 1.0 | 600 | $990 | $1.65 | 43d | 1 | 0.97mi |
| 936 Broad St #415 Augusta, GA | 1.0 | 1.0 | 701 | $1,750 | $2.50 | 43d | 1 | 1.01mi |
| 936 Broad St #208 Augusta, GA | 1.0 | 1.0 | 881 | $1,250 | $1.42 | 23d | 1 | 1.01mi |
| 1022 Broad St Apt A Augusta, GA | 1.0 | 1.0 | 665 | $1,075 | $1.62 | 43d | 1 | 1.12mi |
| 1030 Broad St Augusta, GA | 2.0 | 1.0 | 880 | $1,225 | $1.39 | 43d | 1 | 1.13mi |
| 1030 Broad St Unit D Augusta, GA | 2.0 | 1.0 | 880 | $1,015 | $1.15 | 43d | 1 | 1.13mi |
| 1030 Broad St Unit C Augusta, GA | 2.0 | 1.0 | 900 | $1,225 | $1.36 | 23d | 1 | 1.13mi |
| 1030 Broad St Unit D Augusta, GA | 2.0 | 1.0 | 880 | $1,015 | $1.15 | 23d | 1 | 1.13mi |
| 953 Hopkins St Augusta, GA | 3.0 | 1.0 | 806 | $1,100 | $1.36 | 43d | 1 | 1.23mi |
| 1204 Broad St Unit 1 Augusta, GA | 1.0 | 1.0 | 750 | $1,100 | $1.47 | 23d | 1 | 1.28mi |
| 1204 Broad St Unit 6 Augusta, GA | 1.0 | 1.0 | 900 | $1,200 | $1.33 | 43d | 1 | 1.28mi |
Listing history 23 events
-
2026-06-18days on market $135,000 Active 38 DOM
-
2026-06-17days on market $135,000 Active 37 DOM
-
2026-06-16days on market $135,000 Active 36 DOM
-
2026-06-15days on market $135,000 Active 35 DOM
-
2026-06-14days on market $135,000 Active 33 DOM
-
2026-06-10days on market $135,000 Active 30 DOM
-
2026-06-09days on market $135,000 Active 29 DOM
-
2026-06-08days on market $135,000 Active 28 DOM
-
2026-06-07pricedays on market $135,000 Active 27 DOM
-
2026-06-03days on market $140,000 Active 23 DOM
-
2026-06-02days on market $140,000 Active 22 DOM
-
2026-06-01days on market $140,000 Active 21 DOM
-
2026-05-31days on market $140,000 Active 20 DOM
-
2026-05-30days on market $140,000 Active 19 DOM
-
2026-05-11historical
-
2026-05-11historical
-
2026-04-23price $148,000
-
2026-01-26$155,000 Active
-
2026-01-26$140,000 Active
-
2025-12-31historical
-
2025-11-24$175,000
-
2025-11-24$175,000 Active
-
2005-05-06soldstatus $25,000
ⓘ Source: listings_history table (triggers on properties + properties_extension) + one-shot
backfill from property_details.listing_events for pre-trigger history.
Tax reassessment forecast GA · Resets to sale price
- Current annual tax
- $1,861 · $155/mo
- Projected year-2 tax
- $1,861 · $155/mo
- Expected delta
- $0/yr ($0/mo · 0.0%)
ⓘ Screening estimate from a state-policy table — verify with the county assessor before closing.
Climate risk First Street
- Flood 1/10 Low FEMA zone X · 0% chance over 30 yrs
- Wildfire 1/10 Low
- Heat 8/10 Severe 7 d/yr ≥108°F today · 17 d/yr by 30 yrs out
- Wind 6/10 Major 67% chance of damaging wind over 30 yrs
- Air quality 4/10 Moderate 4 unhealthy d/yr today · 4 by 30 yrs out
Nearby sold comps map
Loading sold comps map…
Walkable amenities ~0.75 mi
Loading nearby amenities…
Taxation est. · year 1
- Rental income
- $12,409
- − Mortgage interest
- −$7,562
- − Property taxes
- −$1,861
- − Insurance
- −$675
- − Repairs & maintenance
- −$993
- − Management
- −$993
- − Depreciation
- −$3,927
- Taxable loss
- −$3,601
- Est. tax savings @ 24.0%
- +$864
- After-tax cash flow
- $-364/yr
For passive investors: Depreciation is non-cash, so a rental often shows a tax loss while cash-flowing — sheltering income. Rental losses are passive: they offset passive income freely, and up to $25,000/yr can offset ordinary (W-2) income if you actively participate and your MAGI is under $100k (phasing out to $0 by $150k); unused losses carry forward. On sale, claimed depreciation is recaptured at up to 25%, and gains may owe capital-gains tax (a 1031 exchange can defer both). Figures are a year-1 estimate at your 24.0% rate — not tax advice; consult a CPA.
Schools (NCES district)
- District
- Richmond County
- NCES district ID
- 1304380
- Math proficiency
- 12% ▼ -9.00%
- Reading proficiency
- 20% ▼ -6.00%
- Median HH income
- $38,069
- Composite
- 13.43/100
- National rank
- #9524
- State rank
- #154 of 174 in GA
Livability — Augusta-Richmond County consolidated government (balance)
No livability data for this city. (Only ~50 U.S. cities are tracked.)
Census & demographics
- Census place
- Augusta-Richmond County consolidated government (balance), GA
- County
- Richmond County · 190,917 people
- City population
- 154,035
- Metro
- Augusta-Richmond County, GA-SC
- Population (ZIP)
- 16,484
- Household income
- $25,163
- Rent vs Own
- Severe rent burden
- 2063.0
Population outlook (Richmond County) Hauer SSP2
- Today (2025)
- 200,753 people
- By 2030
- 200,232 · -0.3%
- By 2040
- 196,813 · -2.0%
- By 2050
- 190,347 · -5.2%
- By 2075
- 172,496 · -14.1%
- By 2100
- 146,284 · -27.1%
Race, ethnicity, and origin ACS 2023
- Neighborhood character
- Predominantly Black (78%)
- Race & ethnicity
- Black 78% White 15% Two or more races 4% Hispanic / Latino 2%
- Common ancestry
- Lithuanian 1% Slovak 1%
- Foreign-born
- 1% · Canada
- Languages at home
- 97% English-only · Spanish 1%
Political lean MEDSL · Richmond
- 2024 margin
- Solid D (+36.1) · D 67.8% · R 31.7%
- 2008→2024 swing
- +4.3pp toward D · 2008: 31.8pp · 2024: 36.1pp
- All cycles
- 2024: D+36.1 2020: D+37.2 2016: D+32.4 2012: D+33.8 2008: D+31.8
Not yet ingested
- Civics
- —
Market trends
- HPI YoY
- ▲ 8.18%
- Current HPI
- 206.3145
- Rent YoY
- ▼ -1.31%
- Metro
- Augusta-Richmond County, GA-SC
- State GDP YoY
- ▲ 2.66%
- F500 in state
- 28
Industry mix (Fortune 500 HQ in GA)
| Industry | F500 HQs | Revenue |
|---|---|---|
| Paper / Packaging | 2 | $29B |
|
||
| Retail | 1 | $160B |
|
||
| Transportation / Logistics | 1 | $91B |
|
||
| Airlines | 1 | $62B |
|
||
| Consumer Goods | 1 | $47B |
|
||
| Utilities | 1 | $25B |
|
||
Price history
+440.0% since first listed10 events — show timeline
- 2026-06-04 Price Changed $135,000 Hive MLS
- 2026-05-11 Listing Removed — Hive MLS
- 2026-05-11 Listing Removed — Hive MLS
- 2026-04-23 Price Changed $148,000 Hive MLS
- 2026-01-26 Listed $155,000 Hive MLS
- 2026-01-26 Listed $140,000 Hive MLS
- 2025-12-31 Listing Removed — Hive MLS
- 2025-11-24 Listed $175,000 Hive MLS
- 2025-11-24 Listed $175,000 Hive MLS
- 2005-05-06 Sold (Public Records) $25,000 Public Records
Property tax history
+6.0%/yrLatest (2025): $1,861 · +6.8% YoY. Source: county tax records.
Cash-flow waterfall
monthlySold comps — $/sqft
last 12 mo · ≤1 miLoading sold comps…