1540 NE 191st St #145 · Ojus, FL
Flood risk 5/10 · Moderate
- FEMA flood zone
- AE
- Chance of flooding over 30 yrs
- 0.26%
- Est. flood insurance / yr
- $1,737 – $8,500
Fire risk 1/10 · Minimal
- Est. fire insurance / yr
- $947 – $1,759
Heat risk 10/10 · Severe
- Hot days now (above 104°F)
- 7 days/yr
- Hot days in 30 yrs
- 27 days/yr
Wind risk 10/10 · Severe
- Chance of severe wind over 30 yrs
- 99.0%
Air-quality risk 2/10 · Minimal
- Unhealthy air days now
- 2 days/yr
- Unhealthy air days in 30 yrs
- 2 days/yr
Risk factors via First Street. Map © Google.
Why this score? — see what drove the B- grade
The composite is a weighted blend of 9 inputs, each scored 0–100. Each bar is that input's sub-score; the figure is the points it added to the 100-point composite (weight × sub-score).
- Cash flow +28.9/30.0
- 1% rule +10.0/10.0
- DSCR +10.0/10.0
- ARV discount +7.5/15.0
- Schools +4.2/10.0
- Livability +4.2/5.0
- Rent growth +2.6/5.0
- Condition / age +2.5/5.0
- Appreciation +0.0/10.0
$210,000
🖨 Deal sheet 📄 Offer letter ✓ Due diligence
Listing remarks MLS
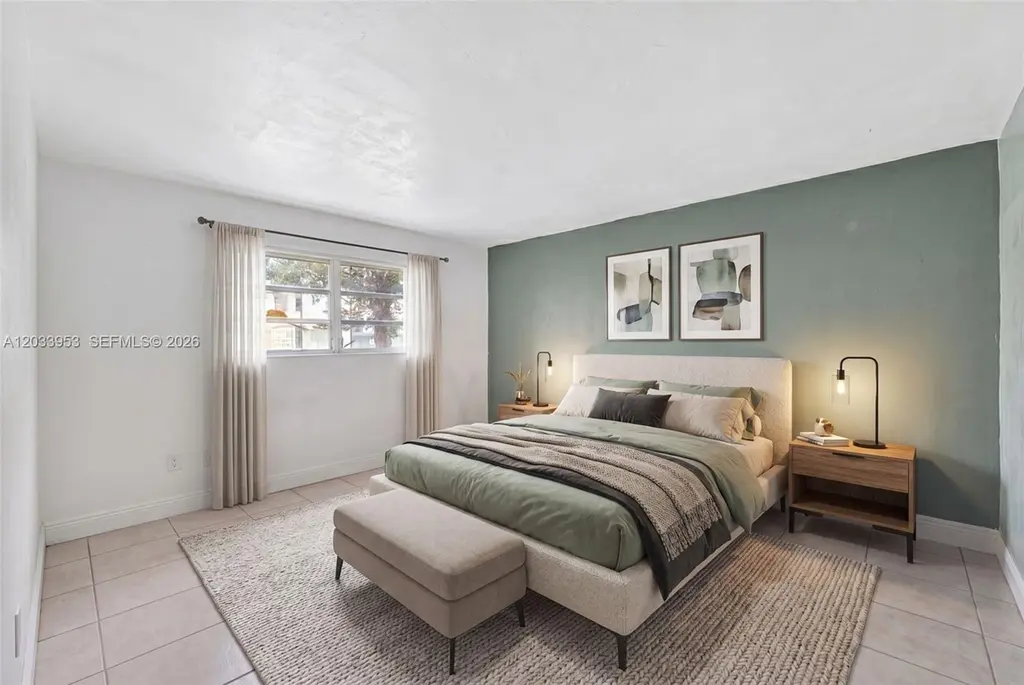
SPACIOUS CORNER DELUXE UNIT. FIRST FLOOR 2 BEDROOMS AND 2 BATH. VERY GOOD SCHOOLS, ELEMENTARY RATED A AND MIDDLE RATED B. CLOSE TO MAJOR ROADS, SHOPPING AREAS, AVENTURA MALL ONLY 5 MINUTES AWAY. NO RENTAL OR AGE RESTRISCTIONS. PERFERT FOR FIRST TIME HOME BUYERS OR INVESTMENT PROPERTY.
Key facts
- Scenic lake views
- Fitness center
- Community amenities
Tags
Property features AI
Finance
- Financial info: Pets allowed with restrictions
- HOA & community: Monthly association fee of $614; Association amenities include a pool; Association fee includes management, amenities, hot water, parking, pest control, roof, trash, and water
Exterior
- Parking: 1 covered garage space; One parking space
- Security: Security system
- Utilities: Has heating
- Home design: Attached property; 3-story building; Entry on level 1; Effective year built
- Construction: Block construction
- Exterior features: Balcony; Enclosed porch; Porch; Screened porch
Interior
- Kitchen: Dishwasher; Microwave
- Flooring: Ceramic tile
- Bathrooms: 2 full bathrooms
- Heating & cooling: Central heating
- Interior features: First-floor entry; Other interior features
Neighborhood map
What this means for you Summary
Snapshot
- This is a 2-bed/2.0-bath condo listed at $210k.
Deal economics
- At list price, monthly cash flow is $285 ($3k/yr) — positive.
- The deal already cash-flows at list — no discount required.
- Meets the 1% rule at list price ($3k rent vs $210k).
Location & tenants
- Location reads 83/100 on livability (#58 in FL, #1,031 nationally) — a professional / high-income tenant draw. Strengths: commute A+, housing A+, health & safety A+; Watch: schools D+, amenities F.
- Miami-Dade (suburban): math 45% / reading 54% proficiency, ranked #40 of 73 in FL (top 55%) — families likely to look elsewhere, expect single-tenant / working-renter base with shorter leases; 64% free/reduced lunch — lower-income household profile, screen leases tightly.
- Market conditions: Rents flat; 572 active listings in the ZIP; 10,051 units permitted in Miami-Dade County in 2024 (7,758 in 5+ unit buildings).
- At $3,494/mo this rent would consume 64% of the median local household income ($65k/yr) (locally 3123% of renters already pay >50% of income on rent) — very limited rent-growth headroom before tenants either downsize or default.
Forward outlook
- Local home prices are declining (-3.0%/yr); year-one equity from $1k of loan paydown is wiped out by about $6k of value loss. Plan a longer hold.
- Miami-Dade County population projected at +28% by 2050 — long-run rental-demand tailwind backs the buy-and-hold thesis.
Negotiation context
- Only 9 days on market — expect competitive offers; lowballing is unlikely to land.
- 6 sale attempts since 13y ago with the ask held roughly flat each time — persistent listings suggest the price (not the market) is what's stuck; bring a comps-based counter.
Risks & watch-outs
- Watch-outs: flood insurance adds $427/mo.
- Climate carrying-cost: in FEMA flood zone AE (mandatory federal flood insurance); severe wind risk, 99% chance of damaging wind over 30y; extreme-heat days projected 7→27/yr by 2055 (HVAC capex compounding) — expect insurance premiums to compound above CPI over the hold.
Questions for the listing agent
- Built in 1967 — when were the roof, HVAC, electrical panel, plumbing, and water heater last replaced?
- What's the actual annual flood-insurance premium (NFIP or private), and is the property in a SFHA with mandatory coverage?
- What does the HOA fee cover, when was the last increase, and are there any pending special assessments or reserve-fund shortfalls?
- Any open or pending special assessments — roof, HVAC, plumbing, elevator, façade? What's the per-unit balance and payoff schedule, and is the seller paying it off at close or rolling it to the buyer?
- Is there a deadline driving the sale (1031 exchange, divorce, estate, relocation)? That informs how much negotiation room exists.
- Schools are D-rated, which usually means shorter tenancies and higher turnover. Who's the typical renter profile here, and what's been the actual vacancy rate?
- What's the average days-on-market for RENTAL listings here right now (not sales)? A rising rental-DOM trend means longer vacancies and softer asking-rent achievability than the comps imply.
- What's the recent tenant-quality profile in this submarket — average credit score on applications, eviction rate, late-payment / NSF rate, and stable-employment percentage? A property-management company in the area should have these aggregated.
- How much new apartment / multifamily construction is in the pipeline within 1–3 miles? Heavy new supply (>2% of stock underway) typically softens rents 12–24 months out; light construction supports rent growth.
Investment metrics
- 1% rule
- 1.66% ✓
- Cap rate
- 10.36%
- Cash-on-cash
- 14.52%
- DSCR
- 1.65
- GRM
- 5.0
CMA / ARV
No comps found within radius.
Projected returns pro-forma
-3.0% appreciation · 0.22% rent growth · sell at horizon
- IRR
- -12.1%
- Equity multiple
- 0.58×
- Total profit
- $-24,715
- Equity at exit
- $31,312
- IRR
- -11.5%
- Equity multiple
- 0.45×
- Total profit
- $-32,301
- Equity at exit
- $18,157
Cash invested: $58,800 (down + closing). Projections, not guarantees.
Landlord ↔ Tenant lean methodology
- Overall (STATE)
- 87 Strongly Landlord-Friendly
- State Florida
- 87 Strongly Landlord-Friendly · R+3
- County
- — inherits STATE
- City
- — inherits STATE
ZIP-level market 33179
- Rents YoY
- 0.2%
- Active inventory
- 572
- Price-to-rent
- 5.0×
Monthly cashflow live
- Estimated rent
- $3,494 medium interval (Pro) →
- Mortgage (P&I)
- −$1,101
- Tax from tax record
- −$246 /mo · $2,957/yr
- Insurance
- −$88
- Flood insurance flood zone
- −$427 /mo · $5,118/yr
- HOA
- −$614
- Vacancy / Maint / Mgmt
- −$734
- Net cashflow
- $285
Break-even live
UW: 25.0% down · 7.5% · 30yr · 1.5% tax · 5.0% vac · 8.0% maint · 8.0% mgmt
Financing live
Cash to close
- Down payment
- $52,500
- Closing costs
- $6,300
- Reserves months
- —
- Total cash needed
- —
Loan-product check · same deal, 3 products live
Conventional
25% down · 7.5% · 30yr
- Down + closing
- —
- Monthly P&I
- —
- Monthly cashflow
- —
- DSCR
- —
- Eligible?
- —
Personal DTI + credit; lowest rate.
DSCR
20% down · 8.5% · 30yr
- Down + closing
- —
- Monthly P&I
- —
- Monthly cashflow
- —
- DSCR
- —
- Eligible?
- —
No personal income docs; deal must DSCR.
Hard money
10% down · 12.0% · 12mo
- Down + closing
- —
- Monthly P&I
- —
- Monthly cashflow
- —
- DSCR
- —
- Eligible?
- —
Short-term bridge; refi at stabilization.
HOA detail condo
- Monthly dues
- $614 · $7,368/yr
- Assessments
- None detected in remarks — confirm with the listing agent.
Listing history 33 events
-
2026-06-18days on market $210,000 Active 9 DOM
-
2026-06-17days on market $210,000 Active 8 DOM
-
2026-06-16days on market $210,000 Active 7 DOM
-
2026-06-15days on market $210,000 Active 6 DOM
-
2026-06-13days on market $210,000 Active 4 DOM
-
2026-06-10pricedays on market $210,000 Active 1 DOM
-
2026-06-02days on market $220,000 Active 153 DOM
-
2026-06-01days on market $220,000 Active 152 DOM
-
2026-05-31days on market $220,000 Active 151 DOM
-
2025-12-31$220,000 Active
-
2023-09-01soldstatus $192,000
-
2023-08-07soldstatus $192,000 Closed 289-char remark
Show marketing remark (289 chars)
SPACIOUS CORNER DELUXE UNIT. FIRST FLOOR 2 BEDROOMS AND 2 BATH. VERY GOOD SCHOOLS, ELEMENTARY RATED A AND MIDDLE RATED B. CLOSE TO MAJOR ROADS, SHOPPING AREAS, AVENTURA MALL ONLY 5 MINUTES AWAY. NO RENTAL OR AGE RESTRISCTIONS. PERFERT FOR FIRST TIME HOME BUYERS OR INVESTMENT PROPERTY.
-
2023-07-15historical Active Under Contract 289-char remark
Show marketing remark (289 chars)
SPACIOUS CORNER DELUXE UNIT. FIRST FLOOR 2 BEDROOMS AND 2 BATH. VERY GOOD SCHOOLS, ELEMENTARY RATED A AND MIDDLE RATED B. CLOSE TO MAJOR ROADS, SHOPPING AREAS, AVENTURA MALL ONLY 5 MINUTES AWAY. NO RENTAL OR AGE RESTRISCTIONS. PERFERT FOR FIRST TIME HOME BUYERS OR INVESTMENT PROPERTY.
-
2023-06-27$199,999 Active 289-char remark
Show marketing remark (289 chars)
SPACIOUS CORNER DELUXE UNIT. FIRST FLOOR 2 BEDROOMS AND 2 BATH. VERY GOOD SCHOOLS, ELEMENTARY RATED A AND MIDDLE RATED B. CLOSE TO MAJOR ROADS, SHOPPING AREAS, AVENTURA MALL ONLY 5 MINUTES AWAY. NO RENTAL OR AGE RESTRISCTIONS. PERFERT FOR FIRST TIME HOME BUYERS OR INVESTMENT PROPERTY.
-
2023-06-22historical
-
2023-05-27price $199,999
-
2023-05-08price $210,000
-
2023-03-31$230,000 Active
-
2021-04-05historical
-
2021-01-25$160,000 Active
-
2015-02-11soldstatus $92,000
-
2015-02-10soldstatus $92,000 Sold
-
2015-01-13status Pending
-
2014-12-05price $97,900
-
2014-11-25price $102,900
-
2014-11-25status Active
-
2014-03-04historical
-
2013-12-31status Pending
-
2013-10-24price $105,000
-
2013-10-24$105 Active
-
2011-09-26soldstatus $50,000
-
1988-10-01soldstatus $35,000
-
1988-10-01soldstatus $35,000
ⓘ Source: listings_history table (triggers on properties + properties_extension) + one-shot
backfill from property_details.listing_events for pre-trigger history.
Tax reassessment forecast FL · Resets to sale price
- Current annual tax
- $2,957 · $246/mo
- Projected year-2 tax
- $2,957 · $246/mo
- Expected delta
- $0/yr ($0/mo · 0.0%)
ⓘ Screening estimate from a state-policy table — verify with the county assessor before closing.
Climate risk First Street
- Flood 5/10 Major FEMA zone AE · 26% chance over 30 yrs
- Wildfire 1/10 Low
- Heat 10/10 Extreme 7 d/yr ≥104°F today · 27 d/yr by 30 yrs out
- Wind 10/10 Extreme 99% chance of damaging wind over 30 yrs
- Air quality 2/10 Low 2 unhealthy d/yr today · 2 by 30 yrs out
Nearby sold comps map
Loading sold comps map…
Walkable amenities ~0.75 mi
Loading nearby amenities…
Taxation est. · year 1
- Rental income
- $41,932
- − Mortgage interest
- −$11,763
- − Property taxes
- −$2,957
- − Insurance
- −$6,169
- − Repairs & maintenance
- −$3,355
- − Management
- −$3,355
- − HOA
- −$7,368
- − Depreciation
- −$6,109
- Taxable income
- $858
- Est. tax owed @ 24.0%
- −$206
- After-tax cash flow
- $3,212/yr
For passive investors: Depreciation is non-cash, so a rental often shows a tax loss while cash-flowing — sheltering income. Rental losses are passive: they offset passive income freely, and up to $25,000/yr can offset ordinary (W-2) income if you actively participate and your MAGI is under $100k (phasing out to $0 by $150k); unused losses carry forward. On sale, claimed depreciation is recaptured at up to 25%, and gains may owe capital-gains tax (a 1031 exchange can defer both). Figures are a year-1 estimate at your 24.0% rate — not tax advice; consult a CPA.
Schools (NCES district)
- District
- Miami-Dade
- NCES district ID
- 1200390
- Math proficiency
- 45% ▼ -16.00%
- Reading proficiency
- 54% ▼ -5.00%
- Median HH income
- $43,928
- Composite
- 41.76/100
- National rank
- #3397
- State rank
- #40 of 73 in FL
Livability — Ojus
- Score
- 83/100
- State rank
- #58
- US rank
- #1031
Category grades
Schools grade is shown separately in the Schools card above.
Census & demographics
- Census place
- Ojus, FL
- County
- Miami-Dade County · 2,697,751 people
- Metro
- Miami-Fort Lauderdale-Pompano Beach, FL
- Population (ZIP)
- 51,591
- Household income
- $65,211
- Rent vs Own
- Severe rent burden
- 3123.0
Population outlook (Miami-Dade County) Hauer SSP2
- Today (2025)
- 3,126,439 people
- By 2030
- 3,325,765 · +6.4%
- By 2040
- 3,697,561 · +18.3%
- By 2050
- 4,012,134 · +28.3%
- By 2075
- 4,605,612 · +47.3%
- By 2100
- 4,866,598 · +55.7%
Race, ethnicity, and origin ACS 2023
- Neighborhood character
- Diverse neighborhood (Simpson 0.67)
- Race & ethnicity
- Black 39% Hispanic / Latino 38% Two or more races 23% White 19% Asian 1%
- Hispanic origin (detail)
- Mexican 1% Puerto Rican 2% Cuban 6% Dominican 3% Salvadoran 3%
- Common ancestry
- Hispanic 13% Scotch-Irish 2% Romanian 2%
- Foreign-born
- 48% · Canada, Jamaica, Dominican Republic
- Languages at home
- 42% English-only · Spanish 37% French/Haitian/Cajun 13% Other Indo-European 2%
Political lean MEDSL · Miami-Dade
- 2024 margin
- R (+11.4) · D 43.9% · R 55.4%
- 2008→2024 swing
- -27.6pp toward R · 2008: 16.1pp · 2024: -11.4pp
- All cycles
- 2024: R+11.4 2020: D+7.3 2016: D+29.6 2012: D+23.7 2008: D+16.1
Not yet ingested
- Civics
- —
Market trends
- HPI YoY
- ▼ -608.34%
- Current HPI
- 328.1733
- Rent YoY
- ▲ 0.22%
- Metro
- Miami-Fort Lauderdale-Pompano Beach, FL
- State GDP YoY
- ▲ 3.28%
- F500 in state
- 36
Industry mix (Fortune 500 HQ in FL)
| Industry | F500 HQs | Revenue |
|---|---|---|
| Industrial Technology | 2 | $29B |
|
||
| Insurance | 2 | $17B |
|
||
| Retail | 1 | $60B |
|
||
| Technology Distribution | 1 | $58B |
|
||
| Homebuilding | 1 | $35B |
|
||
| Technology Manufacturing | 1 | $35B |
|
||
Price history
+528.6% since first listed24 events — show timeline
- 2025-12-31 Listed $220,000 MARMLS
- 2023-09-01 Sold (Public Records) $192,000 Public Records
- 2023-08-07 Sold (MLS) $192,000 Beaches MLS
- 2023-07-15 Contingent — Beaches MLS
- 2023-06-27 Listed $199,999 Beaches MLS
- 2023-06-22 Listing Removed — Beaches MLS
- 2023-05-27 Price Changed $199,999 Beaches MLS
- 2023-05-08 Price Changed $210,000 Beaches MLS
- 2023-03-31 Listed $230,000 Beaches MLS
- 2021-04-05 Listing Removed — MARMLS
- 2021-01-25 Listed $160,000 MARMLS
- 2015-02-11 Sold (Public Records) $92,000 Public Records
- 2015-02-10 Sold (MLS) $92,000 MARMLS
- 2015-01-13 Pending — MARMLS
- 2014-12-05 Price Changed $97,900 MARMLS
- 2014-11-25 Price Changed $102,900 MARMLS
- 2014-11-25 Relisted — MARMLS
- 2014-03-04 Listing Removed — MARMLS
- 2013-12-31 Pending — MARMLS
- 2013-10-24 Price Changed $105,000 MARMLS
- 2013-10-24 Listed $105 MARMLS
- 2011-09-26 Sold (MLS) $50,000 MARMLS
- 1988-10-01 Sold (Public Records) $35,000 Public Records
- 1988-10-01 Sold (Public Records) $35,000 Public Records
Property tax history
+16.5%/yrLatest (2025): $2,957 · +4.9% YoY. Source: county tax records.
Cash-flow waterfall
monthlySold comps — $/sqft
last 12 mo · ≤1 miLoading sold comps…