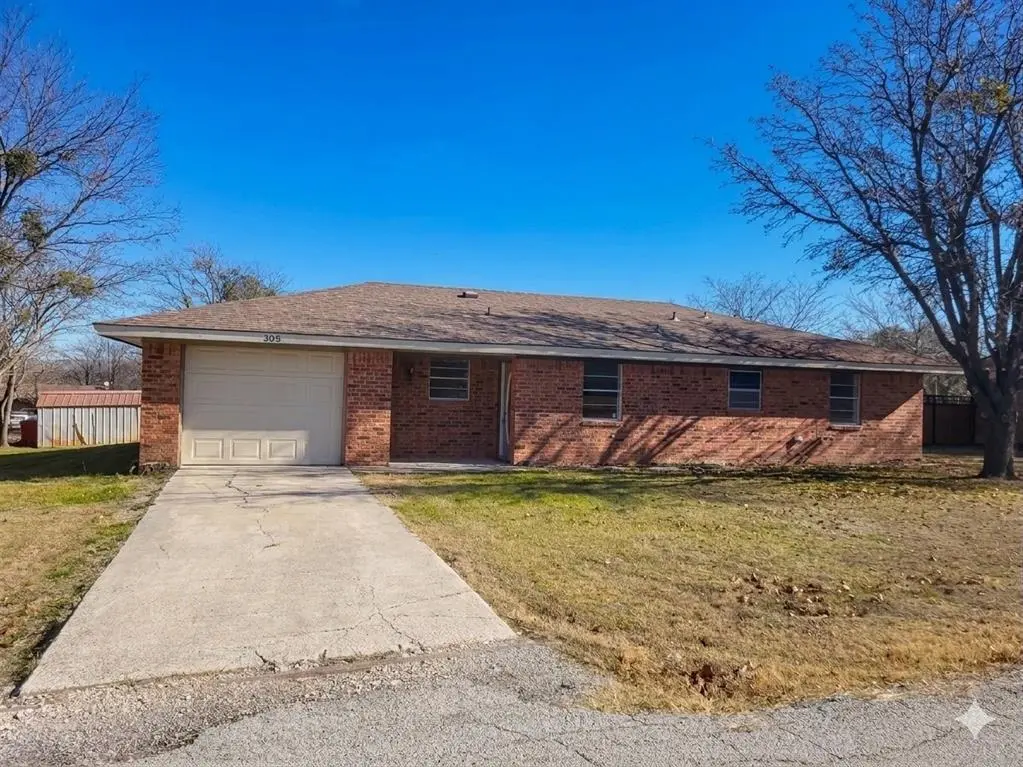
305 Sierra Vista Dr · Chico, TX
Flood risk 1/10 · Minimal
- FEMA flood zone
- X (unshaded)
- Chance of flooding over 30 yrs
- 0.0%
- Est. flood insurance / yr
- $507 – $1,088
Fire risk 6/10 · Moderate
- Est. fire insurance / yr
- $1,222 – $2,270
Heat risk 6/10 · Moderate
- Hot days now (above 110°F)
- 7 days/yr
- Hot days in 30 yrs
- 21 days/yr
Wind risk 4/10 · Minor
- Chance of severe wind over 30 yrs
- 17.0%
Air-quality risk 2/10 · Minimal
- Unhealthy air days now
- 1 days/yr
- Unhealthy air days in 30 yrs
- 2 days/yr
Risk factors via First Street. Map © Google.
Why this score? — see what drove the C- grade
The composite is a weighted blend of 9 inputs, each scored 0–100. Each bar is that input's sub-score; the figure is the points it added to the 100-point composite (weight × sub-score).
- Cash flow +16.5/30.0
- ARV discount +15.0/15.0
- DSCR +5.1/10.0
- 1% rule +4.7/10.0
- Schools +3.4/10.0
- Livability +3.4/5.0
- Rent growth +2.5/5.0
- Condition / age +2.5/5.0
- Appreciation +0.0/10.0
$175,000
🖨 Deal sheet (PDF) 📄 Offer letter ✓ Due diligence
Listing remarks MLS
Great turn-key investment opportunity offering instant cash flow at a great value. Current tenant lease until January 31, 2027, with the option to renew. Inside this updated home, you'll find an open floor plan with durable ceramic tile flooring throughout, making the home both functional and easy to maintain. The large backyard provides plenty of space for outdoor activities, pets, or future customization. Major updates provide peace of mind, including a new HVAC system installed in 2023, a new roof in 2025, a new water heater in 2022, a new garage door in 2025, and updated bathrooms. Whether you're an investor looking for steady income or a buyer planning for a future home near Lake Bridgeport, this property offers flexibility and value for quiet country living. Chico offers quaint boutique shopping and dining, yet it is only 15-20 minutes from Bridgeport and Decatur for more options. There is no survey.
Key facts
- Open floor plan
- Large backyard
- New water heater
Tags
Neighborhood map
What this means for you Summary
Snapshot
- This is a 3-bed/2.0-bath single-family listed at $175k.
Deal economics
- At list price, monthly cash flow is $102 ($1k/yr) — positive.
- The deal already cash-flows at list — no discount required.
- To meet the 1% rule (rent ≥ 1% of price), the offer needs to be $170k (3.1% below list).
- Recommended offer: $159k (9.0% below list) — sets the bar for market timing.
- Cap rate 7.0% vs local median 2.7% in Chico — top-decile yield for the area; either an underpriced asset or a hidden risk that comps aren't pricing in. Stress-test before assuming the spread holds.
Location & tenants
- Location reads 68/100 on livability (#508 in TX) — a middle-class / working-renter tenant base. Strengths: cost of living A+, housing A+, crime A; Watch: health & safety C-, schools D+, employment D+.
- Chico ISD (rural): math 38% / reading 41% proficiency, ranked #424 of 826 in TX (top 51%) — families likely to look elsewhere, expect single-tenant / working-renter base with shorter leases.
- Market conditions: 136 active listings in the ZIP; 460 units permitted in Wise County in 2024 (243 in 5+ unit buildings).
Forward outlook
- Local home prices are declining (-3.0%/yr); year-one equity from $1k of loan paydown is wiped out by about $5k of value loss. Plan a longer hold.
- Wise County population projected at +27% by 2050 — long-run rental-demand tailwind backs the buy-and-hold thesis.
Negotiation context
- It's been on market 101 days — a 9% lower offer ($159k) is reasonable based on typical stale-listing flexibility.
- 5 sale attempts since 3y ago; this cycle's ask has dropped $25k (12%) from the opening price — seller is motivated, your offer sets the floor, not the list.
Risks & watch-outs
- Climate carrying-cost: major wildfire risk; extreme-heat days projected 7→21/yr by 2055 (HVAC capex compounding) — expect insurance premiums to compound above CPI over the hold.
Questions for the listing agent
- It's been on market 101 days. Have you received any prior offers? Is the seller open to a 9% concession, seller financing, or rate buy-down credit?
- Why hasn't it sold? Are there any deal-killer items the seller is aware of (foundation, flood, title, zoning, code violations)?
- Is there a deadline driving the sale (1031 exchange, divorce, estate, relocation)? That informs how much negotiation room exists.
- Schools are D-rated, which usually means shorter tenancies and higher turnover. Who's the typical renter profile here, and what's been the actual vacancy rate?
- What's the average days-on-market for RENTAL listings here right now (not sales)? A rising rental-DOM trend means longer vacancies and softer asking-rent achievability than the comps imply.
- What's the recent tenant-quality profile in this submarket — average credit score on applications, eviction rate, late-payment / NSF rate, and stable-employment percentage? A property-management company in the area should have these aggregated.
- How much new for-sale + rental construction is in the pipeline within 1–3 miles? Heavy new supply typically softens prices + rents 12–24 months out; constrained supply supports both.
Investment metrics
- 1% rule
- 0.97% ✗
- Cap rate
- 6.99%
- Cash-on-cash
- 2.49%
- DSCR
- 1.11
- GRM
- 8.6
CMA / ARV
- ARV (median comp)
- $216,304
- List price
- $175,000
- Delta
- -19.10%
- Verdict
- UNDERPRICED
- Comps
- 20 within 1.0 mi
Show comp detail 4 sales within ~0.75 mi
| Address | Dist | Beds/Ba | Sqft | Sold | Price | $/sf | Match |
|---|---|---|---|---|---|---|---|
| 108 Boca Vista Ct | 0.34mi | 2/1.0 (-1) | 1,200 (-3%) | 7mo | $264,900 | $221 | 64 |
| 204 Pine St | 0.29mi | 3/1.0 | 1,058 (-14%) | 9mo | $175,000 | $165 | 51 |
| 304 W Kentucky St | 0.43mi | 3/1.0 | 1,080 (-13%) | 7mo | $29,500 | $27 | 49 |
| 107 E Maginnis St | 0.52mi | 2/2.0 (-1) | 1,416 (+15%) | 19mo | $215,000 | $152 | 30 |
Match score weights: distance 35% · size 25% · config 20% · recency 20%. Top-matched comps best support the ARV.
Projected returns pro-forma
-3.0% appreciation · 3.0% rent growth · sell at horizon
- IRR
- -12.3%
- Equity multiple
- 0.55×
- Total profit
- $-21,840
- Equity at exit
- $26,093
- IRR
- -3.2%
- Equity multiple
- 0.79×
- Total profit
- $-10,504
- Equity at exit
- $15,131
Cash invested: $49,000 (down + closing). Projections, not guarantees.
Landlord ↔ Tenant lean methodology
- Overall (STATE)
- 87 Strongly Landlord-Friendly
- State Texas
- 87 Strongly Landlord-Friendly · R+5
- County
- — inherits STATE
- City
- — inherits STATE
ZIP-level market 76431
- Home prices YoY
- -13.1%
- Active inventory
- 136
- Price-to-rent
- 8.6×
Monthly cashflow live
- Estimated rent
- $1,697 medium interval (Pro) →
- Mortgage (P&I)
- −$918
- Tax from tax record
- −$248 /mo · $2,977/yr
- Insurance
- −$73
- HOA
- −$0
- Vacancy / Maint / Mgmt
- −$356
- Net cashflow
- $102
Break-even live
Sensitivity live
| Price | -10% $201 | -5% $151 | +0% $102 | +5% $52 | +10% $3 |
|---|---|---|---|---|---|
| Rent | -10% $-32 | -5% $35 | +0% $102 | +5% $169 | +10% $236 |
| Rate | -1.0pp $190 | -0.5pp $146 | base $102 | +0.5pp $56 | +1.0pp $10 |
UW: 25.0% down · 7.5% · 30yr · 1.5% tax · 5.0% vac · 8.0% maint · 8.0% mgmt
Financing live
Cash to close
- Down payment
- $43,750
- Closing costs
- $5,250
- Reserves months
- —
- Total cash needed
- —
Loan-product check · same deal, 3 products live
Conventional
25% down · 7.5% · 30yr
- Down + closing
- —
- Monthly P&I
- —
- Monthly cashflow
- —
- DSCR
- —
- Eligible?
- —
Personal DTI + credit; lowest rate.
DSCR
20% down · 8.5% · 30yr
- Down + closing
- —
- Monthly P&I
- —
- Monthly cashflow
- —
- DSCR
- —
- Eligible?
- —
No personal income docs; deal must DSCR.
Hard money
10% down · 12.0% · 12mo
- Down + closing
- —
- Monthly P&I
- —
- Monthly cashflow
- —
- DSCR
- —
- Eligible?
- —
Short-term bridge; refi at stabilization.
Listing history 33 events
-
2026-06-21days on market $175,000 Active 101 DOM
-
2026-06-18days on market $175,000 Active 98 DOM
-
2026-06-17days on market $175,000 Active 97 DOM
-
2026-06-16days on market $175,000 Active 96 DOM
-
2026-06-15days on market $175,000 Active 95 DOM
-
2026-06-13days on market $175,000 Active 93 DOM
-
2026-06-13days on market $175,000 Active 92 DOM
-
2026-06-09days on market $175,000 Active 89 DOM
-
2026-06-08days on market $175,000 Active 88 DOM
-
2026-06-07days on market $175,000 Active 87 DOM
-
2026-06-04days on market $175,000 Active 84 DOM
-
2026-06-03days on market $175,000 Active 83 DOM
-
2026-06-02days on market $175,000 Active 82 DOM
-
2026-06-01days on market $175,000 Active 81 DOM
-
2026-05-31days on market $175,000 Active 80 DOM
-
2026-04-19price $175,000 919-char remark
Show marketing remark (919 chars)
Great turn-key investment opportunity offering instant cash flow at a great value. Current tenant lease until January 31, 2027, with the option to renew. Inside this updated home, you'll find an open floor plan with durable ceramic tile flooring throughout, making the home both functional and easy to maintain. The large backyard provides plenty of space for outdoor activities, pets, or future customization. Major updates provide peace of mind, including a new HVAC system installed in 2023, a new roof in 2025, a new water heater in 2022, a new garage door in 2025, and updated bathrooms. Whether you're an investor looking for steady income or a buyer planning for a future home near Lake Bridgeport, this property offers flexibility and value for quiet country living. Chico offers quaint boutique shopping and dining, yet it is only 15-20 minutes from Bridgeport and Decatur for more options. There is no survey.
-
2026-03-12$200,000 Active 919-char remark
Show marketing remark (919 chars)
Great turn-key investment opportunity offering instant cash flow at a great value. Current tenant lease until January 31, 2027, with the option to renew. Inside this updated home, you'll find an open floor plan with durable ceramic tile flooring throughout, making the home both functional and easy to maintain. The large backyard provides plenty of space for outdoor activities, pets, or future customization. Major updates provide peace of mind, including a new HVAC system installed in 2023, a new roof in 2025, a new water heater in 2022, a new garage door in 2025, and updated bathrooms. Whether you're an investor looking for steady income or a buyer planning for a future home near Lake Bridgeport, this property offers flexibility and value for quiet country living. Chico offers quaint boutique shopping and dining, yet it is only 15-20 minutes from Bridgeport and Decatur for more options. There is no survey.
-
2026-01-23historical $1,600
-
2025-12-28$1,600
-
2025-12-22historical $1,600
-
2025-11-21$1,600
-
2025-11-12historical $1,650
-
2025-10-01price $1,650
-
2025-09-14price $1,750
-
2025-09-10$1,600
-
2023-12-15historical $1,600
-
2023-11-11$1,600
-
2023-07-30historical $1,600
-
2023-07-24price $1,600
-
2019-02-26soldstatus
-
2001-03-21soldstatus
-
1999-05-11soldstatus
-
1993-06-01soldstatus
ⓘ Source: listings_history table (triggers on properties + properties_extension) + one-shot
backfill from property_details.listing_events for pre-trigger history.
Tax reassessment forecast TX · Resets to sale price
- Current annual tax
- $2,977 · $248/mo
- Projected year-2 tax
- $3,202 · $267/mo
- Expected delta
- +$226/yr (+$19/mo · 7.6%)
ⓘ Screening estimate from a state-policy table — verify with the county assessor before closing.
Climate risk First Street
- Flood 1/10 Low FEMA zone X (unshaded) · 0% chance over 30 yrs
- Wildfire 6/10 Major
- Heat 6/10 Major 7 d/yr ≥110°F today · 21 d/yr by 30 yrs out
- Wind 4/10 Moderate 17% chance of damaging wind over 30 yrs
- Air quality 2/10 Low 1 unhealthy d/yr today · 2 by 30 yrs out
Nearby sold comps map
Loading sold comps map…
Walkable amenities ~0.75 mi
Loading nearby amenities…
Taxation est. · year 1
- Rental income
- $20,359
- − Mortgage interest
- −$9,803
- − Property taxes
- −$2,977
- − Insurance
- −$875
- − Repairs & maintenance
- −$1,629
- − Management
- −$1,629
- − Depreciation
- −$5,091
- Taxable loss
- −$1,643
- Est. tax savings @ 24.0%
- +$394
- After-tax cash flow
- $1,614/yr
For passive investors: Depreciation is non-cash, so a rental often shows a tax loss while cash-flowing — sheltering income. Rental losses are passive: they offset passive income freely, and up to $25,000/yr can offset ordinary (W-2) income if you actively participate and your MAGI is under $100k (phasing out to $0 by $150k); unused losses carry forward. On sale, claimed depreciation is recaptured at up to 25%, and gains may owe capital-gains tax (a 1031 exchange can defer both). Figures are a year-1 estimate at your 24.0% rate — not tax advice; consult a CPA.
Schools (NCES district)
- District
- Chico ISD
- NCES district ID
- 4813800
- Math proficiency
- 38% ▼ -19.00%
- Reading proficiency
- 41% ▼ -9.00%
- Median HH income
- $48,546
- Composite
- 33.94/100
- National rank
- #5335
- State rank
- #424 of 826 in TX
Livability — Chico
- Score
- 68/100
- State rank
- #508
- US rank
- #10078
Category grades
Schools grade is shown separately in the Schools card above.
Census & demographics
- Census place
- Chico, TX
- Population (ZIP)
- 4,480
Population outlook (Wise County) Hauer SSP2
- Today (2025)
- 71,620 people
- By 2030
- 75,858 · +5.9%
- By 2040
- 83,908 · +17.2%
- By 2050
- 90,717 · +26.7%
- By 2075
- 107,583 · +50.2%
- By 2100
- 114,996 · +60.6%
Race, ethnicity, and origin ACS 2023
- Neighborhood character
- Predominantly White (82%)
- Race & ethnicity
- White 82% Hispanic / Latino 15% Asian 2% Two or more races 2%
- Hispanic origin (detail)
- Mexican 14%
- Common ancestry
- Slovak 4% Italian 1% Lithuanian 1%
- Foreign-born
- 9% · Canada
- Languages at home
- 87% English-only · Spanish 10% Other Indo-European 2%
Political lean MEDSL · Wise
- 2024 margin
- Solid R (+70.0) · D 14.7% · R 84.7%
- 2008→2024 swing
- -14.3pp toward R · 2008: -55.7pp · 2024: -70.0pp
- All cycles
- 2024: R+70.0 2020: R+68.2 2016: R+69.9 2012: R+67.5 2008: R+55.7
Not yet ingested
- Civics
- —
Market trends
- HPI YoY
- ▼ -33.62%
- Current HPI
- 222.5575
- Rent YoY
- —
- Metro
- —
- State GDP YoY
- ▲ 3.95%
- F500 in state
- 110
Industry mix (Fortune 500 HQ in TX)
| Industry | F500 HQs | Revenue |
|---|---|---|
| Energy | 16 | $1,198B |
|
||
| Technology | 5 | $198B |
|
||
| Engineering / Construction | 4 | $72B |
|
||
| Energy Services | 3 | $60B |
|
||
| Utilities | 3 | $41B |
|
||
| Healthcare | 2 | $330B |
|
||
Price history
+10837.5% since first listed18 events — show timeline
- 2026-04-19 Price Changed $175,000 NTREIS
- 2026-03-12 Listed $200,000 NTREIS
- 2026-01-23 Rental Removed $1,600 TURBOTENANT
- 2025-12-28 Listed for Rent $1,600 TURBOTENANT
- 2025-12-22 Rental Removed $1,600 TURBOTENANT
- 2025-11-21 Listed for Rent $1,600 TURBOTENANT
- 2025-11-12 Rental Removed $1,650 TURBOTENANT
- 2025-10-01 Price Changed $1,650 TURBOTENANT
- 2025-09-14 Price Changed $1,750 TURBOTENANT
- 2025-09-10 Listed for Rent $1,600 TURBOTENANT
- 2023-12-15 Rental Removed $1,600 TURBOTENANT
- 2023-11-11 Listed for Rent $1,600 TURBOTENANT
- 2023-07-30 Rental Removed $1,600 TURBOTENANT
- 2023-07-24 Price Changed $1,600 TURBOTENANT
- 2019-02-26 Sold (Public Records) — Public Records
- 2001-03-21 Sold (Public Records) — Public Records
- 1999-05-11 Sold (Public Records) — Public Records
- 1993-06-01 Sold (Public Records) — Public Records
Property tax history
+3.0%/yrLatest (2025): $2,977 · -0.9% YoY. Source: county tax records.
Cash-flow waterfall
monthlySold comps — $/sqft
last 12 mo · ≤1 miLoading sold comps…