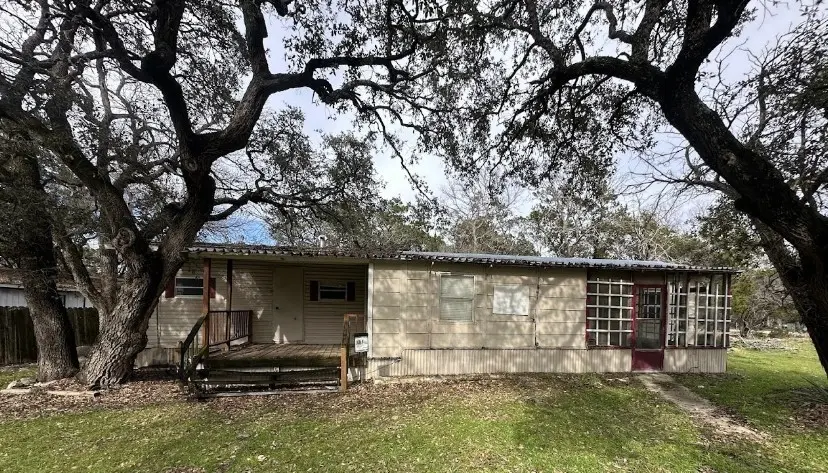
3 Quail Loop · Morgan's Point Resort, TX
Flood risk 1/10 · Minimal
- FEMA flood zone
- X (unshaded)
- Chance of flooding over 30 yrs
- 0.0%
- Est. flood insurance / yr
- $507 – $1,088
Fire risk 4/10 · Minor
- Est. fire insurance / yr
- $1,222 – $2,270
Heat risk 7/10 · Major
- Hot days now (above 107°F)
- 7 days/yr
- Hot days in 30 yrs
- 21 days/yr
Wind risk 6/10 · Moderate
- Chance of severe wind over 30 yrs
- 62.0%
Air-quality risk 2/10 · Minimal
- Unhealthy air days now
- 0 days/yr
- Unhealthy air days in 30 yrs
- 1 days/yr
Risk factors via First Street. Map © Google.
Why this score? — see what drove the B- grade
The composite is a weighted blend of 9 inputs, each scored 0–100. Each bar is that input's sub-score; the figure is the points it added to the 100-point composite (weight × sub-score).
- Cash flow +30.0/30.0
- 1% rule +10.0/10.0
- DSCR +10.0/10.0
- ARV discount +7.5/15.0
- Schools +3.8/10.0
- Rent growth +2.8/5.0
- Livability +2.5/5.0
- Condition / age +2.5/5.0
- Appreciation +0.0/10.0
$77,599
🖨 Deal sheet 📄 Offer letter ✓ Due diligence
Listing remarks MLS
NEAR LAKE BELTON! This home is available in the in the Belton, Texas area. This property is part of the Morgans Point Resort community. This location is down the road from Belton Lake where you will also have nearby access to a long list of outdoor recreational areas such as local parks, wilderness areas, and RV stations. Here you will also have direct access to I-35. It is being sold AS IS and needs some repair but has a lot of potential. WE MAKE IT EASY TO OWN. This is a great opportunity! Don't wait, call us today to get more information on the owner's easy terms and smooth process that may be able to put the deed in your name and make this your dream home.
Key facts
- Near lake belton
- 6,982 sq ft lot
- Built 1960
Tags
Neighborhood map
What this means for you Summary
Snapshot
- This is a 3-bed/1.0-bath manufactured listed at $78k.
Deal economics
- At list price, monthly cash flow is $746 ($9k/yr) — positive.
- The deal already cash-flows at list — no discount required.
- Meets the 1% rule at list price ($2k rent vs $78k).
- Recommended offer: $68k (12.0% below list) — sets the bar for market timing.
- Cap rate 17.8% vs local median 2.5% in Morgan's Point Resort — top-decile yield for the area; either an underpriced asset or a hidden risk that comps aren't pricing in. Stress-test before assuming the spread holds.
Location & tenants
- Location reads: area grade B — affects rentability + tenant quality, not the cash-flow math above.
- Belton ISD (suburban): math 39% / reading 46% proficiency, ranked #285 of 826 in TX (top 34%) — families likely to look elsewhere, expect single-tenant / working-renter base with shorter leases.
- Market conditions: Rents rising (+1.3%/yr); 745 active listings in the ZIP; solid renter incomes; 3,222 units permitted in Bell County in 2024 (246 in 5+ unit buildings).
Forward outlook
- Local home prices are declining (-3.0%/yr); year-one equity from $536 of loan paydown is wiped out by about $2k of value loss. Plan a longer hold.
- Bell County population projected at +21% by 2050 — long-run rental-demand tailwind backs the buy-and-hold thesis.
- At projected returns (-3.0% appreciation + 1.3% rent growth), your $22k cash investment doubles in ~3 years — after that, you're playing with house money.
Negotiation context
- It's been on market 428 days — a 12% lower offer ($68k) is reasonable based on typical stale-listing flexibility.
- Current owner paid $6k; list at $78k implies a 1172% gain — meaningful room to come down on a strong offer.
Risks & watch-outs
- Climate carrying-cost: major wind risk, 62% chance of damaging wind over 30y; extreme-heat days projected 7→21/yr by 2055 (HVAC capex compounding) — expect insurance premiums to compound above CPI over the hold.
Questions for the listing agent
- It's been on market 428 days. Have you received any prior offers? Is the seller open to a 12% concession, seller financing, or rate buy-down credit?
- Built in 1960 — when were the roof, HVAC, electrical panel, plumbing, and water heater last replaced?
- Why hasn't it sold? Are there any deal-killer items the seller is aware of (foundation, flood, title, zoning, code violations)?
- Is there a deadline driving the sale (1031 exchange, divorce, estate, relocation)? That informs how much negotiation room exists.
- What's the average days-on-market for RENTAL listings here right now (not sales)? A rising rental-DOM trend means longer vacancies and softer asking-rent achievability than the comps imply.
- What's the recent tenant-quality profile in this submarket — average credit score on applications, eviction rate, late-payment / NSF rate, and stable-employment percentage? A property-management company in the area should have these aggregated.
- How much new for-sale + rental construction is in the pipeline within 1–3 miles? Heavy new supply typically softens prices + rents 12–24 months out; constrained supply supports both.
Investment metrics
- 1% rule
- 1.99% ✓
- Cap rate
- 17.83%
- Cash-on-cash
- 41.21%
- DSCR
- 2.83
- GRM
- 4.2
CMA / ARV
- ARV (median comp)
- $244,467
- List price
- $77,599
- Delta
- -68.26%
- Verdict
- UNDERPRICED
- Comps
- 9 within 1.0 mi
Projected returns pro-forma
-3.0% appreciation · 1.29% rent growth · sell at horizon
- IRR
- 35.9%
- Equity multiple
- 2.49×
- Total profit
- $32,313
- Equity at exit
- $11,570
- IRR
- 41.7%
- Equity multiple
- 4.63×
- Total profit
- $78,891
- Equity at exit
- $6,709
Cash invested: $21,728 (down + closing). Projections, not guarantees.
Landlord ↔ Tenant lean methodology
- Overall (STATE)
- 87 Strongly Landlord-Friendly
- State Texas
- 87 Strongly Landlord-Friendly · R+5
- County
- — inherits STATE
- City
- — inherits STATE
ZIP-level market 76513
- Rents YoY
- 1.3%
- Active inventory
- 745
- Price-to-rent
- 4.2×
Monthly cashflow live
- Estimated rent
- $1,548 medium interval (Pro) →
- Mortgage (P&I)
- −$407
- Tax from tax record
- −$37 /mo · $446/yr
- Insurance
- −$32
- HOA
- −$0
- Vacancy / Maint / Mgmt
- −$325
- Net cashflow
- $746
Break-even live
UW: 25.0% down · 7.5% · 30yr · 1.5% tax · 5.0% vac · 8.0% maint · 8.0% mgmt
Financing live
Cash to close
- Down payment
- $19,400
- Closing costs
- $2,328
- Reserves months
- —
- Total cash needed
- —
Loan-product check · same deal, 3 products live
Conventional
25% down · 7.5% · 30yr
- Down + closing
- —
- Monthly P&I
- —
- Monthly cashflow
- —
- DSCR
- —
- Eligible?
- —
Personal DTI + credit; lowest rate.
DSCR
20% down · 8.5% · 30yr
- Down + closing
- —
- Monthly P&I
- —
- Monthly cashflow
- —
- DSCR
- —
- Eligible?
- —
No personal income docs; deal must DSCR.
Hard money
10% down · 12.0% · 12mo
- Down + closing
- —
- Monthly P&I
- —
- Monthly cashflow
- —
- DSCR
- —
- Eligible?
- —
Short-term bridge; refi at stabilization.
Listing history 19 events
-
2026-06-18days on market $77,599 Active 428 DOM
-
2026-06-17days on market $77,599 Active 427 DOM
-
2026-06-16days on market $77,599 Active 426 DOM
-
2026-06-15days on market $77,599 Active 425 DOM
-
2026-06-14days on market $77,599 Active 423 DOM
-
2026-06-13days on market $77,599 Active 422 DOM
-
2026-06-09days on market $77,599 Active 419 DOM
-
2026-06-08days on market $77,599 Active 418 DOM
-
2026-06-07days on market $77,599 Active 417 DOM
-
2026-06-05days on market $77,599 Active 414 DOM
-
2026-06-03days on market $77,599 Active 413 DOM
-
2026-06-02days on market $77,599 Active 412 DOM
-
2026-06-01days on market $77,599 Active 411 DOM
-
2026-05-31days on market $77,599 Active 410 DOM
-
2026-05-30days on market $77,599 Active 409 DOM
-
2025-04-16$77,599 Active 668-char remark
Show marketing remark (668 chars)
NEAR LAKE BELTON! This home is available in the in the Belton, Texas area. This property is part of the Morgans Point Resort community. This location is down the road from Belton Lake where you will also have nearby access to a long list of outdoor recreational areas such as local parks, wilderness areas, and RV stations. Here you will also have direct access to I-35. It is being sold AS IS and needs some repair but has a lot of potential. WE MAKE IT EASY TO OWN. This is a great opportunity! Don't wait, call us today to get more information on the owner's easy terms and smooth process that may be able to put the deed in your name and make this your dream home.
-
2008-02-20soldstatus $6,100
-
2006-03-01soldstatus
-
1995-06-29soldstatus
ⓘ Source: listings_history table (triggers on properties + properties_extension) + one-shot
backfill from property_details.listing_events for pre-trigger history.
Tax reassessment forecast TX · Resets to sale price
- Current annual tax
- $446 · $37/mo
- Projected year-2 tax
- $1,420 · $118/mo
- Expected delta
- +$974/yr (+$81/mo · 218.3%)
ⓘ Screening estimate from a state-policy table — verify with the county assessor before closing.
Climate risk First Street
- Flood 1/10 Low FEMA zone X (unshaded) · 0% chance over 30 yrs
- Wildfire 4/10 Moderate
- Heat 7/10 Severe 7 d/yr ≥107°F today · 21 d/yr by 30 yrs out
- Wind 6/10 Major 62% chance of damaging wind over 30 yrs
- Air quality 2/10 Low 0 unhealthy d/yr today · 1 by 30 yrs out
Nearby sold comps map
Loading sold comps map…
Walkable amenities ~0.75 mi
Loading nearby amenities…
Taxation est. · year 1
- Rental income
- $18,570
- − Mortgage interest
- −$4,347
- − Property taxes
- −$446
- − Insurance
- −$388
- − Repairs & maintenance
- −$1,486
- − Management
- −$1,486
- − Depreciation
- −$2,257
- Taxable income
- $8,161
- Est. tax owed @ 24.0%
- −$1,959
- After-tax cash flow
- $6,995/yr
For passive investors: Depreciation is non-cash, so a rental often shows a tax loss while cash-flowing — sheltering income. Rental losses are passive: they offset passive income freely, and up to $25,000/yr can offset ordinary (W-2) income if you actively participate and your MAGI is under $100k (phasing out to $0 by $150k); unused losses carry forward. On sale, claimed depreciation is recaptured at up to 25%, and gains may owe capital-gains tax (a 1031 exchange can defer both). Figures are a year-1 estimate at your 24.0% rate — not tax advice; consult a CPA.
Schools (NCES district)
- District
- Belton ISD
- NCES district ID
- 4809860
- Math proficiency
- 39% ▼ -14.00%
- Reading proficiency
- 46% ▼ -4.00%
- Median HH income
- $61,239
- Composite
- 37.62/100
- National rank
- #4378
- State rank
- #285 of 826 in TX
Livability — Morgan's Point Resort
No livability data for this city. (Only ~50 U.S. cities are tracked.)
Census & demographics
- Census place
- Morgan's Point Resort, TX
- County
- Bell County · 345,090 people
- Metro
- Killeen-Temple, TX
- Population (ZIP)
- 45,928
- Household income
- $80,661
- Rent vs Own
- Severe rent burden
- 1198.0
Population outlook (Bell County) Hauer SSP2
- Today (2025)
- 371,114 people
- By 2030
- 389,104 · +4.8%
- By 2040
- 420,592 · +13.3%
- By 2050
- 447,779 · +20.7%
- By 2075
- 499,130 · +34.5%
- By 2100
- 505,680 · +36.3%
Race, ethnicity, and origin ACS 2023
- Neighborhood character
- Majority White (62%)
- Race & ethnicity
- White 62% Hispanic / Latino 24% Two or more races 14% Black 6% Asian 2%
- Hispanic origin (detail)
- Mexican 19% Puerto Rican 1%
- Common ancestry
- Italian 3% Slovak 2% Lithuanian 2%
- Foreign-born
- 9% · Canada, Vietnam
- Languages at home
- 83% English-only · Spanish 13% Korean 1% Other Indo-European 1%
Political lean MEDSL · Bell
- 2024 margin
- R (+16.2) · D 41.3% · R 57.6% · Other 1.1%
- 2008→2024 swing
- -6.5pp toward R · 2008: -9.8pp · 2024: -16.2pp
- All cycles
- 2024: R+16.2 2020: R+8.5 2016: R+15.1 2012: R+16.4 2008: R+9.8
Not yet ingested
- Civics
- —
Market trends
- HPI YoY
- ▼ -105.10%
- Current HPI
- 183.6715
- Rent YoY
- ▲ 1.29%
- Metro
- Killeen-Temple, TX
- State GDP YoY
- ▲ 3.95%
- F500 in state
- 110
Industry mix (Fortune 500 HQ in TX)
| Industry | F500 HQs | Revenue |
|---|---|---|
| Energy | 16 | $1,198B |
|
||
| Technology | 5 | $198B |
|
||
| Engineering / Construction | 4 | $72B |
|
||
| Energy Services | 3 | $60B |
|
||
| Utilities | 3 | $41B |
|
||
| Healthcare | 2 | $330B |
|
||
Price history
+1172.1% since first listed4 events — show timeline
- 2025-04-16 Listed $77,599 HARMLS
- 2008-02-20 Sold (Public Records) $6,100 Public Records
- 2006-03-01 Sold (Public Records) — Public Records
- 1995-06-29 Sold (Public Records) — Public Records
Property tax history
+4.0%/yrLatest (2025): $446 · -2.0% YoY. Source: county tax records.
Cash-flow waterfall
monthlySold comps — $/sqft
last 12 mo · ≤1 miLoading sold comps…