 🌊 Lakefront
1660 Davidson Rd · Clewiston, FL
Flood risk 1/10 · Minimal
- FEMA flood zone
- X (shaded)
- Chance of flooding over 30 yrs
- 0.0%
- Est. flood insurance / yr
- $507 – $1,088
Fire risk 2/10 · Minimal
- Est. fire insurance / yr
- $947 – $1,759
Heat risk 9/10 · Severe
- Hot days now (above 108°F)
- 7 days/yr
- Hot days in 30 yrs
- 25 days/yr
Wind risk 10/10 · Severe
- Chance of severe wind over 30 yrs
- 99.0%
Air-quality risk 2/10 · Minimal
- Unhealthy air days now
- 1 days/yr
- Unhealthy air days in 30 yrs
- 1 days/yr
Risk factors via First Street. Map © Google.
Why this score? — see what drove the B- grade
The composite is a weighted blend of 9 inputs, each scored 0–100. Each bar is that input's sub-score; the figure is the points it added to the 100-point composite (weight × sub-score).
- Cash flow +27.8/30.0
- DSCR +9.8/10.0
- 1% rule +7.8/10.0
- ARV discount +7.5/15.0
- Livability +3.5/5.0
- Schools +3.1/10.0
- Rent growth +2.5/5.0
- Condition / age +2.5/5.0
- Appreciation +0.5/10.0
$145,000
🖨 Deal sheet (PDF) 📄 Offer letter ✓ Due diligence
Listing remarks
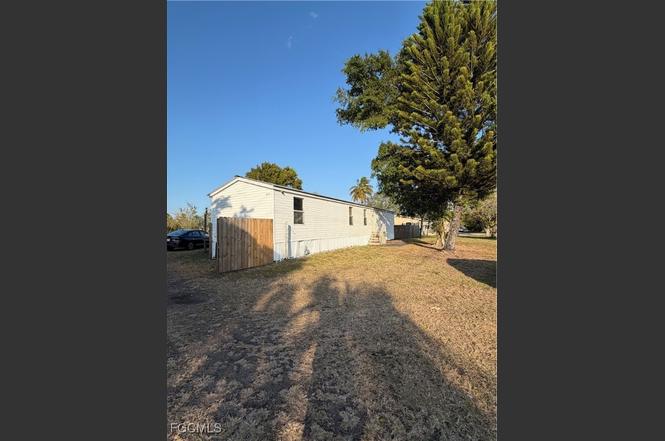
This is a great opportunity to own your own property just outside city limits. This 3/1 single-wide, converted to a 2/1, sits on nearly an acre of land with a body of water in the backyard with potential for a boat dock—a rare find at this price point. Located in the county, you’ll enjoy lower taxes and utility costs compared to city living. The property offers ample parking in both the front and rear, fencing already in place, and plenty of room to make it your own. The home needs a little TLC, but for the right buyer, it’s full of potential. Features include a metal roof, updated electrical panel, septic system, city water available, and furnishings included, along with
Key facts
- Metal roof
- Boat dock
- Ample parking
Tags
Property features AI
Finance
- Financial info: Pets allowed
- HOA & community: Non-gated community; No association fee
Exterior
- Parking: Driveway; Unpaved parking
- Utilities: Cable available; High-speed internet available; Septic tank; Water assessment paid
- Home design: Manufactured home; Single-story; Entry level 1; Faces south; Resale property
- Construction: Aluminum siding; Metal roof
- Exterior features: Deck; Open porch; Fence; Fruit trees; Outbuilding; Pond on lot; North exposure; Has view
Interior
- Kitchen: Electric cooktop; Freezer; Refrigerator
- Flooring: Carpet; Laminate
- Bathrooms: 1 full bathroom
- Heating & cooling: Central electric heating; Central electric cooling
- Interior features: Built-in features; Living/dining room; Tub/shower; Split bedroom floor plan; Single-hung windows; Partially furnished
- Laundry & utility: Washer hookup inside; Dryer hookup inside
Neighborhood map
What this means for you Summary
Snapshot
- This is a 3-bed/1.0-bath manufactured listed at $145k.
Deal economics
- At list price, monthly cash flow is $444 ($5k/yr) — positive.
- The deal already cash-flows at list — no discount required.
- Meets the 1% rule at list price ($2k rent vs $145k).
- Recommended offer: $128k (12.0% below list) — sets the bar for market timing.
- Cap rate 10.0% vs local median 5.0% in Clewiston — top-decile yield for the area; either an underpriced asset or a hidden risk that comps aren't pricing in. Stress-test before assuming the spread holds.
Location & tenants
- Location reads 70/100 on livability (#436 in FL) — a middle-class / working-renter tenant base. Strengths: crime A+, cost of living A+, health & safety A+; Watch: employment D, amenities F, commute F.
- Hendry (town): math 35% / reading 40% proficiency, ranked #65 of 73 in FL (top 89%) — families likely to look elsewhere, expect single-tenant / working-renter base with shorter leases; 75% free/reduced lunch — lower-income household profile, screen leases tightly.
- Zoned schools: Central Elementary School (math 56% / reading 44%, grade D+, #1,070 of 2,144 statewide, top 51%, 588 students, 76% FRL); Clewiston Middle School (math 50% / reading 41%, grade D+, #305 of 571 statewide, top 54%, 741 students, 78% FRL); Clewiston High School (math 22% / reading 39%, grade F, #434 of 667 statewide, top 66%, 958 students, 70% FRL) — zoned schools at 74% FRL track the district average.
- Market conditions: 405 active listings in the ZIP; 557 units permitted in Hendry County in 2024 (45 in 5+ unit buildings).
Forward outlook
- Local home prices are declining (-3.0%/yr); year-one equity from $1k of loan paydown is wiped out by about $4k of value loss. Plan a longer hold.
- Hendry County population projected to shrink 7% by 2050 — rents likely to lag national; underwrite the cash flow, not the appreciation.
- At projected returns (-3.0% appreciation + 3.0% rent growth), your $41k cash investment doubles in ~9 years — after that, you're playing with house money.
Negotiation context
- It's been on market 144 days — a 12% lower offer ($128k) is reasonable based on typical stale-listing flexibility.
- Current owner paid $30k; list at $145k implies a 383% gain — meaningful room to come down on a strong offer.
Risks & watch-outs
- Climate carrying-cost: severe wind risk, 99% chance of damaging wind over 30y; extreme-heat days projected 7→25/yr by 2055 (HVAC capex compounding) — expect insurance premiums to compound above CPI over the hold.
Questions for the listing agent
- It's been on market 144 days. Have you received any prior offers? Is the seller open to a 12% concession, seller financing, or rate buy-down credit?
- Why hasn't it sold? Are there any deal-killer items the seller is aware of (foundation, flood, title, zoning, code violations)?
- Is there a deadline driving the sale (1031 exchange, divorce, estate, relocation)? That informs how much negotiation room exists.
- Schools are D-rated, which usually means shorter tenancies and higher turnover. Who's the typical renter profile here, and what's been the actual vacancy rate?
- This sits on a lake — are riparian / water-frontage rights deeded with the parcel? Any dock permits, shoreline easements, or HOA water-use restrictions?
- What's the documented flood / surge / shoreline-erosion history here (FEMA AND non-FEMA — e.g., storm surge, creek backup, septic-field saturation)?
- Any water-quality or seasonal algae-bloom issues that affect tenant satisfaction or short-term-rental demand?
- What's the average days-on-market for RENTAL listings here right now (not sales)? A rising rental-DOM trend means longer vacancies and softer asking-rent achievability than the comps imply.
- What's the recent tenant-quality profile in this submarket — average credit score on applications, eviction rate, late-payment / NSF rate, and stable-employment percentage? A property-management company in the area should have these aggregated.
- How much new for-sale + rental construction is in the pipeline within 1–3 miles? Heavy new supply typically softens prices + rents 12–24 months out; constrained supply supports both.
Investment metrics
- 1% rule
- 1.28% ✓
- Cap rate
- 9.97%
- Cash-on-cash
- 13.13%
- DSCR
- 1.58
- GRM
- 6.5
CMA / ARV
- ARV (on-the-fly)
- $308,259
- Comps found
- 4
Show comp detail 4 sales within ~0.75 mi
| Address | Dist | Beds/Ba | Sqft | Sold | Price | $/sf | Match |
|---|---|---|---|---|---|---|---|
| 780 Tammy Rd | 0.23mi | 3/2.0 | 960 (-2%) | 18mo | $224,000 | $233 | 67 |
| 734 Midstate Loop | 0.50mi | 3/2.0 | 960 (-2%) | 5mo | $195,000 | $203 | 65 |
| 1341 Sherwood Ave | 0.38mi | 3/2.0 | 924 (-6%) | 12mo | $250,000 | $271 | 59 |
| 710 Cypress Cir | 0.64mi | 3/1.0 | 910 (-7%) | 13mo | $53,000 | $58 | 48 |
Match score weights: distance 35% · size 25% · config 20% · recency 20%. Top-matched comps best support the ARV.
Projected returns pro-forma
-3.0% appreciation · 3.0% rent growth · sell at horizon
- IRR
- 3.1%
- Equity multiple
- 1.12×
- Total profit
- $4,833
- Equity at exit
- $21,620
- IRR
- 12.7%
- Equity multiple
- 2.00×
- Total profit
- $40,796
- Equity at exit
- $12,537
Cash invested: $40,600 (down + closing). Projections, not guarantees.
Landlord ↔ Tenant lean methodology
- Overall (STATE)
- 87 Strongly Landlord-Friendly
- State Florida
- 87 Strongly Landlord-Friendly · R+3
- County
- — inherits STATE
- City
- — inherits STATE
ZIP-level market 33440
- Home prices YoY
- -2.1%
- Active inventory
- 405
- Price-to-rent
- 6.5×
Monthly cashflow live
- Estimated rent
- $1,854 medium interval (Pro) →
- Mortgage (P&I)
- −$760
- Tax from tax record
- −$200 /mo · $2,396/yr
- Insurance
- −$60
- HOA
- −$0
- Vacancy / Maint / Mgmt
- −$389
- Net cashflow
- $444
Break-even live
Sensitivity live
| Price | -10% $526 | -5% $485 | +0% $444 | +5% $403 | +10% $362 |
|---|---|---|---|---|---|
| Rent | -10% $298 | -5% $371 | +0% $444 | +5% $517 | +10% $591 |
| Rate | -1.0pp $517 | -0.5pp $481 | base $444 | +0.5pp $407 | +1.0pp $368 |
UW: 25.0% down · 7.5% · 30yr · 1.5% tax · 5.0% vac · 8.0% maint · 8.0% mgmt
Financing live
Cash to close
- Down payment
- $36,250
- Closing costs
- $4,350
- Reserves months
- —
- Total cash needed
- —
Loan-product check · same deal, 3 products live
Conventional
25% down · 7.5% · 30yr
- Down + closing
- —
- Monthly P&I
- —
- Monthly cashflow
- —
- DSCR
- —
- Eligible?
- —
Personal DTI + credit; lowest rate.
DSCR
20% down · 8.5% · 30yr
- Down + closing
- —
- Monthly P&I
- —
- Monthly cashflow
- —
- DSCR
- —
- Eligible?
- —
No personal income docs; deal must DSCR.
Hard money
10% down · 12.0% · 12mo
- Down + closing
- —
- Monthly P&I
- —
- Monthly cashflow
- —
- DSCR
- —
- Eligible?
- —
Short-term bridge; refi at stabilization.
Listing history 22 events
-
2026-06-22days on market $145,000 Active 144 DOM
-
2026-06-18days on market $145,000 Active 141 DOM
-
2026-06-17days on market $145,000 Active 140 DOM
-
2026-06-16days on market $145,000 Active 139 DOM
-
2026-06-15days on market $145,000 Active 138 DOM
-
2026-06-13days on market $145,000 Active 136 DOM
-
2026-06-13days on market $145,000 Active 135 DOM
-
2026-06-10days on market $145,000 Active 133 DOM
-
2026-06-09days on market $145,000 Active 132 DOM
-
2026-06-08days on market $145,000 Active 131 DOM
-
2026-06-07pricedays on market $145,000 Active 130 DOM
-
2026-06-03days on market $155,000 Active 126 DOM
-
2026-06-02days on market $155,000 Active 125 DOM
-
2026-06-01days on market $155,000 Active 124 DOM
-
2026-05-31days on market $155,000 Active 123 DOM
-
2026-04-23price $155,000
-
2026-03-31price $165,000
-
2026-02-01price $175,000
-
2026-01-28$180,000 Active
-
1989-02-01soldstatus $30,000
-
1985-11-01soldstatus $14,500
-
1985-11-01soldstatus $8,400
ⓘ Source: listings_history table (triggers on properties + properties_extension) + one-shot
backfill from property_details.listing_events for pre-trigger history.
Tax reassessment forecast FL · Resets to sale price
- Current annual tax
- $2,396 · $200/mo
- Projected year-2 tax
- $2,396 · $200/mo
- Expected delta
- $0/yr ($0/mo · 0.0%)
ⓘ Screening estimate from a state-policy table — verify with the county assessor before closing.
Climate risk First Street
- Flood 1/10 Low FEMA zone X (shaded) · 0% chance over 30 yrs
- Wildfire 2/10 Low
- Heat 9/10 Extreme 7 d/yr ≥108°F today · 25 d/yr by 30 yrs out
- Wind 10/10 Extreme 99% chance of damaging wind over 30 yrs
- Air quality 2/10 Low 1 unhealthy d/yr today · 1 by 30 yrs out
Nearby sold comps map
Loading sold comps map…
Walkable amenities ~0.75 mi
Loading nearby amenities…
Taxation est. · year 1
- Rental income
- $22,248
- − Mortgage interest
- −$8,122
- − Property taxes
- −$2,396
- − Insurance
- −$725
- − Repairs & maintenance
- −$1,780
- − Management
- −$1,780
- − Depreciation
- −$4,218
- Taxable income
- $3,227
- Est. tax owed @ 24.0%
- −$774
- After-tax cash flow
- $4,556/yr
For passive investors: Depreciation is non-cash, so a rental often shows a tax loss while cash-flowing — sheltering income. Rental losses are passive: they offset passive income freely, and up to $25,000/yr can offset ordinary (W-2) income if you actively participate and your MAGI is under $100k (phasing out to $0 by $150k); unused losses carry forward. On sale, claimed depreciation is recaptured at up to 25%, and gains may owe capital-gains tax (a 1031 exchange can defer both). Figures are a year-1 estimate at your 24.0% rate — not tax advice; consult a CPA.
Schools (NCES district)
- District
- Hendry
- NCES district ID
- 1200780
- Math proficiency
- 35% ▼ -11.00%
- Reading proficiency
- 40% ▼ -4.00%
- Median HH income
- $37,043
- Composite
- 31.16/100
- National rank
- #6054
- State rank
- #65 of 73 in FL
Livability — Clewiston
- Score
- 70/100
- State rank
- #436
- US rank
- #7801
Category grades
Schools grade is shown separately in the Schools card above.
Census & demographics
- Population (ZIP)
- 21,119
Population outlook (Hendry County) Hauer SSP2
- Today (2025)
- 38,866 people
- By 2030
- 38,558 · -0.8%
- By 2040
- 37,743 · -2.9%
- By 2050
- 36,117 · -7.1%
- By 2075
- 30,070 · -22.6%
- By 2100
- 21,966 · -43.5%
Race, ethnicity, and origin ACS 2023
- Neighborhood character
- Diverse neighborhood (Simpson 0.62)
- Race & ethnicity
- Hispanic / Latino 55% Two or more races 26% White 23% Black 18% Native American 3% Asian 2%
- Hispanic origin (detail)
- Mexican 18% Puerto Rican 5% Cuban 18%
- Common ancestry
- Lithuanian 2% Italian 1% Serbian 1%
- Foreign-born
- 30% · Canada, Jamaica, China
- Languages at home
- 48% English-only · Spanish 48% Other Indo-European 1% French/Haitian/Cajun 1%
Political lean MEDSL · Hendry
- 2024 margin
- Solid R (+38.3) · D 30.4% · R 68.7%
- 2008→2024 swing
- -31.1pp toward R · 2008: -7.2pp · 2024: -38.3pp
- All cycles
- 2024: R+38.3 2020: R+23.0 2016: R+14.2 2012: R+5.9 2008: R+7.2
Not yet ingested
- Civics
- —
Market trends
- HPI YoY
- ▼ -9.08%
- Current HPI
- 414.9243
- Rent YoY
- —
- Metro
- —
- State GDP YoY
- ▲ 3.28%
- F500 in state
- 36
Industry mix (Fortune 500 HQ in FL)
| Industry | F500 HQs | Revenue |
|---|---|---|
| Industrial Technology | 2 | $29B |
|
||
| Insurance | 2 | $17B |
|
||
| Retail | 1 | $60B |
|
||
| Technology Distribution | 1 | $58B |
|
||
| Homebuilding | 1 | $35B |
|
||
| Technology Manufacturing | 1 | $35B |
|
||
Price history
+969.0% since first listed7 events — show timeline
- 2026-04-23 Price Changed $155,000 FORTMLS
- 2026-03-31 Price Changed $165,000 FORTMLS
- 2026-02-01 Price Changed $175,000 FORTMLS
- 2026-01-28 Listed $180,000 FORTMLS
- 1989-02-01 Sold (Public Records) $30,000 Public Records
- 1985-11-01 Sold (Public Records) $8,400 Public Records
- 1985-11-01 Sold (Public Records) $14,500 Public Records
Property tax history
+10.8%/yrLatest (2025): $2,396 · +4.1% YoY. Source: county tax records.
Cash-flow waterfall
monthlySold comps — $/sqft
last 12 mo · ≤1 miLoading sold comps…