2084 Mustang Ln · Arcata, CA
Flood risk 7/10 · Major
- FEMA flood zone
- X (shaded)
- Chance of flooding over 30 yrs
- 0.99%
- Est. flood insurance / yr
- $507 – $1,088
Fire risk 3/10 · Minor
- Est. fire insurance / yr
- $659 – $1,223
Heat risk 2/10 · Minimal
- Hot days now (above 72°F)
- 8 days/yr
- Hot days in 30 yrs
- 21 days/yr
Wind risk 1/10 · Minimal
- Chance of severe wind over 30 yrs
- —
Air-quality risk 6/10 · Moderate
- Unhealthy air days now
- 9 days/yr
- Unhealthy air days in 30 yrs
- 9 days/yr
Risk factors via First Street. Map © Google.
Why this score? — see what drove the B grade
The composite is a weighted blend of 9 inputs, each scored 0–100. Each bar is that input's sub-score; the figure is the points it added to the 100-point composite (weight × sub-score).
- Cash flow +30.0/30.0
- DSCR +10.0/10.0
- 1% rule +9.3/10.0
- ARV discount +7.5/15.0
- Rent growth +4.5/5.0
- Schools +4.1/10.0
- Livability +3.4/5.0
- Condition / age +2.5/5.0
- Appreciation +0.0/10.0
$109,901
🖨 Deal sheet 📄 Offer letter ✓ Due diligence
Listing remarks
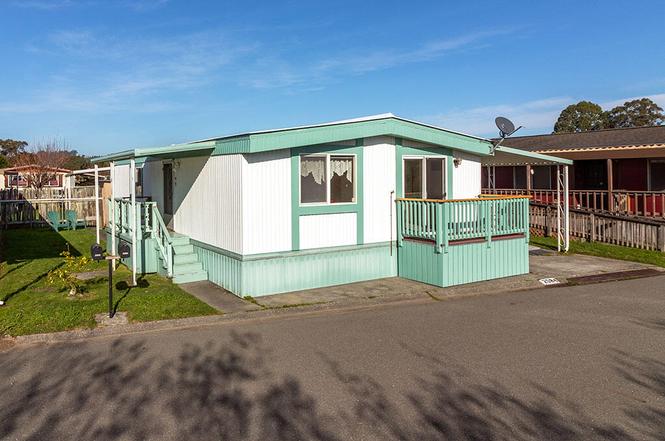
If you are looking to move into Arcata's premier senior mobile home park, here is the opportunity to live on Mustang Ln. The south facing deck, which is across the street from the dog walk/pond, will allow you to relax, have a drink and watch the day unfold. In 2025, Century Mobile Home installed a new silicone roof system. All of the windows have been upgraded to dual double paned, the plumbing supply lines have been redone with PEX and the kitchen has been remodeled with cabinets and counters. See the full slideshow of photos and park rules in the documents tab.
Key facts
- Updated kitchen
- South facing deck
- Garage
Tags
Property features AI
Exterior
- Parking: Paved parking; 1 garage space
- Utilities: Public water; Public sewer; Electricity connected (circuit breakers); Natural gas connected / available
- Home design: Residential single-family home; Single-story (mobile home model: Skyline 2GK 2B); Located in Lazy J Ranch park
- Construction: Aluminum siding; Block foundation; Other roof type; Built as a manufactured/mobile home (Skyline)
- Exterior features: Deck; Partial fencing; Has a view; Level lot; Private maintained road; Concrete and paved road access; Rectangular lot shape
Interior
- Kitchen: Dishwasher; Range; Refrigerator
- Bedrooms: Total of 5 rooms (includes bedrooms and living spaces)
- Flooring: Carpet; Vinyl
- Heating & cooling: Forced air heating; Natural gas heating
- Interior features: Built-in features; Double-pane windows; Accessible entrance; Insulation for energy efficiency; Has heating (Forced air, Natural gas)
- Laundry & utility: Washer hookup; Washer; Dryer
Neighborhood map
What this means for you Summary
Snapshot
- This is a 2-bed/2.0-bath manufactured listed at $110k.
Deal economics
- At list price, monthly cash flow is $514 ($6k/yr) — positive.
- The deal already cash-flows at list — no discount required.
- Meets the 1% rule at list price ($2k rent vs $110k).
- Recommended offer: $97k (12.0% below list) — sets the bar for market timing.
- Cap rate 12.6% vs local median 1.9% in Arcata — top-decile yield for the area; either an underpriced asset or a hidden risk that comps aren't pricing in. Stress-test before assuming the spread holds.
Location & tenants
- Location reads 68/100 on livability (#275 in CA) — a middle-class / working-renter tenant base. Strengths: amenities A+, health & safety A+, schools A-; Watch: housing C-, crime D-, commute F.
- Pacific Union Elementary (town): math 40% / reading 53% proficiency, ranked #560 of 1,400 in CA (top 40%) — families likely to look elsewhere, expect single-tenant / working-renter base with shorter leases.
- Market conditions: Rents rising fast (+8.1%/yr); 82 active listings in the ZIP; 188 units permitted in Humboldt County in 2024 (17 in 5+ unit buildings).
- This rent runs 36% of the median local income ($53k/yr) — at the standard rent-burdened threshold; future hikes will face affordability resistance.
Forward outlook
- Local home prices are declining (-3.0%/yr); year-one equity from $760 of loan paydown is wiped out by about $3k of value loss. Plan a longer hold.
- Humboldt County population projected to shrink 4% by 2050 — rents likely to lag national; underwrite the cash flow, not the appreciation.
- At projected returns (-3.0% appreciation + 8.0% rent growth), your $31k cash investment doubles in ~5 years — after that, you're playing with house money.
Negotiation context
- It's been on market 155 days — a 12% lower offer ($97k) is reasonable based on typical stale-listing flexibility.
Risks & watch-outs
- Watch-outs: flood insurance adds $66/mo.
- Climate carrying-cost: major flood risk — expect insurance premiums to compound above CPI over the hold.
Questions for the listing agent
- It's been on market 155 days. Have you received any prior offers? Is the seller open to a 12% concession, seller financing, or rate buy-down credit?
- Built in 1976 — when were the roof, HVAC, electrical panel, plumbing, and water heater last replaced?
- What's the actual annual flood-insurance premium (NFIP or private), and is the property in a SFHA with mandatory coverage?
- Why hasn't it sold? Are there any deal-killer items the seller is aware of (foundation, flood, title, zoning, code violations)?
- Is there a deadline driving the sale (1031 exchange, divorce, estate, relocation)? That informs how much negotiation room exists.
- Schools are A-rated — typically a magnet for longer-tenancy family renters. What's the average tenant stay here, and is there a school-zone premium baked into asking?
- Crime grade is D in this area — have there been break-ins, vandalism, or insurance claims at this property in the last 3 years? What carrier currently insures it and at what premium?
- What's the average days-on-market for RENTAL listings here right now (not sales)? A rising rental-DOM trend means longer vacancies and softer asking-rent achievability than the comps imply.
- What's the recent tenant-quality profile in this submarket — average credit score on applications, eviction rate, late-payment / NSF rate, and stable-employment percentage? A property-management company in the area should have these aggregated.
- How much new for-sale + rental construction is in the pipeline within 1–3 miles? Heavy new supply typically softens prices + rents 12–24 months out; constrained supply supports both.
Investment metrics
- 1% rule
- 1.43% ✓
- Cap rate
- 12.64%
- Cash-on-cash
- 22.65%
- DSCR
- 2.01
- GRM
- 5.8
CMA / ARV
No comps found within radius.
Projected returns pro-forma
-3.0% appreciation · 8.0% rent growth · sell at horizon
- IRR
- 17.6%
- Equity multiple
- 1.76×
- Total profit
- $23,280
- Equity at exit
- $16,387
- IRR
- 29.4%
- Equity multiple
- 4.26×
- Total profit
- $100,338
- Equity at exit
- $9,502
Cash invested: $30,772 (down + closing). Projections, not guarantees.
Landlord ↔ Tenant lean methodology
- Overall (STATE)
- 18 Strongly Tenant-Friendly
- State California
- 18 Strongly Tenant-Friendly · D+13
- County
- — inherits STATE
- City
- — inherits STATE
ZIP-level market 95521
- Rents YoY
- 8.1%
- Active inventory
- 82
- Price-to-rent
- 5.8×
Monthly cashflow live
- Estimated rent
- $1,574 medium interval (Pro) →
- Mortgage (P&I)
- −$576
- Tax from tax record
- −$40 /mo · $482/yr
- Insurance
- −$46
- Flood insurance flood zone
- −$66 /mo · $798/yr
- HOA
- −$0
- Vacancy / Maint / Mgmt
- −$330
- Net cashflow
- $514
Break-even live
UW: 25.0% down · 7.5% · 30yr · 1.5% tax · 5.0% vac · 8.0% maint · 8.0% mgmt
Financing live
Cash to close
- Down payment
- $27,475
- Closing costs
- $3,297
- Reserves months
- —
- Total cash needed
- —
Loan-product check · same deal, 3 products live
Conventional
25% down · 7.5% · 30yr
- Down + closing
- —
- Monthly P&I
- —
- Monthly cashflow
- —
- DSCR
- —
- Eligible?
- —
Personal DTI + credit; lowest rate.
DSCR
20% down · 8.5% · 30yr
- Down + closing
- —
- Monthly P&I
- —
- Monthly cashflow
- —
- DSCR
- —
- Eligible?
- —
No personal income docs; deal must DSCR.
Hard money
10% down · 12.0% · 12mo
- Down + closing
- —
- Monthly P&I
- —
- Monthly cashflow
- —
- DSCR
- —
- Eligible?
- —
Short-term bridge; refi at stabilization.
Listing history 21 events
-
2026-06-19days on market $109,901 Active 155 DOM
-
2026-06-18days on market $109,901 Active 154 DOM
-
2026-06-17days on market $109,901 Active 153 DOM
-
2026-06-16days on market $109,901 Active 152 DOM
-
2026-06-15days on market $109,901 Active 151 DOM
-
2026-06-14days on market $109,901 Active 149 DOM
-
2026-06-13days on market $109,901 Active 148 DOM
-
2026-06-10days on market $109,901 Active 146 DOM
-
2026-06-09days on market $109,901 Active 145 DOM
-
2026-06-08days on market $109,901 Active 144 DOM
-
2026-06-07days on market $109,901 Active 143 DOM
-
2026-06-05days on market $109,901 Active 140 DOM
-
2026-06-03days on market $109,901 Active 139 DOM
-
2026-06-02days on market $109,901 Active 138 DOM
-
2026-06-01days on market $109,901 Active 137 DOM
-
2026-05-31days on market $109,901 Active 136 DOM
-
2026-05-30days on market $109,901 Active 135 DOM
-
2026-04-30price $114,411
-
2026-03-25price $118,811
-
2026-02-06price $125,521
-
2026-01-16$134,431 Active
ⓘ Source: listings_history table (triggers on properties + properties_extension) + one-shot
backfill from property_details.listing_events for pre-trigger history.
Tax reassessment forecast CA · Resets to sale price
- Current annual tax
- $482 · $40/mo
- Projected year-2 tax
- $835 · $70/mo
- Expected delta
- +$353/yr (+$29/mo · 73.2%)
ⓘ Screening estimate from a state-policy table — verify with the county assessor before closing.
Climate risk First Street
- Flood 7/10 Severe FEMA zone X (shaded) · 99% chance over 30 yrs
- Wildfire 3/10 Moderate
- Heat 2/10 Low 8 d/yr ≥72°F today · 21 d/yr by 30 yrs out
- Wind 1/10 Low
- Air quality 6/10 Major 9 unhealthy d/yr today · 9 by 30 yrs out
Nearby sold comps map
Loading sold comps map…
Walkable amenities ~0.75 mi
Loading nearby amenities…
Taxation est. · year 1
- Rental income
- $18,885
- − Mortgage interest
- −$6,156
- − Property taxes
- −$482
- − Insurance
- −$1,347
- − Repairs & maintenance
- −$1,511
- − Management
- −$1,511
- − Depreciation
- −$3,197
- Taxable income
- $4,681
- Est. tax owed @ 24.0%
- −$1,123
- After-tax cash flow
- $5,050/yr
For passive investors: Depreciation is non-cash, so a rental often shows a tax loss while cash-flowing — sheltering income. Rental losses are passive: they offset passive income freely, and up to $25,000/yr can offset ordinary (W-2) income if you actively participate and your MAGI is under $100k (phasing out to $0 by $150k); unused losses carry forward. On sale, claimed depreciation is recaptured at up to 25%, and gains may owe capital-gains tax (a 1031 exchange can defer both). Figures are a year-1 estimate at your 24.0% rate — not tax advice; consult a CPA.
Schools (NCES district)
- District
- Pacific Union Elementary
- NCES district ID
- 0629430
- Math proficiency
- 40% ▼ -2.00%
- Reading proficiency
- 53% ▲ 5.00%
- Median HH income
- $40,146
- Composite
- 41.08/100
- National rank
- #7442
- State rank
- #560 of 1400 in CA
Livability — Arcata
- Score
- 68/100
- State rank
- #275
- US rank
- #9258
Category grades
Schools grade is shown separately in the Schools card above.
Census & demographics
- Census place
- Arcata, CA
- County
- Humboldt County · 88,652 people
- City population
- 21,980
- Metro
- Eureka-Arcata, CA
- Population (ZIP)
- 21,980
- Household income
- $53,114
- Rent vs Own
- Severe rent burden
- 2139.0
Population outlook (Humboldt County) Hauer SSP2
- Today (2025)
- 135,550 people
- By 2030
- 134,798 · -0.6%
- By 2040
- 132,222 · -2.5%
- By 2050
- 130,850 · -3.5%
- By 2075
- 128,656 · -5.1%
- By 2100
- 120,238 · -11.3%
Race, ethnicity, and origin ACS 2023
- Neighborhood character
- Predominantly White (72%)
- Race & ethnicity
- White 72% Hispanic / Latino 15% Two or more races 13% Asian 2% Black 2% Native American 1%
- Hispanic origin (detail)
- Mexican 11% Puerto Rican 2%
- Common ancestry
- Lithuanian 5% Russian 5% Italian 4%
- Foreign-born
- 6% · Canada
- Languages at home
- 87% English-only · Spanish 8% Other Indo-European 2% Other Asian/Pacific 1%
Political lean MEDSL · Humboldt
- 2024 margin
- Strong D (+28.4) · D 62.0% · R 33.6% · Other 4.5%
- 2008→2024 swing
- +0.2pp no change · 2008: 28.2pp · 2024: 28.4pp
- All cycles
- 2024: D+28.4 2020: D+33.4 2016: D+25.9 2012: D+26.2 2008: D+28.2
Not yet ingested
- Civics
- —
Market trends
- HPI YoY
- ▼ -373.51%
- Current HPI
- 208.5938
- Rent YoY
- ▲ 8.08%
- Metro
- Eureka-Arcata, CA
- State GDP YoY
- ▲ 3.21%
- F500 in state
- 116
Industry mix (Fortune 500 HQ in CA)
| Industry | F500 HQs | Revenue |
|---|---|---|
| Technology | 27 | $1,492B |
|
||
| Financial Services | 3 | $174B |
|
||
| Retail | 3 | $44B |
|
||
| Insurance | 3 | $26B |
|
||
| Media / Entertainment | 2 | $115B |
|
||
| Pharmaceuticals / Biotech | 2 | $62B |
|
||
Price history
-14.9% since first listed4 events — show timeline
- 2026-04-30 Price Changed $114,411 HAR
- 2026-03-25 Price Changed $118,811 HAR
- 2026-02-06 Price Changed $125,521 HAR
- 2026-01-16 Listed $134,431 HAR
Property tax history
+0.3%/yrLatest (2025): $482 · +1.1% YoY. Source: county tax records.
Cash-flow waterfall
monthlySold comps — $/sqft
last 12 mo · ≤1 miLoading sold comps…