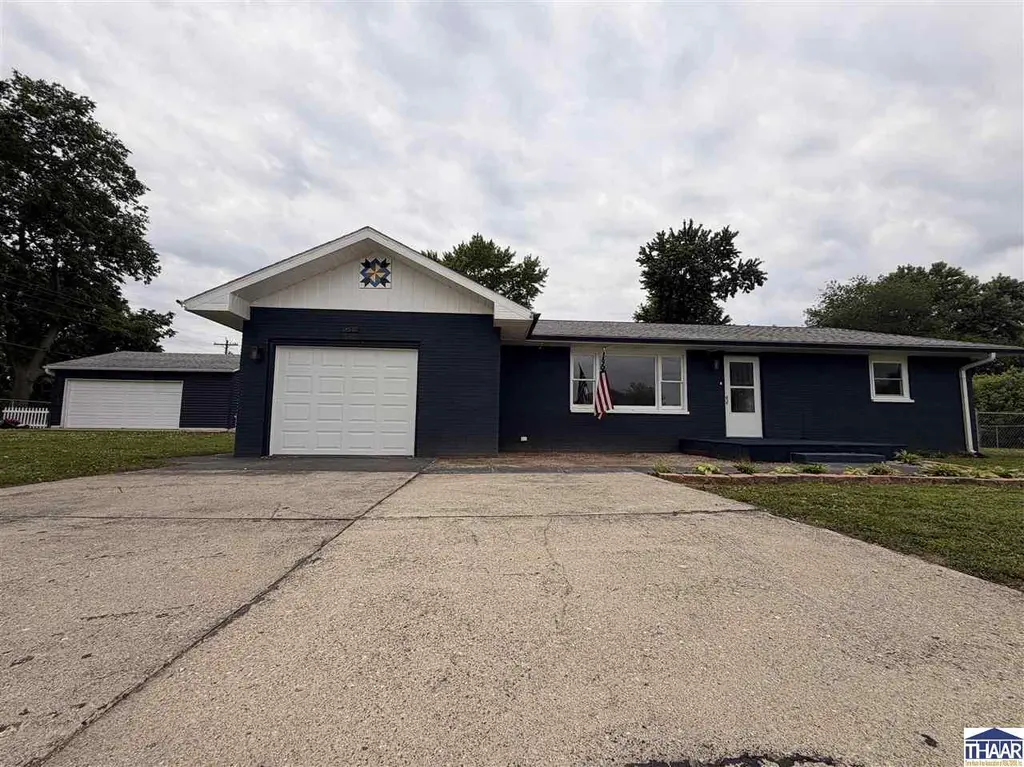
729 Monroe St · Montezuma, IN
Flood risk 1/10 · Minimal
- FEMA flood zone
- X (unshaded)
- Chance of flooding over 30 yrs
- 0.0%
- Est. flood insurance / yr
- $507 – $1,088
Fire risk 1/10 · Minimal
- Est. fire insurance / yr
- $717 – $1,331
Heat risk 4/10 · Minor
- Hot days now (above 105°F)
- 7 days/yr
- Hot days in 30 yrs
- 19 days/yr
Wind risk 2/10 · Minimal
- Chance of severe wind over 30 yrs
- 1.0%
Air-quality risk 2/10 · Minimal
- Unhealthy air days now
- 1 days/yr
- Unhealthy air days in 30 yrs
- 2 days/yr
Risk factors via First Street. Map © Google.
Why this score? — see what drove the D- grade
The composite is a weighted blend of 9 inputs, each scored 0–100. Each bar is that input's sub-score; the figure is the points it added to the 100-point composite (weight × sub-score).
- Cash flow +12.6/30.0
- Appreciation +5.5/10.0
- DSCR +3.8/10.0
- Livability +3.2/5.0
- Schools +3.0/10.0
- Rent growth +2.5/5.0
- Condition / age +2.5/5.0
- 1% rule +2.3/10.0
- ARV discount +0.0/15.0
$150,000
🖨 Deal sheet (PDF) 📄 Offer letter ✓ Due diligence
Listing remarks
Welcome to this unique find. This ranch home is located in the heart of a quaint little town, conveniently located right across the road from the Montezuma Elementary School. This home offers a big open feel with the open concept Livingroom, Dining space and Kitchen. The kitchen is very simple and ready to use. Off to the right of the Living area, you will find 2 nicely sized bedrooms that include their very own full sized bathrooms. The yard for this home has a nicely fenced back area whether you're trying to corral children, keep your dog in or maybe just keep other animals out. There is a 1 car attached garage that houses the newer gas water heater, Furnace and water softener. Off to the
Key facts
- Fenced back area
- Open concept
- Attached garage
Tags
Property features AI
Exterior
- Parking: Attached and detached garage spaces; Approximately 3.5 garage spaces; Concrete and gravel parking surfaces
- Security: Smoke detectors
- Utilities: Public sewer
- Home design: Single-family residence; One story
- Construction: Brick exterior; Shingle roof; Crawl space foundation; Built as a single-story home
- Exterior features: Front porch; Shingle roof; Brick construction
Interior
- Kitchen: Electric range; Electric oven; Microwave; Refrigerator; Dishwasher not listed
- Flooring: Ceramic tile
- Bathrooms: 2 full bathrooms
- Heating & cooling: Natural gas heating; Central air conditioning; Ceiling fans
- Interior features: Window coverings; Insulated windows; Water softener; Crawl space basement
- Laundry & utility: Washer; Dryer
Neighborhood map
What this means for you Summary
Snapshot
- This is a 2-bed/2.0-bath single-family listed at $150k.
Deal economics
- At list price, monthly cash flow is $-18 ($-218/yr) — negative.
- To cash-flow at today's rent, offer at most $147k (2.1% below list).
- To meet the 1% rule (rent ≥ 1% of price), the offer needs to be $109k (27.1% below list).
- Recommended offer: $109k (27.1% below list) — sets the bar for 1% rule.
Location & tenants
- Location reads 65/100 on livability (#314 in IN) — a middle-class / working-renter tenant base. Strengths: cost of living A+, housing A+, health & safety A; Watch: employment C-, crime D+, amenities F.
- Southwest Parke Community School Corporation (rural): math 34% / reading 36% proficiency, ranked #195 of 301 in IN (top 65%) — families likely to look elsewhere, expect single-tenant / working-renter base with shorter leases.
- Zoned schools: Montezuma Elementary School (math 47% / reading 37%, grade F, #434 of 994 statewide, top 48%, 232 students, 66% FRL); Riverton Parke Jr-Sr High School (math 23% / reading 39%, grade F, #303 of 369 statewide, top 82%, 472 students, 53% FRL).
- Market conditions: 10 active listings in the ZIP; 61 units permitted in Parke County in 2024 (0 in 5+ unit buildings).
Forward outlook
- In year one you build about $3k of equity ($1k loan paydown + $2k appreciation (1.1% local appreciation)).
- Parke County population projected at -10% by 2050 — secular population decline; favor cash flow + early exit over multi-decade hold.
- At projected returns (1.1% appreciation + 3.0% rent growth), your $42k cash investment doubles in ~10 years — after that, you're playing with house money.
Negotiation context
- It's been on market 19 days — a 2% lower offer ($148k) is reasonable based on typical stale-listing flexibility.
- 6 sale attempts since 6y ago with the ask held roughly flat each time — persistent listings suggest the price (not the market) is what's stuck; bring a comps-based counter.
- Current owner paid $78k; list at $150k implies a 93% gain — meaningful room to come down on a strong offer.
Questions for the listing agent
- What do current leases actually rent for vs. the listed asking? Can we see a recent rent roll and the last 12 months of T-12 income?
- Built in 1969 — when were the roof, HVAC, electrical panel, plumbing, and water heater last replaced?
- Is there a deadline driving the sale (1031 exchange, divorce, estate, relocation)? That informs how much negotiation room exists.
- Schools are D-rated, which usually means shorter tenancies and higher turnover. Who's the typical renter profile here, and what's been the actual vacancy rate?
- Crime grade is D in this area — have there been break-ins, vandalism, or insurance claims at this property in the last 3 years? What carrier currently insures it and at what premium?
- The area grade is low — what's the realistic commute time and amenity access for the typical tenant pool here? Any planned neighborhood developments (good or bad) we should know about?
- What's the average days-on-market for RENTAL listings here right now (not sales)? A rising rental-DOM trend means longer vacancies and softer asking-rent achievability than the comps imply.
- What's the recent tenant-quality profile in this submarket — average credit score on applications, eviction rate, late-payment / NSF rate, and stable-employment percentage? A property-management company in the area should have these aggregated.
- How much new for-sale + rental construction is in the pipeline within 1–3 miles? Heavy new supply typically softens prices + rents 12–24 months out; constrained supply supports both.
Investment metrics
- 1% rule
- 0.73% ✗
- Cap rate
- 6.15%
- Cash-on-cash
- -0.52%
- DSCR
- 0.98
- GRM
- 11.4
CMA / ARV
- ARV (on-the-fly)
- $124,608
- Comps found
- 3
Show comp detail 3 sales within ~0.75 mi
| Address | Dist | Beds/Ba | Sqft | Sold | Price | $/sf | Match |
|---|---|---|---|---|---|---|---|
| 354 Bloomingdale Rd | 0.44mi | 2/1.0 | 1,458 (+3%) | 4mo | $120,000 | $82 | 67 |
| 425 E Sylvester St | 0.34mi | 3/1.0 (+1) | 1,247 (-12%) | 1mo | $109,900 | $88 | 55 |
| 1696 N Washington St | 0.73mi | 3/1.0 (+1) | 1,456 (+3%) | 22mo | $150,000 | $103 | 34 |
Match score weights: distance 35% · size 25% · config 20% · recency 20%. Top-matched comps best support the ARV.
Projected returns pro-forma
1.09% appreciation · 3.0% rent growth · sell at horizon
- IRR
- 1.1%
- Equity multiple
- 1.05×
- Total profit
- $2,255
- Equity at exit
- $51,938
- IRR
- 5.6%
- Equity multiple
- 1.69×
- Total profit
- $29,170
- Equity at exit
- $69,589
Cash invested: $42,000 (down + closing). Projections, not guarantees.
Landlord ↔ Tenant lean methodology
- Overall (STATE)
- 90 Strongly Landlord-Friendly
- State Indiana
- 90 Strongly Landlord-Friendly · R+11
- County
- — inherits STATE
- City
- — inherits STATE
ZIP-level market 47862
- Home prices YoY
- 0.5%
- Active inventory
- 10
- Price-to-rent
- 11.4×
Monthly cashflow live
- Estimated rent
- $1,094 medium interval (Pro) →
- Mortgage (P&I)
- −$787
- Tax from tax record
- −$33 /mo · $398/yr
- Insurance
- −$62
- HOA
- −$0
- Vacancy / Maint / Mgmt
- −$230
- Net cashflow
- $-18
Break-even live
Sensitivity live
| Price | -10% $67 | -5% $24 | +0% $-18 | +5% $-61 | +10% $-103 |
|---|---|---|---|---|---|
| Rent | -10% $-105 | -5% $-61 | +0% $-18 | +5% $25 | +10% $68 |
| Rate | -1.0pp $57 | -0.5pp $20 | base $-18 | +0.5pp $-57 | +1.0pp $-97 |
UW: 25.0% down · 7.5% · 30yr · 1.5% tax · 5.0% vac · 8.0% maint · 8.0% mgmt
Financing live
Cash to close
- Down payment
- $37,500
- Closing costs
- $4,500
- Reserves months
- —
- Total cash needed
- —
Loan-product check · same deal, 3 products live
Conventional
25% down · 7.5% · 30yr
- Down + closing
- —
- Monthly P&I
- —
- Monthly cashflow
- —
- DSCR
- —
- Eligible?
- —
Personal DTI + credit; lowest rate.
DSCR
20% down · 8.5% · 30yr
- Down + closing
- —
- Monthly P&I
- —
- Monthly cashflow
- —
- DSCR
- —
- Eligible?
- —
No personal income docs; deal must DSCR.
Hard money
10% down · 12.0% · 12mo
- Down + closing
- —
- Monthly P&I
- —
- Monthly cashflow
- —
- DSCR
- —
- Eligible?
- —
Short-term bridge; refi at stabilization.
Listing history 14 events
-
2026-06-21days on market $150,000 Active 19 DOM
-
2026-06-19days on market $150,000 Active 17 DOM
-
2026-06-18days on market $150,000 Active 16 DOM
-
2026-06-17days on market $150,000 Active 15 DOM
-
2026-06-16days on market $150,000 Active 14 DOM
-
2026-06-15days on market $150,000 Active 13 DOM
-
2026-06-14days on market $150,000 Active 11 DOM
-
2026-06-13pricedays on market $150,000 Active 10 DOM
-
2026-06-10days on market $154,900 Active 8 DOM
-
2026-06-09days on market $154,900 Active 7 DOM
-
2026-06-08days on market $154,900 Active 6 DOM
-
2026-06-07days on market $154,900 Active 5 DOM
-
2026-06-03remarks 699-char remark
-
2026-06-03$154,900 Active 1 DOM
ⓘ Source: listings_history table (triggers on properties + properties_extension) + one-shot
backfill from property_details.listing_events for pre-trigger history.
Tax reassessment forecast IN · Partial reset (capped growth)
- Current annual tax
- $398 · $33/mo
- Projected year-2 tax
- $837 · $70/mo
- Expected delta
- +$438/yr (+$37/mo · 110.0%)
ⓘ Screening estimate from a state-policy table — verify with the county assessor before closing.
Climate risk First Street
- Flood 1/10 Low FEMA zone X (unshaded) · 0% chance over 30 yrs
- Wildfire 1/10 Low
- Heat 4/10 Moderate 7 d/yr ≥105°F today · 19 d/yr by 30 yrs out
- Wind 2/10 Low 100% chance of damaging wind over 30 yrs
- Air quality 2/10 Low 1 unhealthy d/yr today · 2 by 30 yrs out
Nearby sold comps map
Loading sold comps map…
Walkable amenities ~0.75 mi
Loading nearby amenities…
Taxation est. · year 1
- Rental income
- $13,126
- − Mortgage interest
- −$8,402
- − Property taxes
- −$398
- − Insurance
- −$750
- − Repairs & maintenance
- −$1,050
- − Management
- −$1,050
- − Depreciation
- −$4,364
- Taxable loss
- −$2,889
- Est. tax savings @ 24.0%
- +$693
- After-tax cash flow
- $475/yr
For passive investors: Depreciation is non-cash, so a rental often shows a tax loss while cash-flowing — sheltering income. Rental losses are passive: they offset passive income freely, and up to $25,000/yr can offset ordinary (W-2) income if you actively participate and your MAGI is under $100k (phasing out to $0 by $150k); unused losses carry forward. On sale, claimed depreciation is recaptured at up to 25%, and gains may owe capital-gains tax (a 1031 exchange can defer both). Figures are a year-1 estimate at your 24.0% rate — not tax advice; consult a CPA.
Schools (NCES district)
- District
- Southwest Parke Community School Corporation
- NCES district ID
- 1810900
- Math proficiency
- 34% ▼ -4.00%
- Reading proficiency
- 36% ▼ -6.00%
- Median HH income
- $42,288
- Composite
- 29.61/100
- National rank
- #6474
- State rank
- #195 of 301 in IN
Livability — Montezuma
- Score
- 65/100
- State rank
- #314
- US rank
- #12442
Category grades
Schools grade is shown separately in the Schools card above.
Census & demographics
- Census place
- Montezuma, IN
- Population (ZIP)
- 1,262
Population outlook (Parke County) Hauer SSP2
- Today (2025)
- 15,937 people
- By 2030
- 15,467 · -2.9%
- By 2040
- 14,793 · -7.2%
- By 2050
- 14,318 · -10.2%
- By 2075
- 13,484 · -15.4%
- By 2100
- 12,236 · -23.2%
Race, ethnicity, and origin ACS 2023
- Neighborhood character
- Predominantly White (87%)
- Race & ethnicity
- White 87% Two or more races 10% Hispanic / Latino 10% Black 2%
- Hispanic origin (detail)
- Mexican 10%
- Common ancestry
- Iranian 2% Slovak 2% Romanian 2%
- Foreign-born
- 2% · Canada, Jamaica
- Languages at home
- 95% English-only · Spanish 5%
Political lean MEDSL · Parke
- 2024 margin
- Solid R (+56.9) · D 20.6% · R 77.5% · Other 1.9%
- 2008→2024 swing
- -42.8pp toward R · 2008: -14.1pp · 2024: -56.9pp
- All cycles
- 2024: R+56.9 2020: R+55.5 2016: R+52.0 2012: R+32.6 2008: R+14.1
Not yet ingested
- Civics
- —
Market trends
- HPI YoY
- ▲ 1.09%
- Current HPI
- 212.829
- Rent YoY
- —
- Metro
- —
- State GDP YoY
- ▲ 2.90%
- F500 in state
- 18
Industry mix (Fortune 500 HQ in IN)
| Industry | F500 HQs | Revenue |
|---|---|---|
| Industrial Machinery | 2 | $37B |
|
||
| Healthcare | 1 | $177B |
|
||
| Pharmaceuticals | 1 | $45B |
|
||
| Metals / Steel | 1 | $18B |
|
||
| Agriculture | 1 | $17B |
|
||
| Packaging | 1 | $12B |
|
||
Price history
+93.9% since first listed14 events — show timeline
- 2026-06-01 Listed $154,900 THAAR
- 2026-04-02 Listing Removed — MIBOR as Distributed by MLS Grid
- 2026-04-01 Relisted — MIBOR as Distributed by MLS Grid
- 2025-09-24 Listed $155,000 MIBOR as Distributed by MLS Grid
- 2025-07-05 Pending — THAAR
- 2025-06-27 Price Changed $157,000 THAAR
- 2025-06-21 Listed $165,000 THAAR
- 2025-05-05 Price Changed $140,000 THAAR
- 2025-04-22 Price Changed $145,500 THAAR
- 2025-04-11 Price Changed $150,000 THAAR
- 2025-04-02 Price Changed $155,000 THAAR
- 2025-03-03 Listed $160,000 THAAR
- 2021-02-12 Sold (MLS) $77,871 THAAR
- 2020-09-25 Listed $79,900 THAAR
Property tax history
-1.6%/yrLatest (2024): $398 · +19.6% YoY. Source: county tax records.
Cash-flow waterfall
monthlySold comps — $/sqft
last 12 mo · ≤1 miLoading sold comps…