 🌊 Lakefront
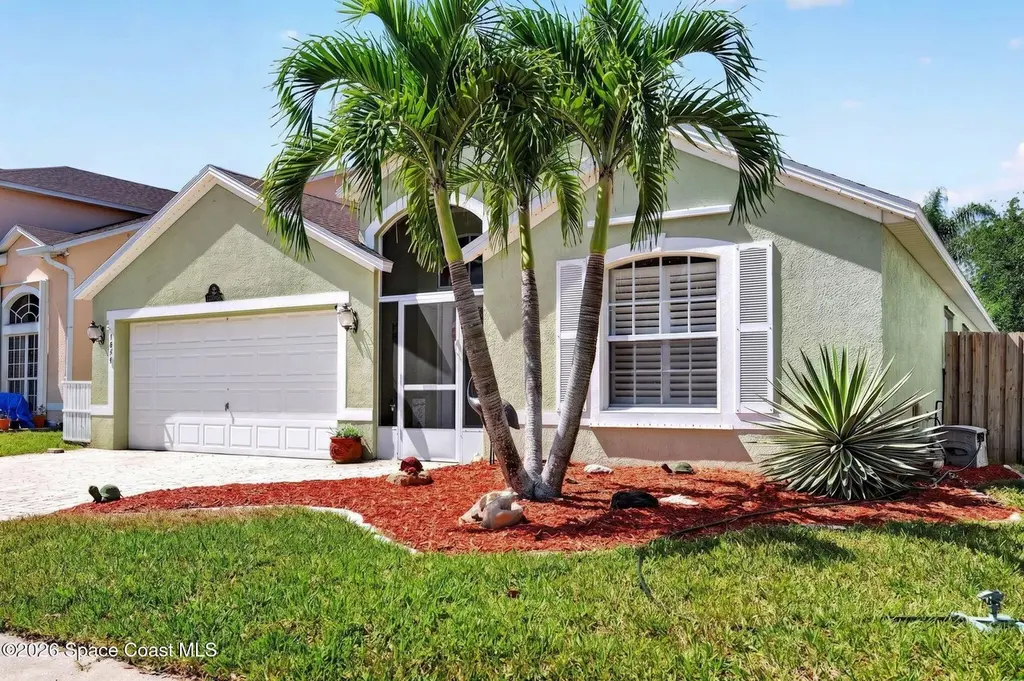
1441 Wekiva Dr · Viera East, FL
Flood risk 1/10 · Minimal
- FEMA flood zone
- A
- Chance of flooding over 30 yrs
- 0.0%
- Est. flood insurance / yr
- $1,009 – $1,996
Fire risk 2/10 · Minimal
- Est. fire insurance / yr
- $947 – $1,759
Heat risk 10/10 · Severe
- Hot days now (above 104°F)
- 7 days/yr
- Hot days in 30 yrs
- 23 days/yr
Wind risk 10/10 · Severe
- Chance of severe wind over 30 yrs
- 99.0%
Air-quality risk 1/10 · Minimal
- Unhealthy air days now
- 0 days/yr
- Unhealthy air days in 30 yrs
- 0 days/yr
Risk factors via First Street. Map © Google.
Why this score? — see what drove the D grade
The composite is a weighted blend of 9 inputs, each scored 0–100. Each bar is that input's sub-score; the figure is the points it added to the 100-point composite (weight × sub-score).
- Cash flow +11.0/30.0
- ARV discount +7.5/15.0
- Appreciation +5.2/10.0
- Schools +4.7/10.0
- Livability +4.0/5.0
- DSCR +3.2/10.0
- Rent growth +3.0/5.0
- Condition / age +2.5/5.0
- 1% rule +2.3/10.0
$425,000
🖨 Deal sheet (PDF) 📄 Offer letter ✓ Due diligence
Listing remarks MLS
Perfect in every detail, this Crayton Manor Model looks like a page out of House Beautiful. Soaring ceilings and neutral colors throughout. Relax on the big breezy backporch and enjoy the privacy of the fenced yard. Ideally located in the sought after Springs of Suntree with 2 community pools, one heated, tennis, exercise room and bike walking trails that meander throughout the community. Walk to the nature preserve where you can gaze at an abundance of Florida birds from the observation deck. '||chr(10)||'Addendum - But don`t dream too long. .. this one will get snapped up fast!
Key facts
- Close to the beach
- Screened porch
- 5,663 sq ft lot
Tags
Neighborhood map
What this means for you Summary
Snapshot
- This is a 4-bed/2.0-bath single-family listed at $425k.
Deal economics
- At list price, monthly cash flow is $-307 ($-4k/yr) — negative.
- To cash-flow at today's rent, offer at most $371k (12.7% below list).
- To meet the 1% rule (rent ≥ 1% of price), the offer needs to be $309k (27.3% below list).
- Recommended offer: $309k (27.3% below list) — sets the bar for 1% rule.
Location & tenants
- Location reads 79/100 on livability (#141 in FL, #1,964 nationally) — a middle-class / working-renter tenant base. Strengths: crime A+, employment A+, housing A+; Watch: commute D+, amenities F.
- Brevard (suburban): math 53% / reading 57% proficiency, ranked #19 of 73 in FL (top 26%) — acceptable for families but not a draw, mixed tenant base, ~2y average lease.
- Zoned schools: Quest Elementary School (math 83% / reading 80%, grade A+, #90 of 2,144 statewide, top 4%, 691 students, 20% FRL); John F. Kennedy Middle School (math 67% / reading 59%, grade B+, #111 of 571 statewide, top 20%, 673 students, 41% FRL); Viera High School (math 58% / reading 71%, grade B-, #78 of 667 statewide, top 13%, 2,289 students, 15% FRL) — zoned schools average 25% FRL vs 43% district-wide (18 pts lower); this property's tenant base skews higher-income than the district average.
- Zoned-school proficiency averages 70% at this address vs 55% district-wide (+15 pts) — the actual schools serving this property are materially stronger than the Brevard average implies; a family-tenant draw the district grade alone would hide.
- Market conditions: Rents rising (+2.0%/yr); 593 active listings in the ZIP; 3 comparable units currently listed for rent nearby; rentals at typical pace (median 25d on market — plan ~3-4 weeks tenant-placement turnaround); high-income renter base; 4,602 units permitted in Brevard County in 2024 (702 in 5+ unit buildings).
Forward outlook
- In year one you build about $5k of equity ($3k loan paydown + $2k appreciation (0.4% local appreciation)).
- Brevard County population projected at +15% by 2050 — modest demand growth; plan on rents tracking national, not racing it.
- By year 7, paydown + projected appreciation supports a ~$35k cash-out refi (75% LTV) — recoverable capital for the next deal without selling this one.
Negotiation context
- Only 4 days on market — expect competitive offers; lowballing is unlikely to land.
- 2 sale attempts since 22y ago with the ask held roughly flat each time — persistent listings suggest the price (not the market) is what's stuck; bring a comps-based counter.
- Current owner paid $200k; list at $425k implies a 113% gain — meaningful room to come down on a strong offer.
Risks & watch-outs
- Watch-outs: flood insurance adds $125/mo.
- Climate carrying-cost: in FEMA flood zone A (mandatory federal flood insurance); severe wind risk, 99% chance of damaging wind over 30y; extreme-heat days projected 7→23/yr by 2055 (HVAC capex compounding) — expect insurance premiums to compound above CPI over the hold.
Questions for the listing agent
- What do current leases actually rent for vs. the listed asking? Can we see a recent rent roll and the last 12 months of T-12 income?
- What's the actual annual flood-insurance premium (NFIP or private), and is the property in a SFHA with mandatory coverage?
- What does the HOA fee cover, when was the last increase, and are there any pending special assessments or reserve-fund shortfalls?
- Is there a deadline driving the sale (1031 exchange, divorce, estate, relocation)? That informs how much negotiation room exists.
- Schools are F-rated, which usually means shorter tenancies and higher turnover. Who's the typical renter profile here, and what's been the actual vacancy rate?
- The area grade is low — what's the realistic commute time and amenity access for the typical tenant pool here? Any planned neighborhood developments (good or bad) we should know about?
- This sits on a lake — are riparian / water-frontage rights deeded with the parcel? Any dock permits, shoreline easements, or HOA water-use restrictions?
- What's the documented flood / surge / shoreline-erosion history here (FEMA AND non-FEMA — e.g., storm surge, creek backup, septic-field saturation)?
- Any water-quality or seasonal algae-bloom issues that affect tenant satisfaction or short-term-rental demand?
- What's the average days-on-market for RENTAL listings here right now (not sales)? A rising rental-DOM trend means longer vacancies and softer asking-rent achievability than the comps imply.
- What's the recent tenant-quality profile in this submarket — average credit score on applications, eviction rate, late-payment / NSF rate, and stable-employment percentage? A property-management company in the area should have these aggregated.
- How much new for-sale + rental construction is in the pipeline within 1–3 miles? Heavy new supply typically softens prices + rents 12–24 months out; constrained supply supports both.
Investment metrics
- 1% rule
- 0.73% ✗
- Cap rate
- 5.78%
- Cash-on-cash
- -1.83%
- DSCR
- 0.92
- GRM
- 11.5
CMA / ARV
No comps found within radius.
Projected returns pro-forma
0.4% appreciation · 1.96% rent growth · sell at horizon
- IRR
- -4.7%
- Equity multiple
- 0.77×
- Total profit
- $-27,113
- Equity at exit
- $132,044
- IRR
- 0.2%
- Equity multiple
- 1.03×
- Total profit
- $3,187
- Equity at exit
- $165,791
Cash invested: $119,000 (down + closing). Projections, not guarantees.
Landlord ↔ Tenant lean methodology
- Overall (STATE)
- 87 Strongly Landlord-Friendly
- State Florida
- 87 Strongly Landlord-Friendly · R+3
- County
- — inherits STATE
- City
- — inherits STATE
ZIP-level market 32940
- Home prices YoY
- 0.1%
- Rents YoY
- 2.0%
- Active inventory
- 593
- Price-to-rent
- 11.5×
Monthly cashflow live
- Estimated rent
- $3,091 medium interval (Pro) →
- Mortgage (P&I)
- −$2,229
- Tax from tax record
- −$158 /mo · $1,893/yr
- Insurance
- −$177
- Flood insurance flood zone
- −$125 /mo · $1,502/yr
- HOA
- −$60
- Vacancy / Maint / Mgmt
- −$649
- Net cashflow
- $-307
Break-even live
Sensitivity live
| Price | -10% $-66 | -5% $-186 | +0% $-307 | +5% $-427 | +10% $-547 |
|---|---|---|---|---|---|
| Rent | -10% $-551 | -5% $-429 | +0% $-307 | +5% $-185 | +10% $-62 |
| Rate | -1.0pp $-93 | -0.5pp $-199 | base $-307 | +0.5pp $-417 | +1.0pp $-529 |
UW: 25.0% down · 7.5% · 30yr · 1.5% tax · 5.0% vac · 8.0% maint · 8.0% mgmt
Financing live
Cash to close
- Down payment
- $106,250
- Closing costs
- $12,750
- Reserves months
- —
- Total cash needed
- —
Loan-product check · same deal, 3 products live
Conventional
25% down · 7.5% · 30yr
- Down + closing
- —
- Monthly P&I
- —
- Monthly cashflow
- —
- DSCR
- —
- Eligible?
- —
Personal DTI + credit; lowest rate.
DSCR
20% down · 8.5% · 30yr
- Down + closing
- —
- Monthly P&I
- —
- Monthly cashflow
- —
- DSCR
- —
- Eligible?
- —
No personal income docs; deal must DSCR.
Hard money
10% down · 12.0% · 12mo
- Down + closing
- —
- Monthly P&I
- —
- Monthly cashflow
- —
- DSCR
- —
- Eligible?
- —
Short-term bridge; refi at stabilization.
Rent comps 3 comps
| Address | Beds | Baths | Sqft | Rent | $/sqft | DOM | Units | Dist |
|---|---|---|---|---|---|---|---|---|
| 1385 Fuji Dr Melbourne, FL | 3.0 | 2.0 | 1770 | $3,000 | $1.69 | 25d | 1 | 0.39mi |
| 300 Tuscany Way Melbourne, FL | 1.0–3.0 | 1.0–2.0 | 1097 | $2,269 | $2.07 | 25d | 12 | 1.31mi |
| 915 Starling Way Rockledge, FL | 3.0 | 2.0 | 2202 | $3,495 | $1.59 | 21d | 1 | 1.44mi |
HOA detail
- Monthly dues
- $60 · $720/yr
- Likely covers
- pool
Listing history 5 events
-
2026-04-24status Pending
-
2026-04-20$425,000 Active
-
2004-11-04soldstatus $199,900
-
2004-11-01soldstatus $199,900 586-char remark
Show marketing remark (586 chars)
Perfect in every detail, this Crayton Manor Model looks like a page out of House Beautiful. Soaring ceilings and neutral colors throughout. Relax on the big breezy backporch and enjoy the privacy of the fenced yard. Ideally located in the sought after Springs of Suntree with 2 community pools, one heated, tennis, exercise room and bike walking trails that meander throughout the community. Walk to the nature preserve where you can gaze at an abundance of Florida birds from the observation deck. '||chr(10)||'Addendum - But don`t dream too long. .. this one will get snapped up fast!
-
2004-05-07$199,900 586-char remark
Show marketing remark (586 chars)
Perfect in every detail, this Crayton Manor Model looks like a page out of House Beautiful. Soaring ceilings and neutral colors throughout. Relax on the big breezy backporch and enjoy the privacy of the fenced yard. Ideally located in the sought after Springs of Suntree with 2 community pools, one heated, tennis, exercise room and bike walking trails that meander throughout the community. Walk to the nature preserve where you can gaze at an abundance of Florida birds from the observation deck. '||chr(10)||'Addendum - But don`t dream too long. .. this one will get snapped up fast!
ⓘ Source: listings_history table (triggers on properties + properties_extension) + one-shot
backfill from property_details.listing_events for pre-trigger history.
Tax reassessment forecast FL · Resets to sale price
- Current annual tax
- $1,893 · $158/mo
- Projected year-2 tax
- $3,528 · $294/mo
- Expected delta
- +$1,635/yr (+$136/mo · 86.4%)
ⓘ Screening estimate from a state-policy table — verify with the county assessor before closing.
Climate risk First Street
- Flood 1/10 Low FEMA zone A · 0% chance over 30 yrs
- Wildfire 2/10 Low
- Heat 10/10 Extreme 7 d/yr ≥104°F today · 23 d/yr by 30 yrs out
- Wind 10/10 Extreme 99% chance of damaging wind over 30 yrs
- Air quality 1/10 Low 0 unhealthy d/yr today · 0 by 30 yrs out
Nearby sold comps map
Loading sold comps map…
Walkable amenities ~0.75 mi
Loading nearby amenities…
Taxation est. · year 1
- Rental income
- $37,096
- − Mortgage interest
- −$23,807
- − Property taxes
- −$1,893
- − Insurance
- −$3,628
- − Repairs & maintenance
- −$2,968
- − Management
- −$2,968
- − HOA
- −$720
- − Depreciation
- −$12,364
- Taxable loss
- −$11,250
- Est. tax savings @ 24.0%
- +$2,700
- After-tax cash flow
- $-979/yr
For passive investors: Depreciation is non-cash, so a rental often shows a tax loss while cash-flowing — sheltering income. Rental losses are passive: they offset passive income freely, and up to $25,000/yr can offset ordinary (W-2) income if you actively participate and your MAGI is under $100k (phasing out to $0 by $150k); unused losses carry forward. On sale, claimed depreciation is recaptured at up to 25%, and gains may owe capital-gains tax (a 1031 exchange can defer both). Figures are a year-1 estimate at your 24.0% rate — not tax advice; consult a CPA.
Schools (NCES district)
- District
- Brevard
- NCES district ID
- 1200150
- Math proficiency
- 53% ▼ -9.00%
- Reading proficiency
- 57% ▼ -4.00%
- Median HH income
- $49,426
- Composite
- 46.86/100
- National rank
- #2370
- State rank
- #19 of 73 in FL
Livability — Viera East
- Score
- 79/100
- State rank
- #141
- US rank
- #1964
Category grades
Schools grade is shown separately in the Schools card above.
Census & demographics
- County
- Brevard County · 602,871 people
- Metro
- Palm Bay-Melbourne-Titusville, FL
- Population (ZIP)
- 51,727
- Household income
- $110,495
- Rent vs Own
- Severe rent burden
- 873.0
Population outlook (Brevard County) Hauer SSP2
- Today (2025)
- 623,254 people
- By 2030
- 648,420 · +4.0%
- By 2040
- 690,009 · +10.7%
- By 2050
- 715,669 · +14.8%
- By 2075
- 775,744 · +24.5%
- By 2100
- 776,687 · +24.6%
Race, ethnicity, and origin ACS 2023
- Neighborhood character
- Predominantly White (77%)
- Race & ethnicity
- White 77% Hispanic / Latino 10% Two or more races 9% Asian 5% Black 3%
- Hispanic origin (detail)
- Mexican 1% Puerto Rican 3% Cuban 1%
- Common ancestry
- Romanian 4% Lithuanian 3% Slovak 2%
- Foreign-born
- 11% · Canada, Jamaica, China
- Languages at home
- 88% English-only · Spanish 6% Other Indo-European 2% German/W. Germanic 1%
Political lean MEDSL · Brevard
- 2024 margin
- Strong R (+20.8) · D 39.1% · R 59.9% · Other 1.0%
- 2008→2024 swing
- -10.4pp toward R · 2008: -10.4pp · 2024: -20.8pp
- All cycles
- 2024: R+20.8 2020: R+16.4 2016: R+19.8 2012: R+12.7 2008: R+10.4
Not yet ingested
- Civics
- —
Market trends
- HPI YoY
- ▲ 0.40%
- Current HPI
- 298.1023
- Rent YoY
- ▲ 1.96%
- Metro
- Palm Bay-Melbourne-Titusville, FL
- State GDP YoY
- ▲ 3.28%
- F500 in state
- 36
Industry mix (Fortune 500 HQ in FL)
| Industry | F500 HQs | Revenue |
|---|---|---|
| Industrial Technology | 2 | $29B |
|
||
| Insurance | 2 | $17B |
|
||
| Retail | 1 | $60B |
|
||
| Technology Distribution | 1 | $58B |
|
||
| Homebuilding | 1 | $35B |
|
||
| Technology Manufacturing | 1 | $35B |
|
||
Price history
+112.6% since first listed5 events — show timeline
- 2026-04-24 Pending — SCMLS
- 2026-04-20 Listed $425,000 SCMLS
- 2004-11-04 Sold (Public Records) $199,900 Public Records
- 2004-11-01 Sold (MLS) $199,900 SCMLS
- 2004-05-07 Listed $199,900 SCMLS
Property tax history
+1.1%/yrLatest (2025): $1,893 · -0.5% YoY. Source: county tax records.
Cash-flow waterfall
monthlySold comps — $/sqft
last 12 mo · ≤1 miLoading sold comps…