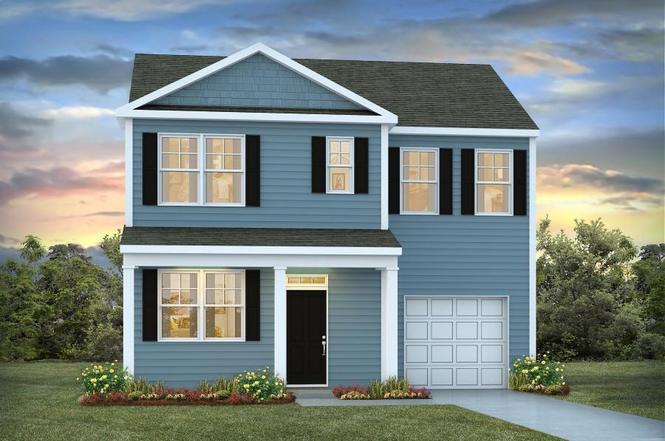
604 Perch Ln · Santee, SC
Flood risk No data
- FEMA flood zone
- —
- Chance of flooding over 30 yrs
- —
- Est. flood insurance / yr
- —
Fire risk No data
- Est. fire insurance / yr
- —
Heat risk No data
- Hot days now (above threshold)
- —
- Hot days in 30 yrs
- —
Wind risk No data
- Chance of severe wind over 30 yrs
- —
Air-quality risk No data
- Unhealthy air days now
- —
- Unhealthy air days in 30 yrs
- —
Risk factors via First Street. Map © Google.
Why this score? — see what drove the C- grade
The composite is a weighted blend of 9 inputs, each scored 0–100. Each bar is that input's sub-score; the figure is the points it added to the 100-point composite (weight × sub-score).
- Cash flow +14.7/30.0
- ARV discount +10.7/15.0
- Appreciation +6.7/10.0
- Schools +5.0/10.0
- DSCR +4.5/10.0
- 1% rule +4.3/10.0
- Livability +3.1/5.0
- Rent growth +2.5/5.0
- Condition / age +2.5/5.0
$230,000
🖨 Deal sheet 📄 Offer letter ✓ Due diligence
Listing remarks
Special Interest Rate with Closing Cost Assistance paid for by BuilderCenter Pointe is conveniently located in the heart of Santee, South Carolina only minutes from I-95 with deep water access to Lake Marion from nearby public boat landings. This is one of South Carolina's top golf destinations with three courses within just 2 miles of the community. Enjoy world class freshwater fishing or stop by one of the locally owned restaurants. Within just a few miles, you can visit several top tourist spots such as Santee State Park along Lake Marion which offers camping, cabin rentals and pier fishing. Spend the day at Orangeburg County Recreation and Water Park, a seasonal County Waterpark with a
Key facts
- Contemporary design
- Santee state park
- Wildlife viewing
Tags
Property features AI
Finance
- HOA & community: Annual association fee of $400; Community trash service
Exterior
- Parking: 1-car garage
- Utilities: Public sewer; Dominion Energy service
- Home design: Single-family detached residence; One story; New construction; Located in the Center Pointe subdivision
- Construction: Architectural fiberglass roof; Fee simple ownership
- Exterior features: Level, wooded lot; Lot under 0.5 acre
Interior
- Kitchen: Dishwasher; Disposal; Electric range; Microwave
- Bedrooms: 3 bedrooms; Primary bedroom on lower level with walk-in closet(s)
- Flooring: Vinyl flooring
- Bathrooms: 2.5 bathrooms (total)
- Heating & cooling: Central air conditioning; Electric heating
- Interior features: Smooth ceilings; Kitchen island; Eat-in kitchen; Living/dining combo; Pantry
- Laundry & utility: Laundry room with washer hookup and electric dryer hookup
Neighborhood map
What this means for you Summary
Snapshot
- This is a 3-bed/2.5-bath single-family listed at $230k.
Deal economics
- At list price, monthly cash flow is $60 ($716/yr) — positive.
- The deal already cash-flows at list — no discount required.
- To meet the 1% rule (rent ≥ 1% of price), the offer needs to be $213k (7.4% below list).
- Recommended offer: $213k (7.4% below list) — sets the bar for 1% rule.
- Cap rate 6.6% vs local median 5.4% in Santee — meaningfully above typical; check what's discounted (condition, days-on-market, listing class) to confirm the premium yield is real.
Location & tenants
- Location reads 61/100 on livability (#202 in SC) — a middle-class / working-renter tenant base. Strengths: cost of living A+, health & safety A+; Watch: crime F, amenities F, commute F.
- Zoned schools: Elloree Elementary (math 10%, 387 students, 100% FRL).
- Market conditions: 154 active listings in the ZIP; 3 comparable units currently listed for rent nearby; rentals at typical pace (median 23d on market — plan ~3-4 weeks tenant-placement turnaround); 87 units permitted in Orangeburg County in 2024 (0 in 5+ unit buildings).
Forward outlook
- In year one you build about $10k of equity ($2k loan paydown + $8k appreciation (3.5% local appreciation)).
- Orangeburg County population projected at -27% by 2050 — secular population decline; favor cash flow + early exit over multi-decade hold.
- At projected returns (3.5% appreciation + 3.0% rent growth), your $64k cash investment doubles in ~6 years — after that, you're playing with house money.
- By year 4, paydown + projected appreciation supports a ~$32k cash-out refi (75% LTV) — recoverable capital for the next deal without selling this one.
Negotiation context
- It's been on market 88 days — a 6% lower offer ($216k) is reasonable based on typical stale-listing flexibility.
Questions for the listing agent
- It's been on market 88 days. Have you received any prior offers? Is the seller open to a 7% concession, seller financing, or rate buy-down credit?
- What does the HOA fee cover, when was the last increase, and are there any pending special assessments or reserve-fund shortfalls?
- Why hasn't it sold? Are there any deal-killer items the seller is aware of (foundation, flood, title, zoning, code violations)?
- Is there a deadline driving the sale (1031 exchange, divorce, estate, relocation)? That informs how much negotiation room exists.
- Schools are D-rated, which usually means shorter tenancies and higher turnover. Who's the typical renter profile here, and what's been the actual vacancy rate?
- Crime grade is F in this area — have there been break-ins, vandalism, or insurance claims at this property in the last 3 years? What carrier currently insures it and at what premium?
- What's the average days-on-market for RENTAL listings here right now (not sales)? A rising rental-DOM trend means longer vacancies and softer asking-rent achievability than the comps imply.
- What's the recent tenant-quality profile in this submarket — average credit score on applications, eviction rate, late-payment / NSF rate, and stable-employment percentage? A property-management company in the area should have these aggregated.
- How much new for-sale + rental construction is in the pipeline within 1–3 miles? Heavy new supply typically softens prices + rents 12–24 months out; constrained supply supports both.
Investment metrics
- 1% rule
- 0.93% ✗
- Cap rate
- 6.60%
- Cash-on-cash
- 1.11%
- DSCR
- 1.05
- GRM
- 9.0
CMA / ARV
- ARV (on-the-fly)
- $247,520
- Comps found
- 12
Show comp detail 12 sales within ~0.75 mi
| Address | Dist | Beds/Ba | Sqft | Sold | Price | $/sf | Match |
|---|---|---|---|---|---|---|---|
| 748 Striped Bass Ct | 0.11mi | 3/2.5 | 1,360 (0%) | 5mo | $265,900 | $196 | 91 |
| 904 Bream Cir | 0.06mi | 3/2.5 | 1,360 (0%) | 8mo | $281,000 | $207 | 91 |
| 612 Perch Ln | 0.02mi | 3/2.5 | 1,517 (+12%) | 3mo | $283,900 | $187 | 78 |
| 624 Perch Ln | 0.05mi | 4/2.0 (+1) | 1,482 (+9%) | 1mo | $262,900 | $177 | 75 |
| 701 Striped Bass Ct | 0.05mi | 3/2.0 | 1,183 (-13%) | 4mo | $249,900 | $211 | 70 |
| 908 Bream Cir | 0.06mi | 4/2.0 (+1) | 1,482 (+9%) | 8mo | $262,325 | $177 | 68 |
| 677 Perch Ln | 0.10mi | 3/2.5 | 1,517 (+12%) | 10mo | $269,850 | $178 | 68 |
| 740 Striped Bass Ct | 0.10mi | 4/2.0 (+1) | 1,482 (+9%) | 9mo | $269,850 | $182 | 66 |
| 681 Perch Ln | 0.11mi | 4/2.0 (+1) | 1,482 (+9%) | 9mo | $252,900 | $171 | 66 |
| 625 Perch Ln | 0.05mi | 3/2.0 | 1,183 (-13%) | 10mo | $242,850 | $205 | 66 |
| 657 Perch Ln | 0.10mi | 4/2.0 (+1) | 1,482 (+9%) | 10mo | $264,850 | $179 | 65 |
| 5 John Fothergill Cir | 0.37mi | 2/2.0 (-1) | 1,405 (+3%) | 10mo | $214,500 | $153 | 62 |
Match score weights: distance 35% · size 25% · config 20% · recency 20%. Top-matched comps best support the ARV.
Projected returns pro-forma
3.47% appreciation · 3.0% rent growth · sell at horizon
- IRR
- 9.9%
- Equity multiple
- 1.58×
- Total profit
- $37,377
- Equity at exit
- $109,605
- IRR
- 12.0%
- Equity multiple
- 2.88×
- Total profit
- $120,774
- Equity at exit
- $173,890
Cash invested: $64,400 (down + closing). Projections, not guarantees.
Landlord ↔ Tenant lean methodology
- Overall (STATE)
- 90 Strongly Landlord-Friendly
- State South Carolina
- 90 Strongly Landlord-Friendly · R+6
- County
- — inherits STATE
- City
- — inherits STATE
ZIP-level market 29142
- Home prices YoY
- 1.8%
- Active inventory
- 154
- Price-to-rent
- 9.0×
Monthly cashflow live
- Estimated rent
- $2,129 medium interval (Pro) →
- Mortgage (P&I)
- −$1,206
- Tax est. 1.5%
- −$288 /mo · $3,450/yr
- Insurance
- −$96
- HOA
- −$33
- Vacancy / Maint / Mgmt
- −$447
- Net cashflow
- $60
Break-even live
UW: 25.0% down · 7.5% · 30yr · 1.5% tax · 5.0% vac · 8.0% maint · 8.0% mgmt
Financing live
Cash to close
- Down payment
- $57,500
- Closing costs
- $6,900
- Reserves months
- —
- Total cash needed
- —
Loan-product check · same deal, 3 products live
Conventional
25% down · 7.5% · 30yr
- Down + closing
- —
- Monthly P&I
- —
- Monthly cashflow
- —
- DSCR
- —
- Eligible?
- —
Personal DTI + credit; lowest rate.
DSCR
20% down · 8.5% · 30yr
- Down + closing
- —
- Monthly P&I
- —
- Monthly cashflow
- —
- DSCR
- —
- Eligible?
- —
No personal income docs; deal must DSCR.
Hard money
10% down · 12.0% · 12mo
- Down + closing
- —
- Monthly P&I
- —
- Monthly cashflow
- —
- DSCR
- —
- Eligible?
- —
Short-term bridge; refi at stabilization.
Rent comps 3 comps
| Address | Beds | Baths | Sqft | Rent | $/sqft | DOM | Units | Dist |
|---|---|---|---|---|---|---|---|---|
| 764 Striped Bass Ct Santee, SC | 3.0 | 2.0 | 1183 | $2,000 | $1.69 | 23d | 1 | 0.16mi |
| 208 Trillium Ct Santee, SC | 3.0 | 3.0 | 1500 | $2,100 | $1.40 | 23d | 1 | 1.03mi |
| 127 Ballard Ln Santee, SC | 2.0 | 2.0 | 1300 | $2,999 | $2.31 | 23d | 1 | 1.15mi |
HOA detail
- Monthly dues
- $33 · $396/yr
- Likely covers
- water
Listing history 5 events
-
2026-05-19status Pending
-
2026-05-10price $230,000
-
2026-04-16price $276,900
-
2026-04-09price $279,000
-
2026-02-20$284,605 Active
ⓘ Source: listings_history table (triggers on properties + properties_extension) + one-shot
backfill from property_details.listing_events for pre-trigger history.
Nearby sold comps map
Loading sold comps map…
Walkable amenities ~0.75 mi
Loading nearby amenities…
Taxation est. · year 1
- Rental income
- $25,552
- − Mortgage interest
- −$12,884
- − Property taxes
- −$3,450
- − Insurance
- −$1,150
- − Repairs & maintenance
- −$2,044
- − Management
- −$2,044
- − HOA
- −$396
- − Depreciation
- −$6,691
- Taxable loss
- −$3,107
- Est. tax savings @ 24.0%
- +$746
- After-tax cash flow
- $1,462/yr
For passive investors: Depreciation is non-cash, so a rental often shows a tax loss while cash-flowing — sheltering income. Rental losses are passive: they offset passive income freely, and up to $25,000/yr can offset ordinary (W-2) income if you actively participate and your MAGI is under $100k (phasing out to $0 by $150k); unused losses carry forward. On sale, claimed depreciation is recaptured at up to 25%, and gains may owe capital-gains tax (a 1031 exchange can defer both). Figures are a year-1 estimate at your 24.0% rate — not tax advice; consult a CPA.
Schools (NCES district)
No district data.
Livability — Santee
- Score
- 61/100
- State rank
- #202
- US rank
- #17354
Category grades
Schools grade is shown separately in the Schools card above.
Census & demographics
- Census place
- Santee, SC
- Population (ZIP)
- 4,658
Population outlook (Orangeburg County) Hauer SSP2
- Today (2025)
- 82,698 people
- By 2030
- 78,615 · -4.9%
- By 2040
- 69,308 · -16.2%
- By 2050
- 60,629 · -26.7%
- By 2075
- 42,678 · -48.4%
- By 2100
- 28,136 · -66.0%
Race, ethnicity, and origin ACS 2023
- Neighborhood character
- Majority Black (64%)
- Race & ethnicity
- Black 64% White 31% Asian 3% Hispanic / Latino 2%
- Common ancestry
- Lithuanian 2% Romanian 2%
- Foreign-born
- 1%
- Languages at home
- 96% English-only · Other Indo-European 2% Spanish 1%
Political lean MEDSL · Orangeburg
- 2024 margin
- Strong D (+24.6) · D 61.8% · R 37.2% · Other 1.1%
- 2008→2024 swing
- -13.5pp toward R · 2008: 38.1pp · 2024: 24.6pp
- All cycles
- 2024: D+24.6 2020: D+33.2 2016: D+37.0 2012: D+43.5 2008: D+38.1
Not yet ingested
- Civics
- —
Market trends
- HPI YoY
- ▲ 3.47%
- Current HPI
- 193.5623
- Rent YoY
- —
- Metro
- —
- State GDP YoY
- ▲ 4.51%
- F500 in state
- 2
Industry mix (Fortune 500 HQ in SC)
| Industry | F500 HQs | Revenue |
|---|---|---|
| Packaging | 1 | $7B |
|
||
Price history
-19.2% since first listed5 events — show timeline
- 2026-05-19 Pending — Charleston Trident MLS
- 2026-05-10 Price Changed $230,000 Charleston Trident MLS
- 2026-04-16 Price Changed $276,900 Charleston Trident MLS
- 2026-04-09 Price Changed $279,000 Charleston Trident MLS
- 2026-02-20 Listed $284,605 Charleston Trident MLS
Cash-flow waterfall
monthlySold comps — $/sqft
last 12 mo · ≤1 miLoading sold comps…