 🏷️ Likely Rental
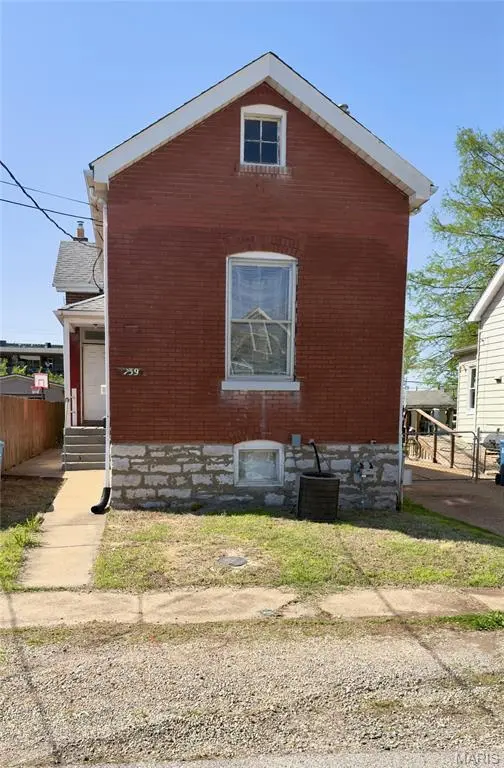
739 Regina Ave · Lemay, MO
Flood risk 1/10 · Minimal
- FEMA flood zone
- X (unshaded)
- Chance of flooding over 30 yrs
- 0.0%
- Est. flood insurance / yr
- $473 – $860
Fire risk 1/10 · Minimal
- Est. fire insurance / yr
- $1,054 – $1,958
Heat risk 5/10 · Moderate
- Hot days now (above 108°F)
- 7 days/yr
- Hot days in 30 yrs
- 21 days/yr
Wind risk 2/10 · Minimal
- Chance of severe wind over 30 yrs
- 1.0%
Air-quality risk 3/10 · Minor
- Unhealthy air days now
- 2 days/yr
- Unhealthy air days in 30 yrs
- 3 days/yr
Risk factors via First Street. Map © Google.
Why this score? — see what drove the B- grade
The composite is a weighted blend of 9 inputs, each scored 0–100. Each bar is that input's sub-score; the figure is the points it added to the 100-point composite (weight × sub-score).
- Cash flow +30.0/30.0
- 1% rule +10.0/10.0
- DSCR +10.0/10.0
- ARV discount +7.5/15.0
- Livability +3.4/5.0
- Schools +2.7/10.0
- Rent growth +2.5/5.0
- Condition / age +2.5/5.0
- Appreciation +0.0/10.0
$60,000
🖨 Deal sheet 📄 Offer letter ✓ Due diligence
Listing remarks MLS
Discover a solid investment opportunity in Hancock Place School District. This 1-bed, 1-bath bungalow offers 842 sq ft of main-level living, plus an unfinished basement for storage. A brand-new bathroom adds immediate value, while the rest of the home is ready for your vision. The property is being sold as-is, and the seller will not provide repairs, credits, or occupancy. Currently tenant-occupied with a reliable renter paying $700/month, giving buyers the option to keep the tenant or take possession after closing. Convenient off-street parking, level lot, and easy access to major routes make this a smart addition to any portfolio.
Key facts
- 3,023 sq ft lot
- Built 1907
- Listed 56 days
Neighborhood map
What this means for you Summary
Snapshot
- This is a 2-bed/1.0-bath single-family listed at $60k.
Deal economics
- At list price, monthly cash flow is $522 ($6k/yr) — positive.
- The deal already cash-flows at list — no discount required.
- Meets the 1% rule at list price ($1k rent vs $60k).
- Recommended offer: $58k (3.0% below list) — sets the bar for market timing.
- Cap rate 16.7% vs local median 5.3% in Lemay — top-decile yield for the area; either an underpriced asset or a hidden risk that comps aren't pricing in. Stress-test before assuming the spread holds.
Location & tenants
- Location reads 67/100 on livability (#213 in MO) — a middle-class / working-renter tenant base. Strengths: cost of living A+, housing A+; Watch: employment C-, health & safety C-, schools D+.
- Hancock Place (suburban): math 30% / reading 34% proficiency, ranked #251 of 324 in MO (top 78%) — families likely to look elsewhere, expect single-tenant / working-renter base with shorter leases.
- Market conditions: 146 active listings in the ZIP; 26 comparable units currently listed for rent nearby; rentals at typical pace (median 15d on market — plan ~3-4 weeks tenant-placement turnaround); 920 units permitted in St. Louis County in 2024 (250 in 5+ unit buildings).
Forward outlook
- Local home prices are declining (-3.0%/yr); year-one equity from $415 of loan paydown is wiped out by about $2k of value loss. Plan a longer hold.
- At projected returns (-3.0% appreciation + 3.0% rent growth), your $17k cash investment doubles in ~4 years — after that, you're playing with house money.
Negotiation context
- It's been on market 57 days — a 3% lower offer ($58k) is reasonable based on typical stale-listing flexibility.
Risks & watch-outs
- Watch-outs: built in 1907 — expect roof / HVAC / electrical / plumbing capex.
- Climate carrying-cost: extreme-heat days projected 7→21/yr by 2055 (HVAC capex compounding) — expect insurance premiums to compound above CPI over the hold.
Questions for the listing agent
- It's been on market 57 days. Have you received any prior offers? Is the seller open to a 3% concession, seller financing, or rate buy-down credit?
- Built in 1907 — when were the roof, HVAC, electrical panel, plumbing, and water heater last replaced?
- Is there a deadline driving the sale (1031 exchange, divorce, estate, relocation)? That informs how much negotiation room exists.
- Schools are D-rated, which usually means shorter tenancies and higher turnover. Who's the typical renter profile here, and what's been the actual vacancy rate?
- Crime grade is F in this area — have there been break-ins, vandalism, or insurance claims at this property in the last 3 years? What carrier currently insures it and at what premium?
- What's the average days-on-market for RENTAL listings here right now (not sales)? A rising rental-DOM trend means longer vacancies and softer asking-rent achievability than the comps imply.
- What's the recent tenant-quality profile in this submarket — average credit score on applications, eviction rate, late-payment / NSF rate, and stable-employment percentage? A property-management company in the area should have these aggregated.
- How much new for-sale + rental construction is in the pipeline within 1–3 miles? Heavy new supply typically softens prices + rents 12–24 months out; constrained supply supports both.
Investment metrics
- 1% rule
- 2.02% ✓
- Cap rate
- 16.73%
- Cash-on-cash
- 37.28%
- DSCR
- 2.66
- GRM
- 4.1
CMA / ARV
- ARV (median comp)
- $128,112
- List price
- $60,000
- Delta
- -53.17%
- Verdict
- UNDERPRICED
- Comps
- 20 within 1.0 mi
Show comp detail 12 sales within ~0.75 mi
| Address | Dist | Beds/Ba | Sqft | Sold | Price | $/sf | Match |
|---|---|---|---|---|---|---|---|
| 816 Regina Ave | 0.19mi | 2/1.0 | 798 (-5%) | 2mo | $200,000 | $251 | 80 |
| 712 Orient Ave | 0.26mi | 2/1.0 | 900 (+7%) | 4mo | $152,500 | $169 | 73 |
| 939 Erskine Ave | 0.36mi | 2/1.0 | 894 (+6%) | 3mo | $155,000 | $173 | 71 |
| 246 Wachtel Ave | 0.37mi | 2/1.0 | 891 (+6%) | 4mo | $100,000 | $112 | 70 |
| 1036 Wachtel Ave | 0.46mi | 3/1.0 (+1) | 888 (+6%) | 2mo | $174,900 | $197 | 63 |
| 121 Mann St | 0.56mi | 2/2.0 | 816 (-3%) | 4mo | $119,900 | $147 | 62 |
| 8626 Shoss Ave | 0.48mi | 2/1.0 | 912 (+8%) | 3mo | $95,000 | $104 | 61 |
| 111 W Loretta Ave | 0.75mi | 2/1.0 | 845 (+0%) | 6mo | $79,900 | $95 | 60 |
| 300 Kayser Ave | 0.33mi | 3/1.0 (+1) | 916 (+9%) | 7mo | $179,900 | $196 | 59 |
| 9604 Gentry Ave | 0.56mi | 2/1.0 | 916 (+9%) | 2mo | $69,900 | $76 | 58 |
| 320 Degenhardt Ave | 0.53mi | 1/1.0 (-1) | 806 (-4%) | 7mo | $125,000 | $155 | 57 |
| 1402 Dammert Ave | 0.64mi | 3/1.0 (+1) | 912 (+8%) | 1mo | $209,900 | $230 | 50 |
Match score weights: distance 35% · size 25% · config 20% · recency 20%. Top-matched comps best support the ARV.
Projected returns pro-forma
-3.0% appreciation · 3.0% rent growth · sell at horizon
- IRR
- 33.2%
- Equity multiple
- 2.40×
- Total profit
- $23,550
- Equity at exit
- $8,946
- IRR
- 40.2%
- Equity multiple
- 4.78×
- Total profit
- $63,435
- Equity at exit
- $5,188
Cash invested: $16,800 (down + closing). Projections, not guarantees.
Landlord ↔ Tenant lean methodology
- Overall (STATE)
- 81 Strongly Landlord-Friendly
- State Missouri
- 81 Strongly Landlord-Friendly · R+10
- County
- — inherits STATE
- City
- — inherits STATE
ZIP-level market 63125
- Active inventory
- 146
- Price-to-rent
- 4.1×
Monthly cashflow live
- Estimated rent
- $1,210 high interval (Pro) →
- Mortgage (P&I)
- −$315
- Tax from tax record
- −$94 /mo · $1,130/yr
- Insurance
- −$25
- HOA
- −$0
- Vacancy / Maint / Mgmt
- −$254
- Net cashflow
- $522
Break-even live
UW: 25.0% down · 7.5% · 30yr · 1.5% tax · 5.0% vac · 8.0% maint · 8.0% mgmt
Financing live
Cash to close
- Down payment
- $15,000
- Closing costs
- $1,800
- Reserves months
- —
- Total cash needed
- —
Loan-product check · same deal, 3 products live
Conventional
25% down · 7.5% · 30yr
- Down + closing
- —
- Monthly P&I
- —
- Monthly cashflow
- —
- DSCR
- —
- Eligible?
- —
Personal DTI + credit; lowest rate.
DSCR
20% down · 8.5% · 30yr
- Down + closing
- —
- Monthly P&I
- —
- Monthly cashflow
- —
- DSCR
- —
- Eligible?
- —
No personal income docs; deal must DSCR.
Hard money
10% down · 12.0% · 12mo
- Down + closing
- —
- Monthly P&I
- —
- Monthly cashflow
- —
- DSCR
- —
- Eligible?
- —
Short-term bridge; refi at stabilization.
Rent comps 26 comps
| Address | Beds | Baths | Sqft | Rent | $/sqft | DOM | Units | Dist |
|---|---|---|---|---|---|---|---|---|
| 709 Dammert Ave Unit Labs St. Louis, MO | 2.0 | 1.5 | 800 | $1,100 | $1.38 | 44d | 1 | 0.19mi |
| 304 Bayless Ave Saint Louis, MO | 3.0 | 1.0 | 1104 | $1,950 | $1.77 | 2d | 1 | 0.30mi |
| 207 Waller Ave Saint Louis, MO | 2.0 | 1.0 | 900 | $1,075 | $1.19 | 24d | 1 | 0.40mi |
| 152 W Etta Ave Saint Louis, MO | 2.0 | 1.0 | 936 | $1,274 | $1.36 | 7d | 1 | 0.58mi |
| 8511 Idaho Ave Unit 1st Floor St. Louis, MO | 1.0 | 1.0 | 750 | $850 | $1.13 | 12d | 1 | 0.65mi |
| 127 E Holden Ave Saint Louis, MO | 2.0 | 1.0 | 1044 | $1,200 | $1.15 | 44d | 1 | 0.75mi |
| 4236 Fatima Dr Apt 4 St. Louis, MO | 1.0 | 1.0 | 800 | $925 | $1.16 | 10d | 1 | 0.89mi |
| 8125 Michigan Ave St. Louis, MO | 1.0–2.0 | 1.0–2.0 | 797 | $1,150 | $1.44 | 14d | 1 | 0.96mi |
| 7851 Bandero Dr Saint Louis, MO | 1.0–2.0 | 1.0 | 800 | $1,100 | $1.38 | 12d | 1 | 1.07mi |
| 3945 Crosby Dr Saint Louis, MO | 2.0 | 1.0 | 1100 | $2,083 | $1.89 | 2d | 1 | 1.12mi |
| 9954 Meadow Ave Saint Louis, MO | 2.0 | 1.0 | 1100 | $1,050 | $0.95 | 4d | 1 | 1.15mi |
| 812 Schirmer St Saint Louis, MO | 1.0 | 1.0 | 900 | $795 | $0.88 | 44d | 1 | 1.15mi |
| 813 W Courtois St Apt C St. Louis, MO | 2.0 | 1.0 | 1000 | $895 | $0.90 | 44d | 1 | 1.16mi |
| 807 W Courtois St Apt B St. Louis, MO | 1.0 | 1.0 | 600 | $735 | $1.23 | 44d | 1 | 1.16mi |
| 815 W Courtois St St. Louis, MO | 1.0 | 1.0 | 900 | $795 | $0.88 | 14d | 1 | 1.16mi |
| 807 W Courtois St Apt D St. Louis, MO | 2.0 | 1.0 | 900 | $925 | $1.03 | 44d | 1 | 1.16mi |
| 9964 Meadow Ave Saint Louis, MO | 1.0 | 1.0 | 950 | $775 | $0.82 | 7d | 1 | 1.18mi |
| 7614 Virginia Ave Unit 7614 St. Louis, MO | 2.0 | 1.0 | 750 | $750 | $1.00 | 24d | 1 | 1.25mi |
| 7417 Vermont Ave Unit 103 St. Louis, MO | 2.0 | 2.0 | 1069 | $1,500 | $1.40 | 14d | 1 | 1.36mi |
| 7417 Vermont Ave St. Louis, MO | 1.0–2.0 | 1.0–2.0 | 1144 | $1,600 | $1.40 | 2d | 8 | 1.37mi |
| 4101 Germania Ave Apt 1A St. Louis, MO | 1.0 | 1.0 | 800 | $925 | $1.16 | 14d | 1 | 1.41mi |
| 125 Koeln Ave Saint Louis, MO | 2.0 | 1.0 | 833 | $1,499 | $1.80 | 44d | 1 | 1.43mi |
| 4117 Germania St Saint Louis, MO | 1.0 | 1.0 | 750 | $925 | $1.23 | 44d | 1 | 1.43mi |
| 7320 Vermont Ave Unit 2nd St. Louis, MO | 1.0 | 1.0 | 710 | $750 | $1.06 | 44d | 1 | 1.45mi |
| 7500 Morganford Rd Saint Louis, MO | 1.0 | 1.0 | 750 | $925 | $1.23 | 44d | 1 | 1.48mi |
| 274 Kingston Dr St. Louis, MO | 2.0 | 1.0 | 522 | $1,149 | $2.20 | 2d | 4 | 1.50mi |
Listing history 18 events
-
2026-06-18days on market $60,000 Active 57 DOM
-
2026-06-17days on market $60,000 Active 56 DOM
-
2026-06-16days on market $60,000 Active 55 DOM
-
2026-06-15days on market $60,000 Active 54 DOM
-
2026-06-13days on market $60,000 Active 52 DOM
-
2026-06-13days on market $60,000 Active 51 DOM
-
2026-06-09days on market $60,000 Active 48 DOM
-
2026-06-08days on market $60,000 Active 47 DOM
-
2026-06-07days on market $60,000 Active 46 DOM
-
2026-06-03days on market $60,000 Active 42 DOM
-
2026-06-02days on market $60,000 Active 41 DOM
-
2026-06-02price $60,000 Active 40 DOM
-
2026-06-01days on market $65,000 Active 40 DOM
-
2026-05-31days on market $65,000 Active 39 DOM
-
2026-05-13price $65,000 640-char remark
Show marketing remark (640 chars)
Discover a solid investment opportunity in Hancock Place School District. This 1-bed, 1-bath bungalow offers 842 sq ft of main-level living, plus an unfinished basement for storage. A brand-new bathroom adds immediate value, while the rest of the home is ready for your vision. The property is being sold as-is, and the seller will not provide repairs, credits, or occupancy. Currently tenant-occupied with a reliable renter paying $700/month, giving buyers the option to keep the tenant or take possession after closing. Convenient off-street parking, level lot, and easy access to major routes make this a smart addition to any portfolio.
-
2026-04-23$70,000 Active 640-char remark
Show marketing remark (640 chars)
Discover a solid investment opportunity in Hancock Place School District. This 1-bed, 1-bath bungalow offers 842 sq ft of main-level living, plus an unfinished basement for storage. A brand-new bathroom adds immediate value, while the rest of the home is ready for your vision. The property is being sold as-is, and the seller will not provide repairs, credits, or occupancy. Currently tenant-occupied with a reliable renter paying $700/month, giving buyers the option to keep the tenant or take possession after closing. Convenient off-street parking, level lot, and easy access to major routes make this a smart addition to any portfolio.
-
2026-04-22historical $70,000 640-char remark
Show marketing remark (640 chars)
Discover a solid investment opportunity in Hancock Place School District. This 1-bed, 1-bath bungalow offers 842 sq ft of main-level living, plus an unfinished basement for storage. A brand-new bathroom adds immediate value, while the rest of the home is ready for your vision. The property is being sold as-is, and the seller will not provide repairs, credits, or occupancy. Currently tenant-occupied with a reliable renter paying $700/month, giving buyers the option to keep the tenant or take possession after closing. Convenient off-street parking, level lot, and easy access to major routes make this a smart addition to any portfolio.
-
2007-04-05soldstatus $60,000
ⓘ Source: listings_history table (triggers on properties + properties_extension) + one-shot
backfill from property_details.listing_events for pre-trigger history.
Tax reassessment forecast MO · Resets to sale price
- Current annual tax
- $1,130 · $94/mo
- Projected year-2 tax
- $1,130 · $94/mo
- Expected delta
- $0/yr ($0/mo · 0.0%)
ⓘ Screening estimate from a state-policy table — verify with the county assessor before closing.
Climate risk First Street
- Flood 1/10 Low FEMA zone X (unshaded) · 0% chance over 30 yrs
- Wildfire 1/10 Low
- Heat 5/10 Major 7 d/yr ≥108°F today · 21 d/yr by 30 yrs out
- Wind 2/10 Low 100% chance of damaging wind over 30 yrs
- Air quality 3/10 Moderate 2 unhealthy d/yr today · 3 by 30 yrs out
Nearby sold comps map
Loading sold comps map…
Walkable amenities ~0.75 mi
Loading nearby amenities…
Taxation est. · year 1
- Rental income
- $14,518
- − Mortgage interest
- −$3,361
- − Property taxes
- −$1,130
- − Insurance
- −$300
- − Repairs & maintenance
- −$1,161
- − Management
- −$1,161
- − Depreciation
- −$1,745
- Taxable income
- $5,659
- Est. tax owed @ 24.0%
- −$1,358
- After-tax cash flow
- $4,905/yr
For passive investors: Depreciation is non-cash, so a rental often shows a tax loss while cash-flowing — sheltering income. Rental losses are passive: they offset passive income freely, and up to $25,000/yr can offset ordinary (W-2) income if you actively participate and your MAGI is under $100k (phasing out to $0 by $150k); unused losses carry forward. On sale, claimed depreciation is recaptured at up to 25%, and gains may owe capital-gains tax (a 1031 exchange can defer both). Figures are a year-1 estimate at your 24.0% rate — not tax advice; consult a CPA.
Schools (NCES district)
- District
- Hancock Place
- NCES district ID
- 2913620
- Math proficiency
- 30% ▼ -16.00%
- Reading proficiency
- 34% ▼ -11.00%
- Median HH income
- $41,890
- Composite
- 27.08/100
- National rank
- #7048
- State rank
- #251 of 324 in MO
Livability — Lemay
- Score
- 67/100
- State rank
- #213
- US rank
- #10652
Category grades
Schools grade is shown separately in the Schools card above.
Census & demographics
- Census place
- Lemay, MO
- County
- Saint Louis County · 888,823 people
- City population
- 33,294
- Metro
- St. Louis, MO-IL
- Population (ZIP)
- 33,294
- Household income
- $61,624
- Rent vs Own
- Severe rent burden
- 631.0
Population outlook (St. Louis County) Hauer SSP2
- Today (2025)
- 1,025,227 people
- By 2030
- 1,028,023 · +0.3%
- By 2040
- 1,020,940 · -0.4%
- By 2050
- 1,007,280 · -1.8%
- By 2075
- 987,277 · -3.7%
- By 2100
- 921,984 · -10.1%
Race, ethnicity, and origin ACS 2023
- Neighborhood character
- Predominantly White (86%)
- Race & ethnicity
- White 86% Two or more races 5% Black 4% Hispanic / Latino 4% Asian 2%
- Common ancestry
- American 9% Romanian 3% Lithuanian 3%
- Foreign-born
- 14% · Canada, Vietnam
- Languages at home
- 83% English-only · Russian/Polish/Slavic 11% Spanish 3% Vietnamese 1%
Political lean MEDSL · St. Louis
- 2024 margin
- Strong D (+23.4) · D 60.8% · R 37.4% · Other 1.7%
- 2008→2024 swing
- +3.5pp toward D · 2008: 19.9pp · 2024: 23.4pp
- All cycles
- 2024: D+23.4 2020: D+24.0 2016: D+16.2 2012: D+13.7 2008: D+19.9
Not yet ingested
- Civics
- —
Market trends
- HPI YoY
- ▼ -173.27%
- Current HPI
- 234.3792
- Rent YoY
- —
- Metro
- St. Louis, MO-IL
- State GDP YoY
- ▲ 1.84%
- F500 in state
- 20
Industry mix (Fortune 500 HQ in MO)
| Industry | F500 HQs | Revenue |
|---|---|---|
| Healthcare | 1 | $163B |
|
||
| Insurance | 1 | $21B |
|
||
| Industrial Technology | 1 | $17B |
|
||
| Retail | 1 | $16B |
|
||
| Industrial Distribution | 1 | $10B |
|
||
| Utilities | 1 | $9B |
|
||
Price history
+8.3% since first listed4 events — show timeline
- 2026-05-13 Price Changed $65,000 MARIS as Distributed by MLS Grid
- 2026-04-23 Listed $70,000 MARIS as Distributed by MLS Grid
- 2026-04-22 Coming Soon $70,000 MARIS as Distributed by MLS Grid
- 2007-04-05 Sold (Public Records) $60,000 Public Records
Property tax history
+3.9%/yrLatest (2022): $1,130 · +1.7% YoY. Source: county tax records.
Cash-flow waterfall
monthlySold comps — $/sqft
last 12 mo · ≤1 miLoading sold comps…