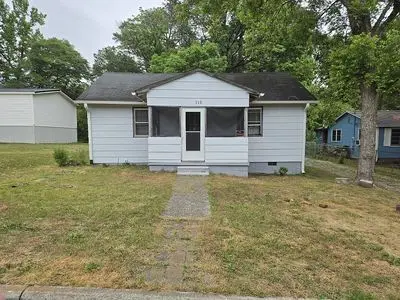
115 Brook Ave · Rockingham, NC
Flood risk 1/10 · Minimal
- FEMA flood zone
- X (unshaded)
- Chance of flooding over 30 yrs
- 0.0%
- Est. flood insurance / yr
- $507 – $1,088
Fire risk 4/10 · Minor
- Est. fire insurance / yr
- $906 – $1,684
Heat risk 7/10 · Major
- Hot days now (above 108°F)
- 7 days/yr
- Hot days in 30 yrs
- 16 days/yr
Wind risk 6/10 · Moderate
- Chance of severe wind over 30 yrs
- 64.0%
Air-quality risk 1/10 · Minimal
- Unhealthy air days now
- 0 days/yr
- Unhealthy air days in 30 yrs
- 0 days/yr
Risk factors via First Street. Map © Google.
Why this score? — see what drove the C grade
The composite is a weighted blend of 9 inputs, each scored 0–100. Each bar is that input's sub-score; the figure is the points it added to the 100-point composite (weight × sub-score).
- Cash flow +25.7/30.0
- DSCR +8.6/10.0
- ARV discount +7.5/15.0
- 1% rule +5.5/10.0
- Livability +3.2/5.0
- Schools +2.7/10.0
- Rent growth +2.5/5.0
- Condition / age +2.5/5.0
- Appreciation +0.0/10.0
$145,000
🖨 Deal sheet 📄 Offer letter ✓ Due diligence
Listing remarks MLS
This charming 3-bedroom, 1-bathroom single-family home is a fantastic opportunity for investors looking to expand their portfolio. With a spacious layout, this home is ready for rental or renovation for potential resale. Located minutes from downtown Rockingham with strong rental demand, this property presents a high-potential return on investment.
Key facts
- Fresh updates
- Off-street parking
- Gravel driveway
Tags
Neighborhood map
What this means for you Summary
Snapshot
- This is a 3-bed/1.0-bath single-family listed at $145k.
Deal economics
- At list price, monthly cash flow is $349 ($4k/yr) — positive.
- The deal already cash-flows at list — no discount required.
- Meets the 1% rule at list price ($2k rent vs $145k).
- Cap rate 9.2% vs local median 6.0% in Rockingham — top-decile yield for the area; either an underpriced asset or a hidden risk that comps aren't pricing in. Stress-test before assuming the spread holds.
Location & tenants
- Location reads 63/100 on livability (#403 in NC) — a middle-class / working-renter tenant base. Strengths: cost of living A+, housing A, health & safety B+; Watch: schools D-, crime F, amenities F.
- Richmond County Schools (town): math 30% / reading 36% proficiency, ranked #139 of 178 in NC (top 78%) — families likely to look elsewhere, expect single-tenant / working-renter base with shorter leases; 70% free/reduced lunch — lower-income household profile, screen leases tightly.
- Market conditions: 155 active listings in the ZIP; 54 units permitted in Richmond County in 2024 (0 in 5+ unit buildings).
Forward outlook
- Local home prices are declining (-3.0%/yr); year-one equity from $1k of loan paydown is wiped out by about $4k of value loss. Plan a longer hold.
- Richmond County population projected at -22% by 2050 — secular population decline; favor cash flow + early exit over multi-decade hold.
Negotiation context
- Only 9 days on market — expect competitive offers; lowballing is unlikely to land.
- 3 sale attempts since 2y ago with the ask held roughly flat each time — persistent listings suggest the price (not the market) is what's stuck; bring a comps-based counter.
- Current owner paid $35k; list at $145k implies a 314% gain — meaningful room to come down on a strong offer.
Risks & watch-outs
- Climate carrying-cost: major wind risk, 64% chance of damaging wind over 30y; extreme-heat days projected 7→16/yr by 2055 (HVAC capex compounding) — expect insurance premiums to compound above CPI over the hold.
Questions for the listing agent
- Built in 1960 — when were the roof, HVAC, electrical panel, plumbing, and water heater last replaced?
- Is there a deadline driving the sale (1031 exchange, divorce, estate, relocation)? That informs how much negotiation room exists.
- Schools are D-rated, which usually means shorter tenancies and higher turnover. Who's the typical renter profile here, and what's been the actual vacancy rate?
- Crime grade is F in this area — have there been break-ins, vandalism, or insurance claims at this property in the last 3 years? What carrier currently insures it and at what premium?
- What's the average days-on-market for RENTAL listings here right now (not sales)? A rising rental-DOM trend means longer vacancies and softer asking-rent achievability than the comps imply.
- What's the recent tenant-quality profile in this submarket — average credit score on applications, eviction rate, late-payment / NSF rate, and stable-employment percentage? A property-management company in the area should have these aggregated.
- How much new for-sale + rental construction is in the pipeline within 1–3 miles? Heavy new supply typically softens prices + rents 12–24 months out; constrained supply supports both.
Investment metrics
- 1% rule
- 1.05% ✓
- Cap rate
- 9.18%
- Cash-on-cash
- 10.31%
- DSCR
- 1.46
- GRM
- 7.9
CMA / ARV
- ARV (on-the-fly)
- $57,120
- Comps found
- 5
Show comp detail 5 sales within ~0.75 mi
| Address | Dist | Beds/Ba | Sqft | Sold | Price | $/sf | Match |
|---|---|---|---|---|---|---|---|
| 203 S Brookwood Ave | 0.13mi | 2/1.0 (-1) | 1,060 (+4%) | 4mo | $30,000 | $28 | 79 |
| 417 Louise Ave | 0.54mi | 3/1.0 | 1,020 (0%) | 1mo | $180,000 | $176 | 74 |
| 1107 Armstead St | 0.37mi | 2/1.0 (-1) | 984 (-4%) | 5mo | $22,000 | $22 | 68 |
| 1506 E Washington St | 0.06mi | 2/1.0 (-1) | 1,080 (+6%) | 23mo | $60,500 | $56 | 63 |
| 117 Zion St | 0.42mi | 2/2.0 (-1) | 1,056 (+4%) | 12mo | $76,000 | $72 | 55 |
Match score weights: distance 35% · size 25% · config 20% · recency 20%. Top-matched comps best support the ARV.
Projected returns pro-forma
-3.0% appreciation · 3.0% rent growth · sell at horizon
- IRR
- -0.9%
- Equity multiple
- 0.97×
- Total profit
- $-1,345
- Equity at exit
- $21,620
- IRR
- 8.8%
- Equity multiple
- 1.67×
- Total profit
- $27,171
- Equity at exit
- $12,537
Cash invested: $40,600 (down + closing). Projections, not guarantees.
Landlord ↔ Tenant lean methodology
- Overall (STATE)
- 85 Strongly Landlord-Friendly
- State North Carolina
- 85 Strongly Landlord-Friendly · R+3
- County
- — inherits STATE
- City
- — inherits STATE
ZIP-level market 28379
- Home prices YoY
- -32.4%
- Active inventory
- 155
- Price-to-rent
- 7.9×
Monthly cashflow live
- Estimated rent
- $1,528 medium interval (Pro) →
- Mortgage (P&I)
- −$760
- Tax from tax record
- −$37 /mo · $448/yr
- Insurance
- −$60
- HOA
- −$0
- Vacancy / Maint / Mgmt
- −$321
- Net cashflow
- $349
Break-even live
UW: 25.0% down · 7.5% · 30yr · 1.5% tax · 5.0% vac · 8.0% maint · 8.0% mgmt
Financing live
Cash to close
- Down payment
- $36,250
- Closing costs
- $4,350
- Reserves months
- —
- Total cash needed
- —
Loan-product check · same deal, 3 products live
Conventional
25% down · 7.5% · 30yr
- Down + closing
- —
- Monthly P&I
- —
- Monthly cashflow
- —
- DSCR
- —
- Eligible?
- —
Personal DTI + credit; lowest rate.
DSCR
20% down · 8.5% · 30yr
- Down + closing
- —
- Monthly P&I
- —
- Monthly cashflow
- —
- DSCR
- —
- Eligible?
- —
No personal income docs; deal must DSCR.
Hard money
10% down · 12.0% · 12mo
- Down + closing
- —
- Monthly P&I
- —
- Monthly cashflow
- —
- DSCR
- —
- Eligible?
- —
Short-term bridge; refi at stabilization.
Listing history 25 events
-
2026-06-19days on market $145,000 Active 9 DOM
-
2026-06-18days on market $145,000 Active 8 DOM
-
2026-06-17days on market $145,000 Active 7 DOM
-
2026-06-16days on market $145,000 Active 6 DOM
-
2026-06-15days on market $145,000 Active 5 DOM
-
2026-06-14days on market $145,000 Active 3 DOM
-
2026-06-13remarks 412-char remark
-
2026-06-13pricedays on market $145,000 Active 2 DOM
-
2026-06-10days on market $150,000 Active 22 DOM
-
2026-06-09days on market $150,000 Active 21 DOM
-
2026-06-08days on market $150,000 Active 20 DOM
-
2026-06-07days on market $150,000 Active 19 DOM
-
2026-06-05days on market $150,000 Active 16 DOM
-
2026-06-03days on market $150,000 Active 15 DOM
-
2026-06-02days on market $150,000 Active 14 DOM
-
2026-06-01days on market $150,000 Active 13 DOM
-
2026-05-31days on market $150,000 Active 12 DOM
-
2026-05-30days on market $150,000 Active 11 DOM
-
2026-05-20$150,000 Active
-
2025-03-19soldstatus $35,000 Closed 350-char remark
Show marketing remark (350 chars)
This charming 3-bedroom, 1-bathroom single-family home is a fantastic opportunity for investors looking to expand their portfolio. With a spacious layout, this home is ready for rental or renovation for potential resale. Located minutes from downtown Rockingham with strong rental demand, this property presents a high-potential return on investment.
-
2025-03-18status Pending 350-char remark
Show marketing remark (350 chars)
This charming 3-bedroom, 1-bathroom single-family home is a fantastic opportunity for investors looking to expand their portfolio. With a spacious layout, this home is ready for rental or renovation for potential resale. Located minutes from downtown Rockingham with strong rental demand, this property presents a high-potential return on investment.
-
2025-03-07price $35,000 350-char remark
Show marketing remark (350 chars)
This charming 3-bedroom, 1-bathroom single-family home is a fantastic opportunity for investors looking to expand their portfolio. With a spacious layout, this home is ready for rental or renovation for potential resale. Located minutes from downtown Rockingham with strong rental demand, this property presents a high-potential return on investment.
-
2025-03-07status Active 350-char remark
Show marketing remark (350 chars)
This charming 3-bedroom, 1-bathroom single-family home is a fantastic opportunity for investors looking to expand their portfolio. With a spacious layout, this home is ready for rental or renovation for potential resale. Located minutes from downtown Rockingham with strong rental demand, this property presents a high-potential return on investment.
-
2025-01-17price $38,000 350-char remark
Show marketing remark (350 chars)
This charming 3-bedroom, 1-bathroom single-family home is a fantastic opportunity for investors looking to expand their portfolio. With a spacious layout, this home is ready for rental or renovation for potential resale. Located minutes from downtown Rockingham with strong rental demand, this property presents a high-potential return on investment.
-
2024-11-15$40,000 Active 350-char remark
Show marketing remark (350 chars)
This charming 3-bedroom, 1-bathroom single-family home is a fantastic opportunity for investors looking to expand their portfolio. With a spacious layout, this home is ready for rental or renovation for potential resale. Located minutes from downtown Rockingham with strong rental demand, this property presents a high-potential return on investment.
ⓘ Source: listings_history table (triggers on properties + properties_extension) + one-shot
backfill from property_details.listing_events for pre-trigger history.
Tax reassessment forecast NC · Resets to sale price
- Current annual tax
- $448 · $37/mo
- Projected year-2 tax
- $1,189 · $99/mo
- Expected delta
- +$741/yr (+$62/mo · 165.5%)
ⓘ Screening estimate from a state-policy table — verify with the county assessor before closing.
Climate risk First Street
- Flood 1/10 Low FEMA zone X (unshaded) · 0% chance over 30 yrs
- Wildfire 4/10 Moderate
- Heat 7/10 Severe 7 d/yr ≥108°F today · 16 d/yr by 30 yrs out
- Wind 6/10 Major 64% chance of damaging wind over 30 yrs
- Air quality 1/10 Low 0 unhealthy d/yr today · 0 by 30 yrs out
Nearby sold comps map
Loading sold comps map…
Walkable amenities ~0.75 mi
Loading nearby amenities…
Taxation est. · year 1
- Rental income
- $18,334
- − Mortgage interest
- −$8,122
- − Property taxes
- −$448
- − Insurance
- −$725
- − Repairs & maintenance
- −$1,467
- − Management
- −$1,467
- − Depreciation
- −$4,218
- Taxable income
- $1,887
- Est. tax owed @ 24.0%
- −$453
- After-tax cash flow
- $3,733/yr
For passive investors: Depreciation is non-cash, so a rental often shows a tax loss while cash-flowing — sheltering income. Rental losses are passive: they offset passive income freely, and up to $25,000/yr can offset ordinary (W-2) income if you actively participate and your MAGI is under $100k (phasing out to $0 by $150k); unused losses carry forward. On sale, claimed depreciation is recaptured at up to 25%, and gains may owe capital-gains tax (a 1031 exchange can defer both). Figures are a year-1 estimate at your 24.0% rate — not tax advice; consult a CPA.
Schools (NCES district)
- District
- Richmond County Schools
- NCES district ID
- 3703870
- Math proficiency
- 30% ▼ -12.00%
- Reading proficiency
- 36% ▼ -3.00%
- Median HH income
- $32,224
- Composite
- 26.97/100
- National rank
- #7076
- State rank
- #139 of 178 in NC
Livability — Rockingham
- Score
- 63/100
- State rank
- #403
- US rank
- #15356
Category grades
Schools grade is shown separately in the Schools card above.
Census & demographics
- Census place
- Rockingham, NC
- City population
- 24,068
- Population (ZIP)
- 24,068
Population outlook (Richmond County) Hauer SSP2
- Today (2025)
- 42,892 people
- By 2030
- 41,257 · -3.8%
- By 2040
- 37,629 · -12.3%
- By 2050
- 33,655 · -21.5%
- By 2075
- 23,992 · -44.1%
- By 2100
- 14,782 · -65.5%
Race, ethnicity, and origin ACS 2023
- Neighborhood character
- Diverse neighborhood (Simpson 0.58)
- Race & ethnicity
- White 56% Black 32% Hispanic / Latino 8% Two or more races 4% Asian 1%
- Hispanic origin (detail)
- Mexican 6%
- Common ancestry
- Serbian 2% Slovak 2% Lithuanian 1%
- Foreign-born
- 4% · Canada, Jamaica
- Languages at home
- 91% English-only · Spanish 7%
Political lean MEDSL · Richmond
- 2024 margin
- Strong R (+20.9) · D 39.2% · R 60.1%
- 2008→2024 swing
- -22.4pp toward R · 2008: 1.5pp · 2024: -20.9pp
- All cycles
- 2024: R+20.9 2020: R+14.8 2016: R+10.1 2012: D+2.7 2008: D+1.5
Not yet ingested
- Civics
- —
Market trends
- HPI YoY
- ▼ -97.10%
- Current HPI
- 203.0628
- Rent YoY
- —
- Metro
- —
- State GDP YoY
- ▲ 3.28%
- F500 in state
- 26
Industry mix (Fortune 500 HQ in NC)
| Industry | F500 HQs | Revenue |
|---|---|---|
| Financial Services | 2 | $213B |
|
||
| Retail | 2 | $95B |
|
||
| Industrial Conglomerate | 1 | $38B |
|
||
| Metals / Steel | 1 | $35B |
|
||
| Utilities | 1 | $30B |
|
||
| Industrial Machinery | 1 | $19B |
|
||
Price history
+275.0% since first listed7 events — show timeline
- 2026-05-20 Listed $150,000 FSBO.com
- 2025-03-19 Sold (MLS) $35,000 CANOPYMLS as Distributed by MLS Grid
- 2025-03-18 Pending — CANOPYMLS as Distributed by MLS Grid
- 2025-03-07 Price Changed $35,000 CANOPYMLS as Distributed by MLS Grid
- 2025-03-07 Relisted — CANOPYMLS as Distributed by MLS Grid
- 2025-01-17 Price Changed $38,000 CANOPYMLS as Distributed by MLS Grid
- 2024-11-15 Listed $40,000 CANOPYMLS as Distributed by MLS Grid
Property tax history
+0.9%/yrLatest (2025): $448 · -1.9% YoY. Source: county tax records.
Cash-flow waterfall
monthlySold comps — $/sqft
last 12 mo · ≤1 miLoading sold comps…