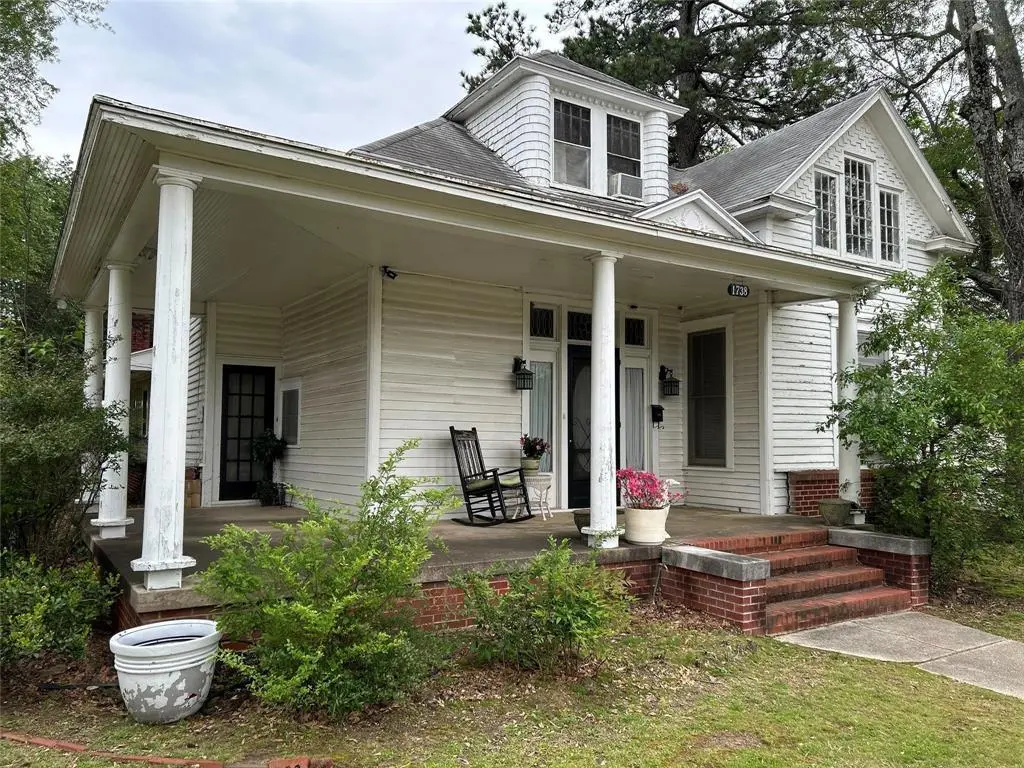
1738 Lamar Ave · Paris, TX
Flood risk 1/10 · Minimal
- FEMA flood zone
- X (unshaded)
- Chance of flooding over 30 yrs
- 0.0%
- Est. flood insurance / yr
- $507 – $1,088
Fire risk 6/10 · Moderate
- Est. fire insurance / yr
- $1,222 – $2,270
Heat risk 7/10 · Major
- Hot days now (above 110°F)
- 7 days/yr
- Hot days in 30 yrs
- 22 days/yr
Wind risk 4/10 · Minor
- Chance of severe wind over 30 yrs
- 19.0%
Air-quality risk 2/10 · Minimal
- Unhealthy air days now
- 0 days/yr
- Unhealthy air days in 30 yrs
- 1 days/yr
Risk factors via First Street. Map © Google.
Why this score? — see what drove the D grade
The composite is a weighted blend of 9 inputs, each scored 0–100. Each bar is that input's sub-score; the figure is the points it added to the 100-point composite (weight × sub-score).
- Cash flow +15.1/30.0
- ARV discount +8.0/15.0
- DSCR +4.6/10.0
- 1% rule +4.4/10.0
- Livability +3.1/5.0
- Schools +3.0/10.0
- Rent growth +2.5/5.0
- Condition / age +2.5/5.0
- Appreciation +0.0/10.0
$149,900
🖨 Deal sheet (PDF) 📄 Offer letter ✓ Due diligence
Listing remarks
Late 1800's Victorian Home in Beautiful Paris Texas. This multi-purpose property features 3 bedrooms, 3 bathrooms, 2 living areas with fireplaces. The charming oval glass door leads to an elegant entry with a beautiful staircase. Large open den, kitchen and breakfast area wonderful for entertaining. This property features a 2 car garage with 700 sq ft apartment above that needs a total renovation with make a great Air B & B. House has had some updating and has been occupied in the last year for several years. Property is zone Residential Commercial.
Key facts
- Beautiful staircase
- Victorian home
- Oval glass door
Tags
Property features AI
Finance
- Financial info: Treat as clear loan type; No second mortgage; Listing terms: Cash or Conventional
- HOA & community: No association
Exterior
- Parking: Covered parking for 2 vehicles; Garage (2 spaces)
- Utilities: City water; City sewer; Electricity available and connected; Cable available; Asphalt streets, curbs and sidewalks
- Home design: Single family residence; Residential property; Accessible approach with ramp; Property attached (accessory unit present)
- Construction: Frame construction; Composition roof; Bois DArc Post foundation; Year built not specified
- Exterior features: Covered patio/porch; Back yard fencing; Barbed wire, wire and wood fencing; Guest house (accessory unit, approx. 700 sq ft)
Interior
- Kitchen: Gas cooktop; Gas oven; Built-in cabinets; Eat-in kitchen; Tile counters; Utility area in kitchen
- Bedrooms: Primary bedroom on level 1 with walk-in closet; Bedroom on level 2; Bedroom on level 2 with walk-in closet
- Flooring: Ceramic tile; Hardwood; Linoleum
- Bathrooms: 3 full bathrooms; Primary bathroom with separate shower and built-in cabinets; Additional bathrooms with built-in cabinets and tile counters
- Heating & cooling: Gas jets heating; Ceiling fans; Window units
- Interior features: Cable TV available; 11 rooms total; Two levels; Two living areas; Two dining areas
- Laundry & utility: Electric dryer hookup; Laundry located in kitchen
Neighborhood map
What this means for you Summary
Snapshot
- This is a 3-bed/2.0-bath single-family listed at $150k.
Deal economics
- At list price, monthly cash flow is $48 ($577/yr) — positive.
- The deal already cash-flows at list — no discount required.
- To meet the 1% rule (rent ≥ 1% of price), the offer needs to be $142k (5.6% below list).
- Recommended offer: $141k (6.0% below list) — sets the bar for market timing.
- Cap rate 6.7% vs local median 3.7% in Paris — top-decile yield for the area; either an underpriced asset or a hidden risk that comps aren't pricing in. Stress-test before assuming the spread holds.
Location & tenants
- Location reads 61/100 on livability (#984 in TX) — a middle-class / working-renter tenant base. Strengths: cost of living A+, housing A+; Watch: crime F, amenities F, commute F.
- Paris ISD (town): math 36% / reading 37% proficiency, ranked #521 of 826 in TX (top 63%) — families likely to look elsewhere, expect single-tenant / working-renter base with shorter leases; 70% free/reduced lunch — lower-income household profile, screen leases tightly.
- Zoned schools: Aikin El (math 32% / reading 35%, grade F, #2,174 of 4,322 statewide, top 51%, 937 students, 74% FRL); Crockett Int (math 33% / reading 33%, grade F, #930 of 1,662 statewide, top 57%, 560 students, 79% FRL); Paris H S (math 60% / reading 51%, grade C, #364 of 1,632 statewide, top 23%, 934 students, 71% FRL) — zoned schools at 75% FRL track the district average.
- Market conditions: 277 active listings in the ZIP; 2 comparable units currently listed for rent nearby; 119 units permitted in Lamar County in 2024 (71 in 5+ unit buildings).
- This rent runs 37% of the median local income ($46k/yr) — at the standard rent-burdened threshold; future hikes will face affordability resistance.
Forward outlook
- Local home prices are declining (-3.0%/yr); year-one equity from $1k of loan paydown is wiped out by about $4k of value loss. Plan a longer hold.
- Lamar County population projected at -13% by 2050 — secular population decline; favor cash flow + early exit over multi-decade hold.
Negotiation context
- It's been on market 66 days — a 6% lower offer ($141k) is reasonable based on typical stale-listing flexibility.
- 2 sale attempts; this cycle's ask has dropped $49k (25%) from the opening price — seller is motivated, your offer sets the floor, not the list.
Risks & watch-outs
- Climate carrying-cost: major wildfire risk; extreme-heat days projected 7→22/yr by 2055 (HVAC capex compounding) — expect insurance premiums to compound above CPI over the hold.
Questions for the listing agent
- It's been on market 66 days. Have you received any prior offers? Is the seller open to a 6% concession, seller financing, or rate buy-down credit?
- Why hasn't it sold? Are there any deal-killer items the seller is aware of (foundation, flood, title, zoning, code violations)?
- Is there a deadline driving the sale (1031 exchange, divorce, estate, relocation)? That informs how much negotiation room exists.
- Schools are D-rated, which usually means shorter tenancies and higher turnover. Who's the typical renter profile here, and what's been the actual vacancy rate?
- Crime grade is F in this area — have there been break-ins, vandalism, or insurance claims at this property in the last 3 years? What carrier currently insures it and at what premium?
- The area grade is low — what's the realistic commute time and amenity access for the typical tenant pool here? Any planned neighborhood developments (good or bad) we should know about?
- What's the average days-on-market for RENTAL listings here right now (not sales)? A rising rental-DOM trend means longer vacancies and softer asking-rent achievability than the comps imply.
- What's the recent tenant-quality profile in this submarket — average credit score on applications, eviction rate, late-payment / NSF rate, and stable-employment percentage? A property-management company in the area should have these aggregated.
- How much new for-sale + rental construction is in the pipeline within 1–3 miles? Heavy new supply typically softens prices + rents 12–24 months out; constrained supply supports both.
Investment metrics
- 1% rule
- 0.94% ✗
- Cap rate
- 6.68%
- Cash-on-cash
- 1.37%
- DSCR
- 1.06
- GRM
- 8.8
CMA / ARV
- ARV (on-the-fly)
- $151,696
- Comps found
- 12
Show comp detail 12 sales within ~0.75 mi
| Address | Dist | Beds/Ba | Sqft | Sold | Price | $/sf | Match |
|---|---|---|---|---|---|---|---|
| 1738 Lamar Ave | 0.00mi | 3/3.0 | 1,996 (0%) | 1mo | $149,900 | $75 | 95 |
| 2000 Simpson St | 0.38mi | 3/2.0 | 2,056 (+3%) | 1mo | $235,000 | $114 | 77 |
| 195 NE 20th St NE | 0.17mi | 3/3.0 | 2,044 (+2%) | 10mo | $154,500 | $76 | 76 |
| 1801 Pine Bluff St | 0.22mi | 4/2.0 (+1) | 2,186 (+10%) | 3mo | $190,000 | $87 | 66 |
| 108 SE 22nd St | 0.27mi | 3/2.0 | 1,704 (-15%) | 1mo | $60,000 | $35 | 62 |
| 831 17th St SE | 0.47mi | 3/2.0 | 1,784 (-11%) | 1mo | $135,000 | $76 | 60 |
| 421 8th St SE | 0.62mi | 3/2.0 | 2,042 (+2%) | 10mo | $154,900 | $76 | 59 |
| 1910 E Polk St | 0.62mi | 3/2.0 | 1,908 (-4%) | 6mo | $149,000 | $78 | 58 |
| 206 6th St SE | 0.74mi | 3/1.5 | 1,944 (-3%) | 4mo | $99,800 | $51 | 56 |
| 545 26th St SE | 0.69mi | 3/2.0 | 2,204 (+10%) | 2mo | $185,000 | $84 | 49 |
| 1930 Cedar St | 0.70mi | 3/2.5 | 1,836 (-8%) | 11mo | $134,900 | $73 | 43 |
| 2725 Hubbard St | 0.66mi | 4/2.0 (+1) | 2,220 (+11%) | 7mo | $255,000 | $115 | 39 |
Match score weights: distance 35% · size 25% · config 20% · recency 20%. Top-matched comps best support the ARV.
Projected returns pro-forma
-3.0% appreciation · 3.0% rent growth · sell at horizon
- IRR
- -14.1%
- Equity multiple
- 0.50×
- Total profit
- $-21,187
- Equity at exit
- $22,351
- IRR
- -5.2%
- Equity multiple
- 0.66×
- Total profit
- $-14,336
- Equity at exit
- $12,961
Cash invested: $41,972 (down + closing). Projections, not guarantees.
Landlord ↔ Tenant lean methodology
- Overall (STATE)
- 87 Strongly Landlord-Friendly
- State Texas
- 87 Strongly Landlord-Friendly · R+5
- County
- — inherits STATE
- City
- — inherits STATE
ZIP-level market 75460
- Active inventory
- 277
- Price-to-rent
- 8.8×
Monthly cashflow live
- Estimated rent
- $1,415 medium interval (Pro) →
- Mortgage (P&I)
- −$786
- Tax from tax record
- −$221 /mo · $2,656/yr
- Insurance
- −$62
- HOA
- −$0
- Lot rent
- −$0
- Vacancy / Maint / Mgmt
- −$297
- Net cashflow
- $48
Break-even live
Sensitivity live
| Price | -10% $133 | -5% $90 | +0% $48 | +5% $6 | +10% $-37 |
|---|---|---|---|---|---|
| Rent | -10% $-64 | -5% $-8 | +0% $48 | +5% $104 | +10% $160 |
| Rate | -1.0pp $124 | -0.5pp $86 | base $48 | +0.5pp $9 | +1.0pp $-30 |
UW: 25.0% down · 7.5% · 30yr · 1.5% tax · 5.0% vac · 8.0% maint · 8.0% mgmt
Financing live
Cash to close
- Down payment
- $37,475
- Closing costs
- $4,497
- Reserves months
- —
- Total cash needed
- —
Loan-product check · same deal, 3 products live
Conventional
25% down · 7.5% · 30yr
- Down + closing
- —
- Monthly P&I
- —
- Monthly cashflow
- —
- DSCR
- —
- Eligible?
- —
Personal DTI + credit; lowest rate.
DSCR
20% down · 8.5% · 30yr
- Down + closing
- —
- Monthly P&I
- —
- Monthly cashflow
- —
- DSCR
- —
- Eligible?
- —
No personal income docs; deal must DSCR.
Hard money
10% down · 12.0% · 12mo
- Down + closing
- —
- Monthly P&I
- —
- Monthly cashflow
- —
- DSCR
- —
- Eligible?
- —
Short-term bridge; refi at stabilization.
Rent comps 2 comps
| Address | Beds | Baths | Sqft | Rent | $/sqft | DOM | Units | Dist |
|---|---|---|---|---|---|---|---|---|
| 2246 Simpson St Paris, TX | 3.0 | 1.0 | 1508 | $1,250 | $0.83 | 46d | 1 | 0.47mi |
| 2121 Cedar St Paris, TX | 3.0 | 2.0 | 1394 | $2,000 | $1.43 | 46d | 1 | 0.69mi |
Listing history 7 events
-
2026-05-21status Pending
-
2026-05-14price $149,900
-
2026-03-16$199,000 Active
-
2025-10-16historical
-
2025-08-19price $179,000
-
2025-04-16$279,000 Active
-
2021-09-22soldstatus
ⓘ Source: listings_history table (triggers on properties + properties_extension) + one-shot
backfill from property_details.listing_events for pre-trigger history.
Tax reassessment forecast TX · Resets to sale price
- Current annual tax
- $2,656 · $221/mo
- Projected year-2 tax
- $2,743 · $229/mo
- Expected delta
- +$87/yr (+$7/mo · 3.3%)
ⓘ Screening estimate from a state-policy table — verify with the county assessor before closing.
Climate risk First Street
- Flood 1/10 Low FEMA zone X (unshaded) · 0% chance over 30 yrs
- Wildfire 6/10 Major
- Heat 7/10 Severe 7 d/yr ≥110°F today · 22 d/yr by 30 yrs out
- Wind 4/10 Moderate 19% chance of damaging wind over 30 yrs
- Air quality 2/10 Low 0 unhealthy d/yr today · 1 by 30 yrs out
Nearby sold comps map
Loading sold comps map…
Walkable amenities ~0.75 mi
Loading nearby amenities…
Taxation est. · year 1
- Rental income
- $16,981
- − Mortgage interest
- −$8,397
- − Property taxes
- −$2,656
- − Insurance
- −$750
- − Repairs & maintenance
- −$1,358
- − Management
- −$1,358
- − Depreciation
- −$4,361
- Taxable loss
- −$1,899
- Est. tax savings @ 24.0%
- +$456
- After-tax cash flow
- $1,032/yr
For passive investors: Depreciation is non-cash, so a rental often shows a tax loss while cash-flowing — sheltering income. Rental losses are passive: they offset passive income freely, and up to $25,000/yr can offset ordinary (W-2) income if you actively participate and your MAGI is under $100k (phasing out to $0 by $150k); unused losses carry forward. On sale, claimed depreciation is recaptured at up to 25%, and gains may owe capital-gains tax (a 1031 exchange can defer both). Figures are a year-1 estimate at your 24.0% rate — not tax advice; consult a CPA.
Schools (NCES district)
- District
- Paris ISD
- NCES district ID
- 4834290
- Math proficiency
- 36% ▼ -11.00%
- Reading proficiency
- 37% ▼ -1.00%
- Median HH income
- $31,515
- Composite
- 29.83/100
- National rank
- #6419
- State rank
- #521 of 826 in TX
Livability — Paris
- Score
- 61/100
- State rank
- #984
- US rank
- #17535
Category grades
Schools grade is shown separately in the Schools card above.
Census & demographics
- Census place
- Paris, TX
- County
- Lamar County · 23,426 people
- City population
- 23,426
- Metro
- Paris, TX
- Population (ZIP)
- 23,426
- Household income
- $46,473
- Rent vs Own
- Severe rent burden
- 1355.0
Population outlook (Lamar County) Hauer SSP2
- Today (2025)
- 48,319 people
- By 2030
- 47,160 · -2.4%
- By 2040
- 44,621 · -7.7%
- By 2050
- 42,024 · -13.0%
- By 2075
- 36,577 · -24.3%
- By 2100
- 30,580 · -36.7%
Race, ethnicity, and origin ACS 2023
- Neighborhood character
- Diverse neighborhood (Simpson 0.60)
- Race & ethnicity
- White 58% Black 22% Hispanic / Latino 13% Two or more races 8%
- Hispanic origin (detail)
- Mexican 12%
- Common ancestry
- Lithuanian 1% Slovak 1% Italian 1%
- Foreign-born
- 3% · Canada, China
- Languages at home
- 92% English-only · Spanish 7%
Political lean MEDSL · Lamar
- 2024 margin
- Solid R (+61.0) · D 19.2% · R 80.3%
- 2008→2024 swing
- -19.1pp toward R · 2008: -42.0pp · 2024: -61.0pp
- All cycles
- 2024: R+61.0 2020: R+57.4 2016: R+59.2 2012: R+50.3 2008: R+42.0
Not yet ingested
- Civics
- —
Market trends
- HPI YoY
- ▼ -201.50%
- Current HPI
- 145.3511
- Rent YoY
- —
- Metro
- Paris, TX
- State GDP YoY
- ▲ 3.95%
- F500 in state
- 110
Industry mix (Fortune 500 HQ in TX)
| Industry | F500 HQs | Revenue |
|---|---|---|
| Energy | 16 | $1,198B |
|
||
| Technology | 5 | $198B |
|
||
| Engineering / Construction | 4 | $72B |
|
||
| Energy Services | 3 | $60B |
|
||
| Utilities | 3 | $41B |
|
||
| Healthcare | 2 | $330B |
|
||
Price history
-46.3% since first listed7 events — show timeline
- 2026-05-21 Pending — NTREIS
- 2026-05-14 Price Changed $149,900 NTREIS
- 2026-03-16 Listed $199,000 NTREIS
- 2025-10-16 Listing Removed — NTREIS
- 2025-08-19 Price Changed $179,000 NTREIS
- 2025-04-16 Listed $279,000 NTREIS
- 2021-09-22 Sold (Public Records) — Public Records
Property tax history
+1.0%/yrLatest (2025): $2,656 · +1.2% YoY. Source: county tax records.
Cash-flow waterfall
monthlySold comps — $/sqft
last 12 mo · ≤1 miLoading sold comps…