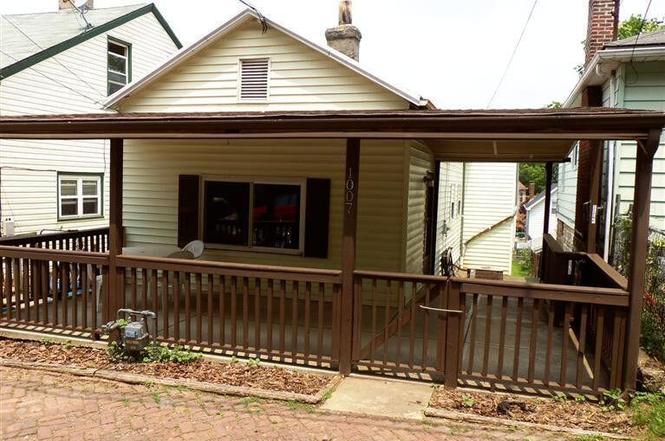
1007 6th Ave · Dayton, KY
Flood risk 1/10 · Minimal
- FEMA flood zone
- X (unshaded)
- Chance of flooding over 30 yrs
- 0.0%
- Est. flood insurance / yr
- $507 – $1,088
Fire risk 1/10 · Minimal
- Est. fire insurance / yr
- $839 – $1,559
Heat risk 5/10 · Moderate
- Hot days now (above 103°F)
- 7 days/yr
- Hot days in 30 yrs
- 19 days/yr
Wind risk 2/10 · Minimal
- Chance of severe wind over 30 yrs
- 1.0%
Air-quality risk 3/10 · Minor
- Unhealthy air days now
- 2 days/yr
- Unhealthy air days in 30 yrs
- 3 days/yr
Risk factors via First Street. Map © Google.
Why this score? — see what drove the C+ grade
The composite is a weighted blend of 9 inputs, each scored 0–100. Each bar is that input's sub-score; the figure is the points it added to the 100-point composite (weight × sub-score).
- Cash flow +29.2/30.0
- DSCR +10.0/10.0
- 1% rule +7.7/10.0
- Rent growth +4.3/5.0
- Livability +4.0/5.0
- Condition / age +2.5/5.0
- Schools +2.3/10.0
- ARV discount +1.9/15.0
- Appreciation +0.0/10.0
$159,000
🖨 Deal sheet 📄 Offer letter ✓ Due diligence
Listing remarks
Great new price! Nice home on peaceful, quiet street, with a private, fenced backyard & covered patio, perfect for relaxation and outdoor activities. HVAC replaced in 2023. The interior features 3 bedrooms, 2 full baths, beautiful laminate wood flooring, efficient double pane windows and newer kitchen cabinets. Larger than it appears with a finished, walkout lower level. 3rd bedroom in lower level could also be a family room. Excellent opportunity in a prime location close to parks, harbor, restaurants, making it an ideal choice for those seeking both comfort and convenience. Covered front porch. Available for immediate occupancy. Price raised with seller making improvements over 1s
Key facts
- Covered front porch
- Covered patio
- 2,744 sq ft lot
Tags
Property features AI
Exterior
- Parking: On-street parking
- Utilities: Public water; Public sewer
- Home design: Single-family house; One level
- Construction: Vinyl and wood siding; Metal roof; Block foundation
- Exterior features: Covered patio and porch; Porch; Metal fencing; Level lot; Lot dimensions irregular
Interior
- Kitchen: Refrigerator; Microwave
- Bedrooms: Primary bedroom (approx. 11 x 14); Second bedroom (approx. 9 x 10)
- Flooring: Laminate wood floors in main living areas
- Bathrooms: Two full bathrooms
- Heating & cooling: Central air conditioning; Forced air heating
- Interior features: Full and partial basement; Laundry room on the lower level; Laminate wood flooring in living room and kitchen; Living room (approx. 15 x 15); Kitchen (approx. 12 x 12); Flexible room (approx. 13 x 20) that could be used as a family room or playroom; Additional small room (approx. 6 x 8)
- Laundry & utility: Washer; Dryer; Laundry room located on the lower level
Neighborhood map
What this means for you Summary
Snapshot
- This is a 3-bed/2.0-bath single-family listed at $159k.
Deal economics
- At list price, monthly cash flow is $555 ($7k/yr) — positive.
- The deal already cash-flows at list — no discount required.
- Meets the 1% rule at list price ($2k rent vs $159k).
- Recommended offer: $145k (9.0% below list) — sets the bar for market timing.
- Cap rate 10.5% vs local median 6.9% in Dayton — top-decile yield for the area; either an underpriced asset or a hidden risk that comps aren't pricing in. Stress-test before assuming the spread holds.
Location & tenants
- Location reads 81/100 on livability (#67 in KY, #1,485 nationally) — a professional / high-income tenant draw. Strengths: commute A+, cost of living A+, housing A+; Watch: employment D+.
- Dayton Independent (suburban): math 23% / reading 32% proficiency, ranked #129 of 165 in KY (top 78%) — low school quality limits family demand, transient renter base, plan for 1-2y turnover; 71% free/reduced lunch — lower-income household profile, screen leases tightly.
- Zoned schools: Lincoln Elementary School (math 20% / reading 29%, grade F, #489 of 676 statewide, top 76%, 487 students, 82% FRL); Dayton High School (math 27% / reading 37%, grade F, #97 of 254 statewide, top 46%, 372 students, 78% FRL).
- Market conditions: Rents rising fast (+7.2%/yr); 53 active listings in the ZIP; 20 comparable units currently listed for rent nearby; rentals at typical pace (median 20d on market — plan ~3-4 weeks tenant-placement turnaround); 247 units permitted in Campbell County in 2024 (77 in 5+ unit buildings).
- This rent runs 37% of the median local income ($66k/yr) — at the standard rent-burdened threshold; future hikes will face affordability resistance.
Forward outlook
- Local home prices are declining (-3.0%/yr); year-one equity from $1k of loan paydown is wiped out by about $5k of value loss. Plan a longer hold.
- At projected returns (-3.0% appreciation + 7.2% rent growth), your $45k cash investment doubles in ~7 years — after that, you're playing with house money.
Negotiation context
- It's been on market 113 days — a 9% lower offer ($145k) is reasonable based on typical stale-listing flexibility.
- 12 sale attempts since 31y ago with the ask held roughly flat each time — persistent listings suggest the price (not the market) is what's stuck; bring a comps-based counter.
- Current owner paid $125k; 27% above their basis — modest negotiation headroom, anchor on the comps not their cost.
Risks & watch-outs
- Watch-outs: built in 1860 — expect roof / HVAC / electrical / plumbing capex.
- Climate carrying-cost: extreme-heat days projected 7→19/yr by 2055 (HVAC capex compounding) — expect insurance premiums to compound above CPI over the hold.
Questions for the listing agent
- It's been on market 113 days. Have you received any prior offers? Is the seller open to a 9% concession, seller financing, or rate buy-down credit?
- Built in 1860 — when were the roof, HVAC, electrical panel, plumbing, and water heater last replaced?
- Why hasn't it sold? Are there any deal-killer items the seller is aware of (foundation, flood, title, zoning, code violations)?
- Is there a deadline driving the sale (1031 exchange, divorce, estate, relocation)? That informs how much negotiation room exists.
- Schools are D-rated, which usually means shorter tenancies and higher turnover. Who's the typical renter profile here, and what's been the actual vacancy rate?
- What's the average days-on-market for RENTAL listings here right now (not sales)? A rising rental-DOM trend means longer vacancies and softer asking-rent achievability than the comps imply.
- What's the recent tenant-quality profile in this submarket — average credit score on applications, eviction rate, late-payment / NSF rate, and stable-employment percentage? A property-management company in the area should have these aggregated.
- How much new for-sale + rental construction is in the pipeline within 1–3 miles? Heavy new supply typically softens prices + rents 12–24 months out; constrained supply supports both.
Investment metrics
- 1% rule
- 1.27% ✓
- Cap rate
- 10.48%
- Cash-on-cash
- 14.95%
- DSCR
- 1.67
- GRM
- 6.6
CMA / ARV
- ARV (on-the-fly)
- $141,405
- Comps found
- 12
Show comp detail 12 sales within ~0.75 mi
| Address | Dist | Beds/Ba | Sqft | Sold | Price | $/sf | Match |
|---|---|---|---|---|---|---|---|
| 813 6th Ave | 0.16mi | 2/2.0 (-1) | 841 (-2%) | 7mo | $25,000 | $30 | 78 |
| 611 Vine St | 0.59mi | 2/2.0 (-1) | 855 (-0%) | 2mo | $175,000 | $205 | 66 |
| 523 10th Ave | 0.31mi | 2/1.0 (-1) | 840 (-2%) | 14mo | $110,000 | $131 | 61 |
| 843 Ervin Ter | 0.46mi | 3/1.0 | 872 (+2%) | 12mo | $50,000 | $57 | 61 |
| 922 7th Ave | 0.10mi | 2/1.0 (-1) | 938 (+10%) | 13mo | $199,000 | $212 | 60 |
| 808 Ervin Ter | 0.51mi | 2/1.0 (-1) | 840 (-2%) | 5mo | $93,000 | $111 | 60 |
| 518 8th Ave | 0.36mi | 2/1.0 (-1) | 927 (+8%) | 5mo | $153,000 | $165 | 56 |
| 526 5th Ave | 0.40mi | 2/1.5 (-1) | 964 (+12%) | 2mo | $105,000 | $109 | 52 |
| 502 Dayton Ave | 0.39mi | 2/1.0 (-1) | 964 (+12%) | 7mo | $70,000 | $73 | 47 |
| 422 5th Ave | 0.49mi | 2/1.0 (-1) | 736 (-14%) | 0mo | $133,000 | $181 | 44 |
| 919 Maple Ave | 0.60mi | 2/1.0 (-1) | 960 (+12%) | 7mo | $176,000 | $183 | 37 |
| 206 9th Ave | 0.63mi | 2/1.0 (-1) | 729 (-15%) | 12mo | $175,000 | $240 | 26 |
Match score weights: distance 35% · size 25% · config 20% · recency 20%. Top-matched comps best support the ARV.
Projected returns pro-forma
-3.0% appreciation · 7.15% rent growth · sell at horizon
- IRR
- 10.0%
- Equity multiple
- 1.41×
- Total profit
- $18,333
- Equity at exit
- $23,707
- IRR
- 22.2%
- Equity multiple
- 3.26×
- Total profit
- $100,638
- Equity at exit
- $13,747
Cash invested: $44,520 (down + closing). Projections, not guarantees.
Landlord ↔ Tenant lean methodology
- Overall (STATE)
- 83 Strongly Landlord-Friendly
- State Kentucky
- 83 Strongly Landlord-Friendly · R+16
- County
- — inherits STATE
- City
- — inherits STATE
ZIP-level market 41074
- Rents YoY
- 7.2%
- Active inventory
- 53
- Price-to-rent
- 6.6×
Monthly cashflow live
- Estimated rent
- $2,016 high interval (Pro) →
- Mortgage (P&I)
- −$834
- Tax from tax record
- −$138 /mo · $1,653/yr
- Insurance
- −$66
- HOA
- −$0
- Vacancy / Maint / Mgmt
- −$423
- Net cashflow
- $555
Break-even live
UW: 25.0% down · 7.5% · 30yr · 1.5% tax · 5.0% vac · 8.0% maint · 8.0% mgmt
Financing live
Cash to close
- Down payment
- $39,750
- Closing costs
- $4,770
- Reserves months
- —
- Total cash needed
- —
Loan-product check · same deal, 3 products live
Conventional
25% down · 7.5% · 30yr
- Down + closing
- —
- Monthly P&I
- —
- Monthly cashflow
- —
- DSCR
- —
- Eligible?
- —
Personal DTI + credit; lowest rate.
DSCR
20% down · 8.5% · 30yr
- Down + closing
- —
- Monthly P&I
- —
- Monthly cashflow
- —
- DSCR
- —
- Eligible?
- —
No personal income docs; deal must DSCR.
Hard money
10% down · 12.0% · 12mo
- Down + closing
- —
- Monthly P&I
- —
- Monthly cashflow
- —
- DSCR
- —
- Eligible?
- —
Short-term bridge; refi at stabilization.
Rent comps 20 comps
| Address | Beds | Baths | Sqft | Rent | $/sqft | DOM | Units | Dist |
|---|---|---|---|---|---|---|---|---|
| 1065 Manhattan Blvd Dayton, KY | 1.0–3.0 | 1.0–2.0 | 1038 | $2,749 | $2.65 | 1d | 19 | 0.28mi |
| 1181 Manhattan Blvd Dayton, KY | 2.0 | 2.0 | 1124 | $2,712 | $2.41 | 1d | 10 | 0.40mi |
| 2401 Salutaris Ave Cincinnati, OH | 1.0–2.0 | 1.0 | 800 | $1,300 | $1.62 | 23d | 1 | 0.97mi |
| 1713 William Howard Taft Rd #1 Cincinnati, OH | 2.0 | 1.0 | 850 | $1,695 | $1.99 | 23d | 1 | 1.00mi |
| 324 Fairfield Ave Unit 4 Bellevue, KY | 2.0 | 1.0 | 1095 | $1,545 | $1.41 | 21d | 1 | 1.06mi |
| 324 Fairfield Ave Unit 1 Bellevue, KY | 2.0 | 1.0 | 1080 | $1,685 | $1.56 | 2d | 1 | 1.06mi |
| 1404-1406 E McMillan St Cincinnati, OH | 1.0–2.0 | 1.0–1.5 | 1200 | $1,695 | $1.41 | 23d | 1 | 1.08mi |
| 2705 Hackberry St Unit 1 Cincinnati, OH | 2.0 | 1.0 | 1000 | $1,395 | $1.40 | 23d | 1 | 1.11mi |
| 2533 Woodburn Ave Cincinnati, OH | 3.0 | 1.0–3.0 | 912 | $3,320 | $3.64 | 1d | 39 | 1.14mi |
| 2716 Woodburn Ave Unit 2 Cincinnati, OH | 2.0 | 1.0 | 900 | $1,350 | $1.50 | 23d | 1 | 1.16mi |
| 239 Grandview Ave Bellevue, KY | 2.0 | 2.0 | 1093 | $1,645 | $1.50 | 4d | 2 | 1.19mi |
| 2330 Victory Pkwy Cincinnati, OH | 1.0–2.0 | 1.0–2.0 | 693 | $1,999 | $2.88 | 2d | 6 | 1.19mi |
| 1228 E McMillan St Cincinnati, OH | 1.0–2.0 | 1.0–2.0 | 1340 | $2,327 | $1.74 | 1d | 14 | 1.24mi |
| 2101 Grandin Rd Cincinnati, OH | 1.0–2.0 | 1.0–2.0 | 1042 | $2,099 | $2.01 | 1d | 12 | 1.26mi |
| 3001-A Woodburn Ave Cincinnati, OH | 1.0–2.0 | 1.0–2.0 | 947 | $2,252 | $2.38 | 1d | 12 | 1.31mi |
| 2118 Saint James Ave Cincinnati, OH | 2.0 | 1.0 | 1005 | $1,650 | $1.64 | 23d | 1 | 1.35mi |
| 2624 Victory Pkwy Unit 206 Cincinnati, OH | 2.0 | 1.0 | 975 | $1,499 | $1.54 | 10d | 1 | 1.36mi |
| 960 Francisco St Unit 107 Cincinnati, OH | 2.0 | 2.0 | 912 | $1,649 | $1.81 | 23d | 1 | 1.41mi |
| 975 E McMillan St Cincinnati, OH | 2.0 | 1.0 | 978 | $1,695 | $1.73 | 20d | 1 | 1.44mi |
| 975 E McMillan St Unit 201 Cincinnati, OH | 2.0 | 1.0 | 978 | $1,695 | $1.73 | 20d | 1 | 1.44mi |
Listing history 47 events
-
2026-06-18days on market $159,000 Active 113 DOM
-
2026-06-17days on market $159,000 Active 112 DOM
-
2026-06-16days on market $159,000 Active 111 DOM
-
2026-06-15days on market $159,000 Active 110 DOM
-
2026-06-13days on market $159,000 Active 108 DOM
-
2026-06-09days on market $159,000 Active 104 DOM
-
2026-06-08days on market $159,000 Active 103 DOM
-
2026-06-07days on market $159,000 Active 102 DOM
-
2026-06-03days on market $159,000 Active 98 DOM
-
2026-06-02days on market $159,000 Active 97 DOM
-
2026-06-01days on market $159,000 Active 96 DOM
-
2026-05-31days on market $159,000 Active 95 DOM
-
2026-05-22price $159,000
-
2026-04-25price $160,000
-
2026-03-03price $173,000
-
2026-02-24$163,000 Active
-
2026-01-28historical
-
2025-09-18$163,000 Active
-
2025-07-25historical
-
2025-06-02price $163,000
-
2025-03-09$168,000 Active
-
2024-10-10historical
-
2024-08-12price $170,000
-
2024-07-25$180,000 Active
-
2023-09-15historical
-
2023-07-10price $168,500
-
2023-06-05$175,000 Active
-
2022-02-07status Pending
-
2022-02-04soldstatus $125,000 Sold
-
2022-01-28soldstatus $125,000
-
2022-01-22$125,000 Active
-
2012-11-01soldstatus $26,000
-
2012-10-31soldstatus $28,000
-
2012-08-14$35,000
-
2012-07-08historical
-
2012-01-09$47,000
-
2010-06-01historical
-
2010-03-01$52,500
-
2010-02-28historical
-
2009-09-01$55,000
-
2004-04-27soldstatus $52,000
-
2004-04-23soldstatus $52,000
-
2003-12-18$54,500
-
1995-06-20soldstatus $37,000
-
1995-06-19soldstatus $37,000
-
1995-03-09$41,500
-
1988-04-25soldstatus $20,000
ⓘ Source: listings_history table (triggers on properties + properties_extension) + one-shot
backfill from property_details.listing_events for pre-trigger history.
Tax reassessment forecast KY · Resets to sale price
- Current annual tax
- $1,653 · $138/mo
- Projected year-2 tax
- $1,653 · $138/mo
- Expected delta
- $0/yr ($0/mo · -0.0%)
ⓘ Screening estimate from a state-policy table — verify with the county assessor before closing.
Climate risk First Street
- Flood 1/10 Low FEMA zone X (unshaded) · 0% chance over 30 yrs
- Wildfire 1/10 Low
- Heat 5/10 Major 7 d/yr ≥103°F today · 19 d/yr by 30 yrs out
- Wind 2/10 Low 100% chance of damaging wind over 30 yrs
- Air quality 3/10 Moderate 2 unhealthy d/yr today · 3 by 30 yrs out
Nearby sold comps map
Loading sold comps map…
Walkable amenities ~0.75 mi
Loading nearby amenities…
Taxation est. · year 1
- Rental income
- $24,192
- − Mortgage interest
- −$8,906
- − Property taxes
- −$1,653
- − Insurance
- −$795
- − Repairs & maintenance
- −$1,935
- − Management
- −$1,935
- − Depreciation
- −$4,625
- Taxable income
- $4,341
- Est. tax owed @ 24.0%
- −$1,042
- After-tax cash flow
- $5,616/yr
For passive investors: Depreciation is non-cash, so a rental often shows a tax loss while cash-flowing — sheltering income. Rental losses are passive: they offset passive income freely, and up to $25,000/yr can offset ordinary (W-2) income if you actively participate and your MAGI is under $100k (phasing out to $0 by $150k); unused losses carry forward. On sale, claimed depreciation is recaptured at up to 25%, and gains may owe capital-gains tax (a 1031 exchange can defer both). Figures are a year-1 estimate at your 24.0% rate — not tax advice; consult a CPA.
Schools (NCES district)
- District
- Dayton Independent
- NCES district ID
- 2101530
- Math proficiency
- 23% ▼ -13.00%
- Reading proficiency
- 32% ▼ -12.00%
- Median HH income
- $38,533
- Composite
- 23.0/100
- National rank
- #7978
- State rank
- #129 of 165 in KY
Livability — Dayton
- Score
- 81/100
- State rank
- #67
- US rank
- #1485
Category grades
Schools grade is shown separately in the Schools card above.
Census & demographics
- Census place
- Dayton, KY
- County
- Campbell County · 84,793 people
- City population
- 5,756
- Metro
- Cincinnati, OH-KY-IN
- Population (ZIP)
- 5,756
- Household income
- $66,087
- Rent vs Own
- Severe rent burden
- 215.0
Population outlook (Campbell County) Hauer SSP2
- Today (2025)
- 95,668 people
- By 2030
- 96,886 · +1.3%
- By 2040
- 97,734 · +2.2%
- By 2050
- 96,413 · +0.8%
- By 2075
- 90,211 · -5.7%
- By 2100
- 79,434 · -17.0%
Race, ethnicity, and origin ACS 2023
- Neighborhood character
- Predominantly White (89%)
- Race & ethnicity
- White 89% Two or more races 7% Hispanic / Latino 3% Black 1%
- Common ancestry
- Slovak 5% Italian 3% Lithuanian 2%
- Foreign-born
- 2% · Canada
- Languages at home
- 98% English-only · Spanish 1%
Political lean MEDSL · Campbell
- 2024 margin
- R (+19.7) · D 39.2% · R 58.9% · Other 1.9%
- 2008→2024 swing
- +1.2pp toward D · 2008: -20.9pp · 2024: -19.7pp
- All cycles
- 2024: R+19.7 2020: R+18.6 2016: R+24.5 2012: R+22.8 2008: R+20.9
Not yet ingested
- Civics
- —
Market trends
- HPI YoY
- ▼ -171.48%
- Current HPI
- 235.1437
- Rent YoY
- ▲ 7.15%
- Metro
- Cincinnati, OH-KY-IN
- State GDP YoY
- ▲ 1.81%
- F500 in state
- 4
Industry mix (Fortune 500 HQ in KY)
| Industry | F500 HQs | Revenue |
|---|---|---|
| Healthcare | 1 | $118B |
|
||
| Food / Beverage | 1 | $7B |
|
||
Price history
+695.0% since first listed35 events — show timeline
- 2026-05-22 Price Changed $159,000 NKMLS
- 2026-04-25 Price Changed $160,000 NKMLS
- 2026-03-03 Price Changed $173,000 NKMLS
- 2026-02-24 Listed $163,000 NKMLS
- 2026-01-28 Listing Removed — NKMLS
- 2025-09-18 Listed $163,000 NKMLS
- 2025-07-25 Listing Removed — NKMLS
- 2025-06-02 Price Changed $163,000 NKMLS
- 2025-03-09 Listed $168,000 NKMLS
- 2024-10-10 Listing Removed — NKMLS
- 2024-08-12 Price Changed $170,000 NKMLS
- 2024-07-25 Listed $180,000 NKMLS
- 2023-09-15 Listing Removed — NKMLS
- 2023-07-10 Price Changed $168,500 NKMLS
- 2023-06-05 Listed $175,000 NKMLS
- 2022-02-07 Pending — NKMLS
- 2022-02-04 Sold (MLS) $125,000 NKMLS
- 2022-01-28 Sold (Public Records) $125,000 Public Records
- 2022-01-22 Listed $125,000 NKMLS
- 2012-11-01 Sold (Public Records) $26,000 Public Records
- 2012-10-31 Sold (MLS) $28,000 NKMLS
- 2012-08-14 Listed $35,000 NKMLS
- 2012-07-08 Listing Removed — NKMLS
- 2012-01-09 Listed $47,000 NKMLS
- 2010-06-01 Listing Removed — NKMLS
- 2010-03-01 Listed $52,500 NKMLS
- 2010-02-28 Listing Removed — NKMLS
- 2009-09-01 Listed $55,000 NKMLS
- 2004-04-27 Sold (Public Records) $52,000 Public Records
- 2004-04-23 Sold (MLS) $52,000 NKMLS
- 2003-12-18 Listed $54,500 NKMLS
- 1995-06-20 Sold (Public Records) $37,000 Public Records
- 1995-06-19 Sold (MLS) $37,000 NKMLS
- 1995-03-09 Listed $41,500 NKMLS
- 1988-04-25 Sold (Public Records) $20,000 Public Records
Property tax history
+12.5%/yrLatest (2025): $1,653 · +0.5% YoY. Source: county tax records.
Cash-flow waterfall
monthlySold comps — $/sqft
last 12 mo · ≤1 miLoading sold comps…