 🌊 Lakefront
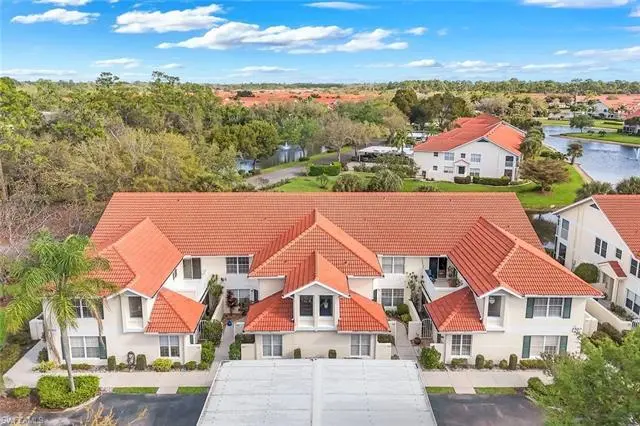
4940 Deerfield Way #201 · Pelican Marsh, FL
Flood risk 1/10 · Minimal
- FEMA flood zone
- X (unshaded)
- Chance of flooding over 30 yrs
- 0.0%
- Est. flood insurance / yr
- $507 – $1,088
Fire risk 3/10 · Minor
- Est. fire insurance / yr
- $947 – $1,759
Heat risk 10/10 · Severe
- Hot days now (above 107°F)
- 7 days/yr
- Hot days in 30 yrs
- 30 days/yr
Wind risk 10/10 · Severe
- Chance of severe wind over 30 yrs
- 99.0%
Air-quality risk 2/10 · Minimal
- Unhealthy air days now
- 1 days/yr
- Unhealthy air days in 30 yrs
- 1 days/yr
Risk factors via First Street. Map © Google.
Why this score? — see what drove the C grade
The composite is a weighted blend of 9 inputs, each scored 0–100. Each bar is that input's sub-score; the figure is the points it added to the 100-point composite (weight × sub-score).
- Cash flow +21.8/30.0
- 1% rule +7.5/10.0
- ARV discount +7.5/15.0
- DSCR +7.0/10.0
- Schools +5.0/10.0
- Livability +2.5/5.0
- Condition / age +2.5/5.0
- Rent growth +2.2/5.0
- Appreciation +0.0/10.0
$330,000
🖨 Deal sheet (PDF) 📄 Offer letter ✓ Due diligence
Listing remarks
One or more photo(s) has been virtually staged, AI generated or rendered. Welcome to your dream lakefront retreat in beautiful Naples! This is a fantastic value with over 1650 sq ft of space in a gated community that is only 6 miles to Naples white sand beaches. This freshly painted, spacious 2 bedroom plus den end unit offers total privacy, with no neighboring buildings and boasts two lanais—one open and one screened—ideal for enjoying the serene lake views. Inside, you'll find an open concept floor plan with vaulted ceilings, updated flooring throughout and new carpet in the bedrooms. As part of a gated community, indulge in an array of amenities including a 60 ft lap pool, ho
Key facts
- Lakefront retreat
- Gated community
- Total privacy
Tags
Property features AI
Finance
- Other: Lakeview at Carlton Lakes sub-condominium
- Financial info: Total units in complex: 800; Units in building: 8; 2 units per floor; 2 floors in building
- HOA & community: Mandatory HOA; Quarterly master HOA fee; Quarterly condo fee; Condo management; Maintenance covers cable, insurance, internet/WiFi, irrigation water, lawn/land maintenance, legal/accounting, manager, exterior pest control, reserves, sewer and water; Community amenities include clubhouse, community pool, community spa/hot tub, exercise room, tennis courts, basketball, bocce court, shuffleboard, fishing pier, play area, bike and jog path, sidewalks, streetlights, BBQ/picnic area and internet access; Community type includes tennis facilities; Total annual recurring fees noted
Exterior
- Parking: 1 assigned parking space; Guest parking available; Detached 1-car carport
- Security: Gated community; Entry keypad
- Utilities: Central water; Central sewer; Cable available
- Home design: Residential property; Carriage/coach style in a low-rise (1–3) building; Rear exposure faces northwest; Located in Carlton Lakes development
- Construction: Built in 1997; Concrete block construction
- Exterior features: Tile roof; Single-hung windows; Stucco exterior finish; Gated community; Entry keypad; Lakefront view; Irrigation with reclaimed water; Lake/Canal irrigation; Paved road access; Zero-lot-line setting
Interior
- Kitchen: Dishwasher; Disposal; Microwave; Range; Refrigerator/Freezer
- Bedrooms: 2 bedrooms plus den; Split bedroom floor plan
- Flooring: Carpet; Tile
- Bathrooms: 2 full bathrooms; Master bathroom with shower only
- Heating & cooling: Central electric heating; Central electric cooling; Ceiling fans
- Interior features: High-speed internet available; Smoke detectors; Walk-in closet; Window coverings; Breakfast bar and dining in living area; Balcony; Den / study; Guest bathroom; Guest room; Laundry in residence; Open porch / lanai; Screened lanai / porch; Unfurnished
- Laundry & utility: Washer; Dryer
Neighborhood map
What this means for you Summary
Snapshot
- This is a 2-bed/2.0-bath condo listed at $330k.
Deal economics
- At list price, monthly cash flow is $515 ($6k/yr) — positive.
- The deal already cash-flows at list — no discount required.
- Meets the 1% rule at list price ($4k rent vs $330k).
- Recommended offer: $300k (9.0% below list) — sets the bar for market timing.
Location & tenants
- Location reads: area grade C — affects rentability + tenant quality, not the cash-flow math above.
- Collier (suburban): math 60% / reading 56% proficiency, ranked #16 of 73 in FL (top 22%) — acceptable for families but not a draw, mixed tenant base, ~2y average lease.
- Zoned schools: Veterans Memorial Elementary School (math 78% / reading 79%, grade A, #141 of 2,144 statewide, top 7%, 743 students, 22% FRL); North Naples Middle School (math 79% / reading 73%, grade A, #34 of 571 statewide, top 6%, 903 students, 25% FRL); Gulf Coast High School (math 57% / reading 68%, grade B-, #93 of 667 statewide, top 14%, 2,447 students, 20% FRL) — zoned schools average 22% FRL vs 55% district-wide (33 pts lower); this property's tenant base skews higher-income than the district average.
- Zoned-school proficiency averages 72% at this address vs 58% district-wide (+14 pts) — the actual schools serving this property are materially stronger than the Collier average implies; a family-tenant draw the district grade alone would hide.
- Market conditions: Rents soft (-1.1%/yr); 595 active listings in the ZIP; 40 comparable units currently listed for rent nearby; rentals at typical pace (median 25d on market — plan ~3-4 weeks tenant-placement turnaround); solid renter incomes; 3,520 units permitted in Collier County in 2024 (959 in 5+ unit buildings).
- At $4,121/mo this rent would consume 51% of the median local household income ($98k/yr) (locally 1006% of renters already pay >50% of income on rent) — very limited rent-growth headroom before tenants either downsize or default.
Forward outlook
- Local home prices are declining (-3.0%/yr); year-one equity from $2k of loan paydown is wiped out by about $10k of value loss. Plan a longer hold.
- Collier County population projected at +30% by 2050 — long-run rental-demand tailwind backs the buy-and-hold thesis.
Negotiation context
- It's been on market 96 days — a 9% lower offer ($300k) is reasonable based on typical stale-listing flexibility.
- Current owner paid $136k; list at $330k implies a 143% gain — meaningful room to come down on a strong offer.
Risks & watch-outs
- Climate carrying-cost: severe wind risk, 99% chance of damaging wind over 30y; extreme-heat days projected 7→30/yr by 2055 (HVAC capex compounding) — expect insurance premiums to compound above CPI over the hold.
Questions for the listing agent
- It's been on market 96 days. Have you received any prior offers? Is the seller open to a 9% concession, seller financing, or rate buy-down credit?
- What does the HOA fee cover, when was the last increase, and are there any pending special assessments or reserve-fund shortfalls?
- Any open or pending special assessments — roof, HVAC, plumbing, elevator, façade? What's the per-unit balance and payoff schedule, and is the seller paying it off at close or rolling it to the buyer?
- Why hasn't it sold? Are there any deal-killer items the seller is aware of (foundation, flood, title, zoning, code violations)?
- Is there a deadline driving the sale (1031 exchange, divorce, estate, relocation)? That informs how much negotiation room exists.
- This sits on a lake — are riparian / water-frontage rights deeded with the parcel? Any dock permits, shoreline easements, or HOA water-use restrictions?
- What's the documented flood / surge / shoreline-erosion history here (FEMA AND non-FEMA — e.g., storm surge, creek backup, septic-field saturation)?
- Any water-quality or seasonal algae-bloom issues that affect tenant satisfaction or short-term-rental demand?
- What's the average days-on-market for RENTAL listings here right now (not sales)? A rising rental-DOM trend means longer vacancies and softer asking-rent achievability than the comps imply.
- What's the recent tenant-quality profile in this submarket — average credit score on applications, eviction rate, late-payment / NSF rate, and stable-employment percentage? A property-management company in the area should have these aggregated.
- How much new apartment / multifamily construction is in the pipeline within 1–3 miles? Heavy new supply (>2% of stock underway) typically softens rents 12–24 months out; light construction supports rent growth.
Investment metrics
- 1% rule
- 1.25% ✓
- Cap rate
- 8.16%
- Cash-on-cash
- 6.68%
- DSCR
- 1.30
- GRM
- 6.7
CMA / ARV
No comps found within radius.
Projected returns pro-forma
-3.0% appreciation · 0.0% rent growth · sell at horizon
- IRR
- -10.0%
- Equity multiple
- 0.65×
- Total profit
- $-32,423
- Equity at exit
- $49,204
- IRR
- -6.2%
- Equity multiple
- 0.66×
- Total profit
- $-31,294
- Equity at exit
- $28,532
Cash invested: $92,400 (down + closing). Projections, not guarantees.
Landlord ↔ Tenant lean methodology
- Overall (STATE)
- 87 Strongly Landlord-Friendly
- State Florida
- 87 Strongly Landlord-Friendly · R+3
- County
- — inherits STATE
- City
- — inherits STATE
ZIP-level market 34110
- Rents YoY
- -1.1%
- Active inventory
- 595
- Price-to-rent
- 6.7×
Monthly cashflow live
- Estimated rent
- $4,121 high interval (Pro) →
- Mortgage (P&I)
- −$1,731
- Tax from tax record
- −$114 /mo · $1,369/yr
- Insurance
- −$138
- HOA
- −$759
- Vacancy / Maint / Mgmt
- −$865
- Net cashflow
- $515
Break-even live
Sensitivity live
| Price | -10% $702 | -5% $608 | +0% $515 | +5% $421 | +10% $328 |
|---|---|---|---|---|---|
| Rent | -10% $189 | -5% $352 | +0% $515 | +5% $678 | +10% $840 |
| Rate | -1.0pp $681 | -0.5pp $599 | base $515 | +0.5pp $429 | +1.0pp $342 |
UW: 25.0% down · 7.5% · 30yr · 1.5% tax · 5.0% vac · 8.0% maint · 8.0% mgmt
Financing live
Cash to close
- Down payment
- $82,500
- Closing costs
- $9,900
- Reserves months
- —
- Total cash needed
- —
Loan-product check · same deal, 3 products live
Conventional
25% down · 7.5% · 30yr
- Down + closing
- —
- Monthly P&I
- —
- Monthly cashflow
- —
- DSCR
- —
- Eligible?
- —
Personal DTI + credit; lowest rate.
DSCR
20% down · 8.5% · 30yr
- Down + closing
- —
- Monthly P&I
- —
- Monthly cashflow
- —
- DSCR
- —
- Eligible?
- —
No personal income docs; deal must DSCR.
Hard money
10% down · 12.0% · 12mo
- Down + closing
- —
- Monthly P&I
- —
- Monthly cashflow
- —
- DSCR
- —
- Eligible?
- —
Short-term bridge; refi at stabilization.
Rent comps 40 comps
| Address | Beds | Baths | Sqft | Rent | $/sqft | DOM | Units | Dist |
|---|---|---|---|---|---|---|---|---|
| 4950 Deerfield Way #202 Naples, FL | 2.0 | 2.0 | 1388 | $2,000 | $1.44 | 22d | 1 | 0.05mi |
| 4960 Deerfield Way Unit E102 Naples, FL | 2.0 | 2.0 | 1202 | $4,250 | $3.54 | 15d | 1 | 0.08mi |
| 4910 Deerfield Way Unit A-203 Naples, FL | 2.0 | 2.0 | 1388 | $5,500 | $3.96 | 15d | 1 | 0.08mi |
| 4910 Deerfield Way #103 Naples, FL | 2.0 | 2.0 | 1200 | $4,800 | $4.00 | 22d | 1 | 0.08mi |
| 4970 Deerfield Way Unit F-203 Naples, FL | 2.0 | 2.0 | 1388 | $1,990 | $1.43 | 15d | 1 | 0.11mi |
| 4910 Cougar Ct N Unit 1-205 Naples, FL | 2.0 | 2.0 | 1377 | $2,050 | $1.49 | 15d | 1 | 0.13mi |
| 5025 Cedar Springs Dr #102 Naples, FL | 2.0 | 2.0 | 1202 | $1,590 | $1.32 | 15d | 1 | 0.13mi |
| 5025 Cedar Springs Dr #102 Naples, FL | 2.0 | 2.5 | 1202 | $3,510 | $2.92 | 25d | 1 | 0.13mi |
| 5130 Cobble Creek Ct Unit B202 Naples, FL | 3.0 | 2.0 | 2050 | $2,800 | $1.37 | 15d | 1 | 0.14mi |
| 5045 Cedar Springs Dr #103 Naples, FL | 2.0 | 2.0 | 1202 | $5,000 | $4.16 | 25d | 1 | 0.15mi |
| 5045 Cedar Springs Dr #203 Naples, FL | 2.0 | 2.0 | 1427 | $4,200 | $2.94 | 25d | 1 | 0.15mi |
| 4945 Cougar Ct S #105 Naples, FL | 2.0 | 2.0 | 1377 | $2,750 | $2.00 | 15d | 1 | 0.20mi |
| 5145 Cobble Creek Ct #202 Naples, FL | 2.0 | 2.0 | 1798 | $2,600 | $1.45 | 22d | 1 | 0.21mi |
| 5125 Cedar Springs Dr #204 Naples, FL | 3.0 | 2.0 | 2177 | $5,650 | $2.60 | 25d | 1 | 0.21mi |
| 5000 Immokalee Rd Naples, FL | 1.0–3.0 | 1.0–2.0 | 1115 | $3,186 | $2.86 | 15d | 68 | 0.21mi |
| 4940 Cougar Ct S Unit 1545947P Naples, FL | 2.0 | 2.0 | 1367 | $2,185 | $1.60 | 15d | 1 | 0.23mi |
| 4965 Sandra Bay Dr #102 Naples, FL | 2.0 | 2.0 | 1377 | $2,200 | $1.60 | 15d | 1 | 0.25mi |
| 5360 Andover Dr #202 Naples, FL | 3.0 | 2.0 | 1928 | $6,500 | $3.37 | 25d | 1 | 0.25mi |
| 5105 Cedar Springs Dr #101 Naples, FL | 2.0 | 2.0 | 1650 | $7,000 | $4.24 | 25d | 1 | 0.26mi |
| 5330 Andover Dr #102 Naples, FL | 3.0 | 2.0 | 1740 | $2,550 | $1.47 | 25d | 1 | 0.28mi |
| 4680 Saint Croix Ln Naples, FL | 1.0–3.0 | 1.0–2.0 | 931 | $2,000 | $2.15 | 15d | 2 | 0.30mi |
| 4680 Saint Croix Ln #512 Naples, FL | 3.0 | 2.0 | 1196 | $2,490 | $2.08 | 25d | 1 | 0.31mi |
| 5325 Andover Dr #101 Naples, FL | 2.0 | 2.0 | 1654 | $5,250 | $3.17 | 25d | 1 | 0.31mi |
| 4720 Saint Croix Ln #137 Naples, FL | 2.0 | 2.0 | 1200 | $2,200 | $1.83 | 25d | 1 | 0.32mi |
| 15181 Butler Lake Dr #201 Naples, FL | 3.0 | 2.0 | 2152 | $7,500 | $3.49 | 15d | 1 | 0.35mi |
| 15177 Butler Lake Dr #201 Naples, FL | 3.0 | 2.0 | 2152 | $8,500 | $3.95 | 15d | 1 | 0.36mi |
| 4610 Saint Croix Ln #1027 Naples, FL | 3.0 | 2.0 | 1196 | $4,000 | $3.34 | 25d | 1 | 0.36mi |
| 5455 Worthington Ln #103 Naples, FL | 2.0 | 2.0 | 1202 | $5,000 | $4.16 | 25d | 1 | 0.38mi |
| 5455 Worthington Ln #202 Naples, FL | 2.0 | 2.0 | 1427 | $3,900 | $2.73 | 25d | 1 | 0.38mi |
| 5645 Whisperwood Blvd #504 Naples, FL | 2.0 | 2.0 | 1793 | $6,000 | $3.35 | 25d | 1 | 0.45mi |
| 5632 Whisperwood Blvd #1601 Naples, FL | 3.0 | 2.0 | 1856 | $8,000 | $4.31 | 25d | 1 | 0.45mi |
| 5935 Northridge Dr Naples, FL | 2.0 | 2.0 | 1671 | $2,995 | $1.79 | 25d | 1 | 0.46mi |
| 5657 Whisperwood Blvd #204 Naples, FL | 2.0 | 2.0 | 1793 | $6,000 | $3.35 | 25d | 1 | 0.46mi |
| 15145 Palmer Lake Cir #103 Naples, FL | 3.0 | 2.0 | 1571 | $7,000 | $4.46 | 25d | 1 | 0.49mi |
| 5630 Sherborn Dr #202 Naples, FL | 3.0 | 2.0 | 2005 | $7,500 | $3.74 | 25d | 1 | 0.50mi |
| 194 Wickliffe Dr Naples, FL | 3.0 | 2.0 | 1798 | $3,500 | $1.95 | 25d | 1 | 0.51mi |
| 300 Diamond Cir #302 Naples, FL | 3.0 | 2.0 | 1755 | $2,600 | $1.48 | 25d | 1 | 0.51mi |
| 15144 Palmer Lake Cir #102 Naples, FL | 2.0 | 2.0 | 1375 | $6,500 | $4.73 | 25d | 1 | 0.52mi |
| 15126 Palmer Lake Cir Naples, FL | 2.0–3.0 | 2.0 | 1254 | $3,000 | $2.39 | 25d | 2 | 0.60mi |
| 5693 Heron Ln #502 Naples, FL | 2.0 | 2.0 | 1490 | $6,800 | $4.56 | 25d | 1 | 0.61mi |
HOA detail condo
- Monthly dues
- $759 · $9,108/yr
- Likely covers
- poolsecurity
- Assessments
- None detected in remarks — confirm with the listing agent.
Listing history 13 events
-
2026-06-21days on market $330,000 Active 96 DOM
-
2026-06-18days on market $330,000 Active 93 DOM
-
2026-06-17days on market $330,000 Active 92 DOM
-
2026-06-16days on market $330,000 Active 91 DOM
-
2026-06-15days on market $330,000 Active 90 DOM
-
2026-06-14pricedays on market $330,000 Active 88 DOM
-
2026-06-10days on market $350,000 Active 85 DOM
-
2026-06-09days on market $350,000 Active 84 DOM
-
2026-06-08days on market $350,000 Active 83 DOM
-
2026-06-07days on market $350,000 Active 82 DOM
-
2026-06-03days on market $350,000 Active 78 DOM
-
2026-06-03remarks 687-char remark
-
2026-06-03$350,000 Active 77 DOM
ⓘ Source: listings_history table (triggers on properties + properties_extension) + one-shot
backfill from property_details.listing_events for pre-trigger history.
Tax reassessment forecast FL · Resets to sale price
- Current annual tax
- $1,369 · $114/mo
- Projected year-2 tax
- $2,739 · $228/mo
- Expected delta
- +$1,370/yr (+$114/mo · 100.1%)
ⓘ Screening estimate from a state-policy table — verify with the county assessor before closing.
Climate risk First Street
- Flood 1/10 Low FEMA zone X (unshaded) · 0% chance over 30 yrs
- Wildfire 3/10 Moderate
- Heat 10/10 Extreme 7 d/yr ≥107°F today · 30 d/yr by 30 yrs out
- Wind 10/10 Extreme 99% chance of damaging wind over 30 yrs
- Air quality 2/10 Low 1 unhealthy d/yr today · 1 by 30 yrs out
Nearby sold comps map
Loading sold comps map…
Walkable amenities ~0.75 mi
Loading nearby amenities…
Taxation est. · year 1
- Rental income
- $49,456
- − Mortgage interest
- −$18,485
- − Property taxes
- −$1,369
- − Insurance
- −$1,650
- − Repairs & maintenance
- −$3,957
- − Management
- −$3,957
- − HOA
- −$9,108
- − Depreciation
- −$9,600
- Taxable income
- $1,331
- Est. tax owed @ 24.0%
- −$319
- After-tax cash flow
- $5,857/yr
For passive investors: Depreciation is non-cash, so a rental often shows a tax loss while cash-flowing — sheltering income. Rental losses are passive: they offset passive income freely, and up to $25,000/yr can offset ordinary (W-2) income if you actively participate and your MAGI is under $100k (phasing out to $0 by $150k); unused losses carry forward. On sale, claimed depreciation is recaptured at up to 25%, and gains may owe capital-gains tax (a 1031 exchange can defer both). Figures are a year-1 estimate at your 24.0% rate — not tax advice; consult a CPA.
Schools (NCES district)
- District
- Collier
- NCES district ID
- 1200330
- Math proficiency
- 60% ▼ -4.00%
- Reading proficiency
- 56% ▼ -2.00%
- Median HH income
- $58,275
- Composite
- 50.23/100
- National rank
- #1892
- State rank
- #16 of 73 in FL
Livability — Pelican Marsh
No livability data for this city. (Only ~50 U.S. cities are tracked.)
Census & demographics
- County
- Collier County · 396,295 people
- Metro
- Naples-Marco Island, FL
- Population (ZIP)
- 25,630
- Household income
- $97,564
- Rent vs Own
- Severe rent burden
- 1006.0
Population outlook (Collier County) Hauer SSP2
- Today (2025)
- 420,858 people
- By 2030
- 450,054 · +6.9%
- By 2040
- 502,232 · +19.3%
- By 2050
- 544,932 · +29.5%
- By 2075
- 627,203 · +49.0%
- By 2100
- 659,015 · +56.6%
Race, ethnicity, and origin ACS 2023
- Neighborhood character
- Predominantly White (84%)
- Race & ethnicity
- White 84% Hispanic / Latino 10% Two or more races 9% Asian 2% Black 1%
- Hispanic origin (detail)
- Mexican 2% Puerto Rican 1% Cuban 3%
- Common ancestry
- Romanian 4% Lithuanian 3% Slovak 2%
- Foreign-born
- 11% · Canada, South Korea
- Languages at home
- 87% English-only · Spanish 7% Other Indo-European 3% French/Haitian/Cajun 1%
Political lean MEDSL · Collier
- 2024 margin
- Solid R (+33.1) · D 33.1% · R 66.2%
- 2008→2024 swing
- -10.6pp toward R · 2008: -22.5pp · 2024: -33.1pp
- All cycles
- 2024: R+33.1 2020: R+24.7 2016: R+26.0 2012: R+30.1 2008: R+22.5
Not yet ingested
- Civics
- —
Market trends
- HPI YoY
- ▼ -172.68%
- Current HPI
- 267.4644
- Rent YoY
- ▼ -1.06%
- Metro
- Naples-Marco Island, FL
- State GDP YoY
- ▲ 3.28%
- F500 in state
- 36
Industry mix (Fortune 500 HQ in FL)
| Industry | F500 HQs | Revenue |
|---|---|---|
| Industrial Technology | 2 | $29B |
|
||
| Insurance | 2 | $17B |
|
||
| Retail | 1 | $60B |
|
||
| Technology Distribution | 1 | $58B |
|
||
| Homebuilding | 1 | $35B |
|
||
| Technology Manufacturing | 1 | $35B |
|
||
Price history
+207.3% since first listed3 events — show timeline
- 2026-03-17 Listed $350,000 NAPLESMLS
- 2001-10-08 Sold (Public Records) $136,000 Public Records
- 1997-04-01 Sold (Public Records) $113,900 Public Records
Property tax history
+1.1%/yrLatest (2025): $1,369 · +2.7% YoY. Source: county tax records.
Cash-flow waterfall
monthlySold comps — $/sqft
last 12 mo · ≤1 miLoading sold comps…