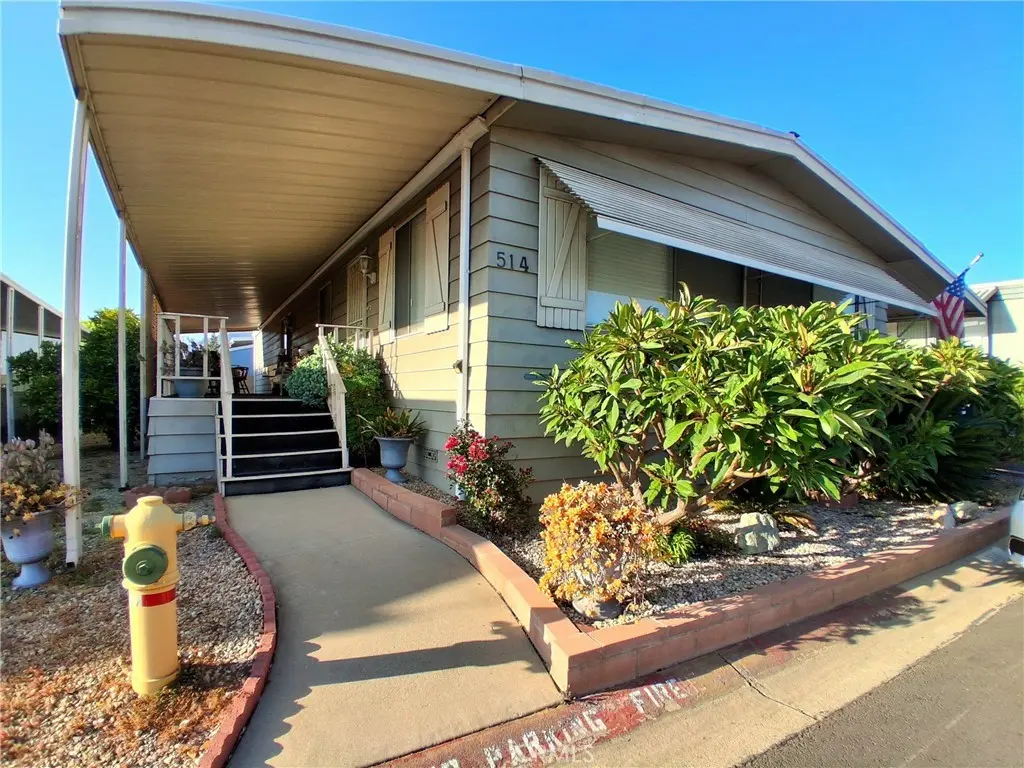
4095 Fruit #514 · La Verne, CA
Flood risk 1/10 · Minimal
- FEMA flood zone
- X (unshaded)
- Chance of flooding over 30 yrs
- 0.0%
- Est. flood insurance / yr
- $507 – $1,088
Fire risk 3/10 · Minor
- Est. fire insurance / yr
- $659 – $1,223
Heat risk 7/10 · Major
- Hot days now (above 98°F)
- 7 days/yr
- Hot days in 30 yrs
- 19 days/yr
Wind risk 1/10 · Minimal
- Chance of severe wind over 30 yrs
- —
Air-quality risk 8/10 · Major
- Unhealthy air days now
- 17 days/yr
- Unhealthy air days in 30 yrs
- 21 days/yr
Risk factors via First Street. Map © Google.
Why this score? — see what drove the B+ grade
The composite is a weighted blend of 9 inputs, each scored 0–100. Each bar is that input's sub-score; the figure is the points it added to the 100-point composite (weight × sub-score).
- Cash flow +30.0/30.0
- ARV discount +10.8/15.0
- 1% rule +10.0/10.0
- DSCR +10.0/10.0
- Schools +5.9/10.0
- Livability +3.8/5.0
- Condition / age +3.8/5.0
- Rent growth +3.1/5.0
- Appreciation +0.0/10.0
$185,000
🖨 Deal sheet (PDF) 📄 Offer letter ✓ Due diligence
Listing remarks MLS
Location! Location! Location! Welcome to the highly desirable 55+ Foothill Terrace Mobile Home Park community. Centrally located in the beautiful city of La Verne. Opportunity to own this double-wide 2 bed 2 bath mobile home with many upgrades and remodeling completed within the last few years. The remodeling included fresh paint inside and out, new laminate and carpet flooring, new kitchen cabinets, quartz countertop and backsplash, new stove and built-in microwave, recess lighting, custom vanity in master bath, ceiling-high shower tile, new bathroom vanities, fixtures, new wood and carpet in patio, new rear sliding door, and exterior staircase, cemented yard, storage sheds, and extra long driveway to fit plenty of vehicles. This home offers a spacious living room great for relaxation or to entertain family and friends. Dining room with custom built-in cabinets, ceiling fans, and separate family room with sliding door access to your very own patio. A nice bright kitchen. Plenty of windows throughout for natural lighting. Your very own laundry room. Master bedroom with extra closet space. Resort-like living. Featuring a library room, 2 swimming pools, 2 clubhouses, game room, private gym, optional paid RV parking space, guest parking. Plus! They offer a cooperative Emergency Paramedic Service and the community is Pet Friendly. Come tour the home. See the amenities. Fall in love. Make an offer.
Key facts
- 3 parking spots
- Community pool
- Built 1973
Property features AI
Finance
- Other: Living area source: public records; Elevation measured in feet; Directions: north of Foothill
- Financial info: Monthly land lease of $1,000
- HOA & community: Senior community; Street lighting; Park name: Foothill Terrace; Manager approval required
Exterior
- Parking: Carport with space for 3 vehicles; Has parking
- Utilities: Public sewer; District/Public water
- Home design: Single-story mobile home (24' x 64'); Double body type; Mobile home remains
- Construction: Composition roof; One total story
- Exterior features: Porch; Awning; Community pool; Close to clubhouse; Two sheds
Interior
- Kitchen: Gas range; Microwave; Garbage disposal; Water heater unit
- Bedrooms: Primary bedroom
- Bathrooms: Two 3/4 bathrooms; Double sinks in primary bath; Shower
- Heating & cooling: Central furnace heating; Central cooling
- Interior features: Quartz counters; Open kitchen to family room; Exhaust fan(s); Walk-in closet; Has view; Entry on west side; Entry at ground level
- Laundry & utility: Washer included; Dryer included
Neighborhood map
What this means for you Summary
Snapshot
- This is a 2-bed/2.0-bath manufactured listed at $185k. Condition is rated good.
Deal economics
- At list price, monthly cash flow is $1k ($17k/yr) — positive.
- The deal already cash-flows at list — no discount required.
- Meets the 1% rule at list price ($3k rent vs $185k).
- Cap rate 15.6% vs local median 2.9% in La Verne — top-decile yield for the area; either an underpriced asset or a hidden risk that comps aren't pricing in. Stress-test before assuming the spread holds.
Location & tenants
- Location reads 75/100 on livability (#110 in CA, #3,858 nationally) — a middle-class / working-renter tenant base. Strengths: amenities A+, employment A+, commute A; Watch: cost of living F, health & safety F.
- Bonita Unified (suburban): math 59% / reading 70% proficiency, ranked #151 of 1,400 in CA (top 11%) — acceptable for families but not a draw, mixed tenant base, ~2y average lease.
- Zoned schools: La Verne Heights Elementary (486 students, 30% FRL); Ramona Middle (1,304 students, 35% FRL); Bonita High (1,883 students, 28% FRL) — zoned schools at 31% FRL track the district average.
- Market conditions: Rents rising (+2.4%/yr); 95 active listings in the ZIP; 15 comparable units currently listed for rent nearby; rentals at typical pace (median 21d on market — plan ~3-4 weeks tenant-placement turnaround); 40% of comp listings sitting > 30 days — soft ceiling on asking rent; solid renter incomes; 19,697 units permitted in Los Angeles County in 2024 (9,426 in 5+ unit buildings).
- This rent runs 39% of the median local income ($104k/yr) — at the standard rent-burdened threshold; future hikes will face affordability resistance.
Forward outlook
- Local home prices are declining (-3.0%/yr); year-one equity from $1k of loan paydown is wiped out by about $6k of value loss. Plan a longer hold.
- Los Angeles County population projected at +9% by 2050 — modest demand growth; plan on rents tracking national, not racing it.
- At projected returns (-3.0% appreciation + 2.4% rent growth), your $52k cash investment doubles in ~4 years — after that, you're playing with house money.
Negotiation context
- Only 13 days on market — expect competitive offers; lowballing is unlikely to land.
- 2 sale attempts since 5y ago with the ask held roughly flat each time — persistent listings suggest the price (not the market) is what's stuck; bring a comps-based counter.
Risks & watch-outs
- Climate carrying-cost: extreme-heat days projected 7→19/yr by 2055 (HVAC capex compounding) — expect insurance premiums to compound above CPI over the hold.
Questions for the listing agent
- Built in 1973 — when were the roof, HVAC, electrical panel, plumbing, and water heater last replaced?
- Is there a deadline driving the sale (1031 exchange, divorce, estate, relocation)? That informs how much negotiation room exists.
- Schools are A-rated — typically a magnet for longer-tenancy family renters. What's the average tenant stay here, and is there a school-zone premium baked into asking?
- What's the average days-on-market for RENTAL listings here right now (not sales)? A rising rental-DOM trend means longer vacancies and softer asking-rent achievability than the comps imply.
- What's the recent tenant-quality profile in this submarket — average credit score on applications, eviction rate, late-payment / NSF rate, and stable-employment percentage? A property-management company in the area should have these aggregated.
- How much new for-sale + rental construction is in the pipeline within 1–3 miles? Heavy new supply typically softens prices + rents 12–24 months out; constrained supply supports both.
Investment metrics
- 1% rule
- 1.85% ✓
- Cap rate
- 15.57%
- Cash-on-cash
- 33.12%
- DSCR
- 2.47
- GRM
- 4.5
CMA / ARV
- ARV (on-the-fly)
- $199,680
- Comps found
- 12
Show comp detail 12 sales within ~0.75 mi
| Address | Dist | Beds/Ba | Sqft | Sold | Price | $/sf | Match |
|---|---|---|---|---|---|---|---|
| 4095 Fruit St #324 | 0.01mi | 2/2.0 | 1,440 (-6%) | 1mo | $135,000 | $94 | 88 |
| 4095 Fruit St #603 | 0.13mi | 2/2.0 | 1,512 (-2%) | 5mo | $300,000 | $198 | 87 |
| 4095 Fruit St #608 | 0.13mi | 2/2.0 | 1,596 (+4%) | 6mo | $185,000 | $116 | 83 |
| 4095 Fruit St #852 | 0.01mi | 2/2.0 | 1,400 (-9%) | 2mo | $155,000 | $111 | 83 |
| 4095 Fruit St #114 | 0.00mi | 2/2.0 | 1,344 (-12%) | 0mo | $145,000 | $108 | 79 |
| 3800 Bradford St #182 | 0.59mi | 2/2.0 | 1,560 (+2%) | 2mo | $260,000 | $167 | 68 |
| 3945 Bradford #39 | 0.54mi | 2/2.0 | 1,488 (-3%) | 5mo | $162,000 | $109 | 65 |
| 3945 Bradford #111 | 0.54mi | 2/2.0 | 1,440 (-6%) | 2mo | $155,000 | $108 | 62 |
| 3800 Bradford St #265 | 0.58mi | 2/2.0 | 1,440 (-6%) | 3mo | $275,000 | $191 | 60 |
| 3800 Bradford #26 | 0.60mi | 2/3.0 | 1,440 (-6%) | 2mo | $275,000 | $191 | 56 |
| 3800 Bradford St #311 | 0.70mi | 2/2.0 | 1,440 (-6%) | 2mo | $280,000 | $194 | 55 |
| 3800 Bradford St #314 | 0.60mi | 2/2.0 | 1,736 (+13%) | 4mo | $225,000 | $130 | 47 |
Match score weights: distance 35% · size 25% · config 20% · recency 20%. Top-matched comps best support the ARV.
Projected returns pro-forma
-3.0% appreciation · 2.35% rent growth · sell at horizon
- IRR
- 27.6%
- Equity multiple
- 2.14×
- Total profit
- $58,914
- Equity at exit
- $27,584
- IRR
- 34.7%
- Equity multiple
- 4.08×
- Total profit
- $159,754
- Equity at exit
- $15,995
Cash invested: $51,800 (down + closing). Projections, not guarantees.
Landlord ↔ Tenant lean methodology
- Overall (STATE)
- 18 Strongly Tenant-Friendly
- State California
- 18 Strongly Tenant-Friendly · D+13
- County
- — inherits STATE
- City
- — inherits STATE
ZIP-level market 91750
- Rents YoY
- 2.4%
- Active inventory
- 95
- Price-to-rent
- 4.5×
Monthly cashflow live
- Estimated rent
- $3,428 high interval (Pro) →
- Mortgage (P&I)
- −$970
- Tax est. 1.5%
- −$231 /mo · $2,775/yr
- Insurance
- −$77
- HOA
- −$0
- Vacancy / Maint / Mgmt
- −$720
- Net cashflow
- $1,430
Break-even live
Sensitivity live
| Price | -10% $1,558 | -5% $1,494 | +0% $1,430 | +5% $1,366 | +10% $1,302 |
|---|---|---|---|---|---|
| Rent | -10% $1,159 | -5% $1,294 | +0% $1,430 | +5% $1,565 | +10% $1,701 |
| Rate | -1.0pp $1,523 | -0.5pp $1,477 | base $1,430 | +0.5pp $1,382 | +1.0pp $1,333 |
UW: 25.0% down · 7.5% · 30yr · 1.5% tax · 5.0% vac · 8.0% maint · 8.0% mgmt
Financing live
Cash to close
- Down payment
- $46,250
- Closing costs
- $5,550
- Reserves months
- —
- Total cash needed
- —
Loan-product check · same deal, 3 products live
Conventional
25% down · 7.5% · 30yr
- Down + closing
- —
- Monthly P&I
- —
- Monthly cashflow
- —
- DSCR
- —
- Eligible?
- —
Personal DTI + credit; lowest rate.
DSCR
20% down · 8.5% · 30yr
- Down + closing
- —
- Monthly P&I
- —
- Monthly cashflow
- —
- DSCR
- —
- Eligible?
- —
No personal income docs; deal must DSCR.
Hard money
10% down · 12.0% · 12mo
- Down + closing
- —
- Monthly P&I
- —
- Monthly cashflow
- —
- DSCR
- —
- Eligible?
- —
Short-term bridge; refi at stabilization.
Rent comps 15 comps
| Address | Beds | Baths | Sqft | Rent | $/sqft | DOM | Units | Dist |
|---|---|---|---|---|---|---|---|---|
| 3748 Verdana Cir La Verne, CA | 3.0 | 3.0 | 1493 | $4,500 | $3.01 | 16d | 1 | 0.19mi |
| 3836 Verdana Cir La Verne, CA | 2.0 | 2.5 | 1243 | $3,500 | $2.82 | 45d | 1 | 0.21mi |
| 3816 Verdana Cir La Verne, CA | 2.0 | 2.5 | 1243 | $3,300 | $2.65 | 20d | 1 | 0.25mi |
| 2002 Canopy Ln La Verne, CA | 3.0 | 3.0 | 1759 | $3,450 | $1.96 | 46d | 1 | 0.42mi |
| 2063 Evergreen St La Verne, CA | 3.0 | 2.0 | 1300 | $3,200 | $2.46 | 45d | 1 | 0.43mi |
| 1623 Heather Dr La Verne, CA | 3.0 | 1.5 | 1121 | $3,250 | $2.90 | 20d | 1 | 0.51mi |
| 3807 Abbey Way La Verne, CA | 3.0 | 2.0 | 1159 | $3,150 | $2.72 | 45d | 1 | 0.52mi |
| 2577 Sycamore Dr La Verne, CA | 3.0 | 2.0 | 1350 | $2,895 | $2.14 | 45d | 1 | 0.67mi |
| 2644 Sycamore Dr La Verne, CA | 3.0 | 2.5 | 1825 | $4,100 | $2.25 | 0d | 1 | 0.73mi |
| 235 W Grove St Pomona, CA | 1.0–2.0 | 1.0–2.0 | 800 | $2,576 | $3.22 | 0d | 9 | 1.11mi |
| 2935 Gayridge St Pomona, CA | 3.0 | 2.0 | 1507 | $3,595 | $2.39 | 3d | 1 | 1.23mi |
| 2958 Gramercy St Pomona, CA | 3.0 | 2.0 | 1364 | $3,350 | $2.46 | 7d | 1 | 1.29mi |
| 2963 Glencrest St Pomona, CA | 3.0 | 2.0 | 1546 | $3,595 | $2.33 | 0d | 1 | 1.29mi |
| 2109 N White Ave La Verne, CA | 3.0 | 4.0 | 1911 | $3,975 | $2.08 | 45d | 1 | 1.32mi |
| 3636 Sumner Ave #210 Pomona, CA | 2.0 | 2.0 | 1290 | $2,400 | $1.86 | 7d | 1 | 1.39mi |
Listing history 8 events
-
2026-06-21days on market $185,000 Active 13 DOM
-
2026-06-18days on market $185,000 Active 10 DOM
-
2026-06-17days on market $185,000 Active 9 DOM
-
2026-06-16days on market $185,000 Active 8 DOM
-
2026-06-15days on market $185,000 Active 7 DOM
-
2026-06-13days on market $185,000 Active 5 DOM
-
2026-06-13days on market $185,000 Active 4 DOM
-
2026-06-09$185,000 Active 1 DOM
ⓘ Source: listings_history table (triggers on properties + properties_extension) + one-shot
backfill from property_details.listing_events for pre-trigger history.
Climate risk First Street
- Flood 1/10 Low FEMA zone X (unshaded) · 0% chance over 30 yrs
- Wildfire 3/10 Moderate
- Heat 7/10 Severe 7 d/yr ≥98°F today · 19 d/yr by 30 yrs out
- Wind 1/10 Low
- Air quality 8/10 Severe 17 unhealthy d/yr today · 21 by 30 yrs out
Nearby sold comps map
Loading sold comps map…
Walkable amenities ~0.75 mi
Loading nearby amenities…
Taxation est. · year 1
- Rental income
- $41,139
- − Mortgage interest
- −$10,363
- − Property taxes
- −$2,775
- − Insurance
- −$925
- − Repairs & maintenance
- −$3,291
- − Management
- −$3,291
- − Depreciation
- −$5,382
- Taxable income
- $15,112
- Est. tax owed @ 24.0%
- −$3,627
- After-tax cash flow
- $13,531/yr
For passive investors: Depreciation is non-cash, so a rental often shows a tax loss while cash-flowing — sheltering income. Rental losses are passive: they offset passive income freely, and up to $25,000/yr can offset ordinary (W-2) income if you actively participate and your MAGI is under $100k (phasing out to $0 by $150k); unused losses carry forward. On sale, claimed depreciation is recaptured at up to 25%, and gains may owe capital-gains tax (a 1031 exchange can defer both). Figures are a year-1 estimate at your 24.0% rate — not tax advice; consult a CPA.
Condition & rehab AI · 12 photos
This mobile home is in good condition with recent cosmetic updates, making it a solid investment opportunity.
Value-add opportunities
- Resale paint exterior — enhances curb appeal
- Both update flooring — improves both resale and rental value
- Both update kitchen appliances — modernizes kitchen and improves rental value
Renovation cost estimate screening
Value-add ROI direction
- Resale paint exterior — enhances curb appeal ↑
- Both update flooring — improves both resale and rental value ↑
- Both update kitchen appliances — modernizes kitchen and improves rental value ↑
ⓘ Cost ranges are severity-bucket heuristics (US national rule-of-thumb). Get contractor quotes + a written scope before underwriting a rehab budget.
Schools (NCES district)
- District
- Bonita Unified
- NCES district ID
- 0605610
- Math proficiency
- 59% ▲ 3.00%
- Reading proficiency
- 70% ▬ 0.00%
- Median HH income
- $76,196
- Composite
- 58.71/100
- National rank
- #2001
- State rank
- #151 of 1400 in CA
Livability — La Verne
- Score
- 75/100
- State rank
- #110
- US rank
- #3858
Category grades
Schools grade is shown separately in the Schools card above.
Census & demographics
- Census place
- La Verne, CA
- County
- Los Angeles County · 9,444,647 people
- City population
- 32,692
- Metro
- Los Angeles-Long Beach-Anaheim, CA
- Population (ZIP)
- 32,692
- Household income
- $104,195
- Rent vs Own
- Severe rent burden
- 872.0
Population outlook (Los Angeles County) Hauer SSP2
- Today (2025)
- 10,940,515 people
- By 2030
- 11,256,481 · +2.9%
- By 2040
- 11,729,929 · +7.2%
- By 2050
- 11,948,407 · +9.2%
- By 2075
- 11,818,114 · +8.0%
- By 2100
- 10,842,928 · -0.9%
Race, ethnicity, and origin ACS 2023
- Neighborhood character
- Diverse neighborhood (Simpson 0.67)
- Race & ethnicity
- White 44% Hispanic / Latino 36% Two or more races 20% Asian 10% Black 4%
- Hispanic origin (detail)
- Mexican 31%
- Common ancestry
- Lithuanian 3% Slovak 2% Romanian 1%
- Foreign-born
- 17% · Canada, China, South Korea
- Languages at home
- 75% English-only · Spanish 12% Chinese 3% Other Indo-European 3%
Political lean MEDSL · Los Angeles
- 2024 margin
- Solid D (+32.9) · D 64.8% · R 31.9% · Other 3.3%
- 2008→2024 swing
- -7.4pp toward R · 2008: 40.4pp · 2024: 32.9pp
- All cycles
- 2024: D+32.9 2020: D+44.2 2016: D+48.0 2012: D+40.0 2008: D+40.4
Not yet ingested
- Civics
- —
Market trends
- HPI YoY
- ▼ -729.79%
- Current HPI
- 373.7761
- Rent YoY
- ▲ 2.35%
- Metro
- Los Angeles-Long Beach-Anaheim, CA
- State GDP YoY
- ▲ 3.21%
- F500 in state
- 116
Industry mix (Fortune 500 HQ in CA)
| Industry | F500 HQs | Revenue |
|---|---|---|
| Technology | 27 | $1,492B |
|
||
| Financial Services | 3 | $174B |
|
||
| Retail | 3 | $44B |
|
||
| Insurance | 3 | $26B |
|
||
| Media / Entertainment | 2 | $115B |
|
||
| Pharmaceuticals / Biotech | 2 | $62B |
|
||
Price history
+8.9% since first listed4 events — show timeline
- 2026-06-08 Listed $185,000 CRMLS
- 2021-05-14 Sold (MLS) $167,000 CRMLS
- 2021-03-30 Pending — CRMLS
- 2021-03-05 Listed $169,900 CRMLS
Cash-flow waterfall
monthlySold comps — $/sqft
last 12 mo · ≤1 miLoading sold comps…