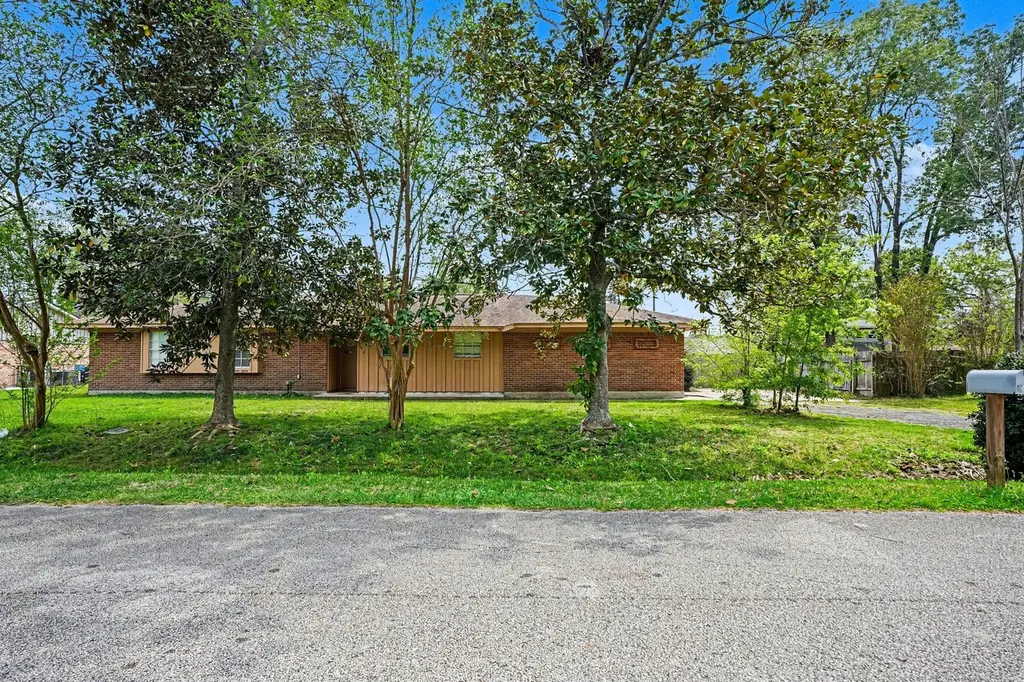
722 N Fall Creek Dr · Houston, TX
Flood risk 1/10 · Minimal
- FEMA flood zone
- X (unshaded)
- Chance of flooding over 30 yrs
- 0.0%
- Est. flood insurance / yr
- $507 – $1,088
Fire risk 1/10 · Minimal
- Est. fire insurance / yr
- $1,222 – $2,270
Heat risk 9/10 · Severe
- Hot days now (above 112°F)
- 7 days/yr
- Hot days in 30 yrs
- 25 days/yr
Wind risk 9/10 · Severe
- Chance of severe wind over 30 yrs
- 99.0%
Air-quality risk 2/10 · Minimal
- Unhealthy air days now
- 2 days/yr
- Unhealthy air days in 30 yrs
- 2 days/yr
Risk factors via First Street. Map © Google.
Why this score? — see what drove the C- grade
The composite is a weighted blend of 9 inputs, each scored 0–100. Each bar is that input's sub-score; the figure is the points it added to the 100-point composite (weight × sub-score).
- Cash flow +18.6/30.0
- ARV discount +11.7/15.0
- DSCR +5.8/10.0
- 1% rule +5.5/10.0
- Livability +3.7/5.0
- Schools +3.1/10.0
- Rent growth +2.5/5.0
- Condition / age +2.5/5.0
- Appreciation +0.7/10.0
$194,900
🖨 Deal sheet 📄 Offer letter ✓ Due diligence
Listing remarks MLS
This move-in ready three-bedroom, two-bathroom home is located in the Lakewood Heights Sec 03 R/P community. The interior features a spacious layout highlighted by tall ceilings in the living room, creating an airy and inviting atmosphere. The updated kitchen serves as a central hub, boasting granite countertops and stainless steel appliances. Designed for modern living, the floorplan offers a seamless flow throughout the primary living areas. Step outside to find a fully fenced-in backyard, providing a private space for outdoor activities and gardening. Ideally situated for convenience, this home offers easy access to Lake Houston, major roadways, and a variety of local shopping and dining options. Schedule your private showing today!
Key facts
- 0.3 acre lot
- Garage
- Built 1965
Neighborhood map
What this means for you Summary
Snapshot
- This is a 3-bed/2.0-bath single-family listed at $195k.
Deal economics
- At list price, monthly cash flow is $187 ($2k/yr) — positive.
- The deal already cash-flows at list — no discount required.
- Meets the 1% rule at list price ($2k rent vs $195k).
- Recommended offer: $183k (6.0% below list) — sets the bar for market timing.
- Cap rate 7.4% vs local median 3.2% in Houston — top-decile yield for the area; either an underpriced asset or a hidden risk that comps aren't pricing in. Stress-test before assuming the spread holds.
Location & tenants
- Location reads 74/100 on livability (#184 in TX, #4,771 nationally) — a middle-class / working-renter tenant base. Strengths: amenities A+, cost of living A+, housing A+; Watch: schools D, crime F.
- Huffman ISD (rural): math 32% / reading 35% proficiency, ranked #500 of 826 in TX (top 60%) — families likely to look elsewhere, expect single-tenant / working-renter base with shorter leases.
- Market conditions: 585 active listings in the ZIP; 7 comparable units currently listed for rent nearby; rentals lingering (median 44d on market — plan ~5-8 weeks vacancy on turnover, expect pricing pressure); 71% of comp listings sitting > 30 days — soft ceiling on asking rent; solid renter incomes; 29,883 units permitted in Harris County in 2024 (8,621 in 5+ unit buildings).
Forward outlook
- Local home prices are declining (-3.0%/yr); year-one equity from $1k of loan paydown is wiped out by about $6k of value loss. Plan a longer hold.
- Harris County population projected at +47% by 2050 — long-run rental-demand tailwind backs the buy-and-hold thesis.
Negotiation context
- It's been on market 84 days — a 6% lower offer ($183k) is reasonable based on typical stale-listing flexibility.
- 2 sale attempts since 5y ago; this cycle's ask has dropped $15k (7%) from the opening price — seller is motivated, your offer sets the floor, not the list.
- Current owner paid $56k; list at $195k implies a 248% gain — meaningful room to come down on a strong offer.
Risks & watch-outs
- Climate carrying-cost: severe wind risk, 99% chance of damaging wind over 30y; extreme-heat days projected 7→25/yr by 2055 (HVAC capex compounding) — expect insurance premiums to compound above CPI over the hold.
Questions for the listing agent
- It's been on market 84 days. Have you received any prior offers? Is the seller open to a 6% concession, seller financing, or rate buy-down credit?
- Built in 1965 — when were the roof, HVAC, electrical panel, plumbing, and water heater last replaced?
- What does the HOA fee cover, when was the last increase, and are there any pending special assessments or reserve-fund shortfalls?
- Why hasn't it sold? Are there any deal-killer items the seller is aware of (foundation, flood, title, zoning, code violations)?
- Is there a deadline driving the sale (1031 exchange, divorce, estate, relocation)? That informs how much negotiation room exists.
- Schools are D-rated, which usually means shorter tenancies and higher turnover. Who's the typical renter profile here, and what's been the actual vacancy rate?
- Crime grade is F in this area — have there been break-ins, vandalism, or insurance claims at this property in the last 3 years? What carrier currently insures it and at what premium?
- What's the average days-on-market for RENTAL listings here right now (not sales)? A rising rental-DOM trend means longer vacancies and softer asking-rent achievability than the comps imply.
- What's the recent tenant-quality profile in this submarket — average credit score on applications, eviction rate, late-payment / NSF rate, and stable-employment percentage? A property-management company in the area should have these aggregated.
- How much new for-sale + rental construction is in the pipeline within 1–3 miles? Heavy new supply typically softens prices + rents 12–24 months out; constrained supply supports both.
Investment metrics
- 1% rule
- 1.05% ✓
- Cap rate
- 7.45%
- Cash-on-cash
- 4.12%
- DSCR
- 1.18
- GRM
- 8.0
CMA / ARV
- ARV (median comp)
- $214,878
- List price
- $194,900
- Delta
- -9.30%
- Verdict
- FAIR
- Comps
- 20 within 1.0 mi
Show comp detail 12 sales within ~0.75 mi
| Address | Dist | Beds/Ba | Sqft | Sold | Price | $/sf | Match |
|---|---|---|---|---|---|---|---|
| 24034 E Lake Houston Pkwy | 0.17mi | 3/2.0 | 1,558 (-3%) | 4mo | $255,999 | $164 | 83 |
| 730 Broad Ripple Dr | 0.07mi | 3/2.0 | 1,720 (+7%) | 7mo | $195,000 | $113 | 80 |
| 24226 Whitesail Dr | 0.42mi | 3/2.0 | 1,594 (-1%) | 7mo | $249,000 | $156 | 72 |
| 24402 Lightwoods Dr | 0.62mi | 3/2.0 | 1,607 (-0%) | 3mo | $254,900 | $159 | 68 |
| 331 Cherry Valley Dr | 0.45mi | 3/2.0 | 1,495 (-7%) | 2mo | $185,000 | $124 | 65 |
| 24414 Whitesail Dr | 0.61mi | 3/2.0 | 1,663 (+3%) | 3mo | $193,200 | $116 | 64 |
| 513 Emerald Thicket Ln | 0.65mi | 3/2.5 | 1,647 (+2%) | 1mo | $249,990 | $152 | 63 |
| 24712 Stablewood Forest Ct | 0.68mi | 3/2.5 | 1,556 (-3%) | 0mo | $180,000 | $116 | 60 |
| 24705 Sonora Crescent Cir | 0.64mi | 3/2.0 | 1,689 (+5%) | 3mo | $288,990 | $171 | 60 |
| 24708 Sonora Crescent Cir | 0.63mi | 3/2.0 | 1,689 (+5%) | 8mo | $286,990 | $170 | 56 |
| 231 Loon River Dr | 0.55mi | 3/2.0 | 1,833 (+14%) | 3mo | $314,900 | $172 | 49 |
| 24702 Stablewood Frst | 0.67mi | 3/3.0 | 1,774 (+10%) | 2mo | $254,990 | $144 | 46 |
Match score weights: distance 35% · size 25% · config 20% · recency 20%. Top-matched comps best support the ARV.
Projected returns pro-forma
-3.0% appreciation · 3.0% rent growth · sell at horizon
- IRR
- -9.8%
- Equity multiple
- 0.64×
- Total profit
- $-19,577
- Equity at exit
- $29,060
- IRR
- -0.4%
- Equity multiple
- 0.97×
- Total profit
- $-1,376
- Equity at exit
- $16,851
Cash invested: $54,572 (down + closing). Projections, not guarantees.
Landlord ↔ Tenant lean methodology
- Overall (STATE)
- 87 Strongly Landlord-Friendly
- State Texas
- 87 Strongly Landlord-Friendly · R+5
- County
- — inherits STATE
- City
- — inherits STATE
ZIP-level market 77336
- Home prices YoY
- -1.8%
- Active inventory
- 585
- Price-to-rent
- 8.0×
Monthly cashflow live
- Estimated rent
- $2,037 high interval (Pro) →
- Mortgage (P&I)
- −$1,022
- Tax from tax record
- −$294 /mo · $3,523/yr
- Insurance
- −$81
- HOA
- −$25
- Vacancy / Maint / Mgmt
- −$428
- Net cashflow
- $187
Break-even live
UW: 25.0% down · 7.5% · 30yr · 1.5% tax · 5.0% vac · 8.0% maint · 8.0% mgmt
Financing live
Cash to close
- Down payment
- $48,725
- Closing costs
- $5,847
- Reserves months
- —
- Total cash needed
- —
Loan-product check · same deal, 3 products live
Conventional
25% down · 7.5% · 30yr
- Down + closing
- —
- Monthly P&I
- —
- Monthly cashflow
- —
- DSCR
- —
- Eligible?
- —
Personal DTI + credit; lowest rate.
DSCR
20% down · 8.5% · 30yr
- Down + closing
- —
- Monthly P&I
- —
- Monthly cashflow
- —
- DSCR
- —
- Eligible?
- —
No personal income docs; deal must DSCR.
Hard money
10% down · 12.0% · 12mo
- Down + closing
- —
- Monthly P&I
- —
- Monthly cashflow
- —
- DSCR
- —
- Eligible?
- —
Short-term bridge; refi at stabilization.
Rent comps 7 comps
| Address | Beds | Baths | Sqft | Rent | $/sqft | DOM | Units | Dist |
|---|---|---|---|---|---|---|---|---|
| 24118 Grey Fox Dr Huffman, TX | 3.0 | 2.0 | 1543 | $1,425 | $0.92 | 43d | 1 | 0.39mi |
| 24730 Russet Bluff Trl Huffman, TX | 4.0 | 2.0 | 1604 | $2,150 | $1.34 | 1d | 1 | 0.58mi |
| 24719 Colony Meadow Trl Huffman, TX | 4.0 | 2.0 | 1613 | $2,200 | $1.36 | 43d | 1 | 0.58mi |
| 408 Emerald Thicket Ln Huffman, TX | 3.0 | 2.5 | 1755 | $2,200 | $1.25 | 43d | 1 | 0.67mi |
| 24523 Whitesail Dr Huffman, TX | 3.0 | 2.0 | 1512 | $1,800 | $1.19 | 43d | 1 | 0.74mi |
| 24527 Lightwoods Dr Huffman, TX | 4.0 | 2.0 | 2095 | $2,100 | $1.00 | 43d | 1 | 0.84mi |
| 22423 Woodlake Rd Huffman, TX | 3.0 | 2.0 | 1673 | $1,935 | $1.16 | 5d | 1 | 1.45mi |
HOA detail
- Monthly dues
- $25 · $300/yr
Listing history 26 events
-
2026-06-18days on market $194,900 Active 84 DOM
-
2026-06-17days on market $194,900 Active 83 DOM
-
2026-06-16days on market $194,900 Active 82 DOM
-
2026-06-15days on market $194,900 Active 81 DOM
-
2026-06-13pricedays on market $194,900 Active 79 DOM
-
2026-06-09days on market $197,500 Active 75 DOM
-
2026-06-08days on market $197,500 Active 74 DOM
-
2026-06-07days on market $197,500 Active 73 DOM
-
2026-06-04days on market $197,500 Active 70 DOM
-
2026-06-03days on market $197,500 Active 69 DOM
-
2026-06-02days on market $197,500 Active 68 DOM
-
2026-06-01days on market $197,500 Active 67 DOM
-
2026-05-31days on market $197,500 Active 66 DOM
-
2026-05-01price $199,900 748-char remark
Show marketing remark (748 chars)
This move-in ready three-bedroom, two-bathroom home is located in the Lakewood Heights Sec 03 R/P community. The interior features a spacious layout highlighted by tall ceilings in the living room, creating an airy and inviting atmosphere. The updated kitchen serves as a central hub, boasting granite countertops and stainless steel appliances. Designed for modern living, the floorplan offers a seamless flow throughout the primary living areas. Step outside to find a fully fenced-in backyard, providing a private space for outdoor activities and gardening. Ideally situated for convenience, this home offers easy access to Lake Houston, major roadways, and a variety of local shopping and dining options. Schedule your private showing today!
-
2026-04-03price $204,900 748-char remark
Show marketing remark (748 chars)
This move-in ready three-bedroom, two-bathroom home is located in the Lakewood Heights Sec 03 R/P community. The interior features a spacious layout highlighted by tall ceilings in the living room, creating an airy and inviting atmosphere. The updated kitchen serves as a central hub, boasting granite countertops and stainless steel appliances. Designed for modern living, the floorplan offers a seamless flow throughout the primary living areas. Step outside to find a fully fenced-in backyard, providing a private space for outdoor activities and gardening. Ideally situated for convenience, this home offers easy access to Lake Houston, major roadways, and a variety of local shopping and dining options. Schedule your private showing today!
-
2026-03-26$209,900 Active 748-char remark
Show marketing remark (748 chars)
This move-in ready three-bedroom, two-bathroom home is located in the Lakewood Heights Sec 03 R/P community. The interior features a spacious layout highlighted by tall ceilings in the living room, creating an airy and inviting atmosphere. The updated kitchen serves as a central hub, boasting granite countertops and stainless steel appliances. Designed for modern living, the floorplan offers a seamless flow throughout the primary living areas. Step outside to find a fully fenced-in backyard, providing a private space for outdoor activities and gardening. Ideally situated for convenience, this home offers easy access to Lake Houston, major roadways, and a variety of local shopping and dining options. Schedule your private showing today!
-
2022-03-13price $1,475
-
2021-09-02soldstatus
-
2021-08-31soldstatus Sold 349-char remark
Show marketing remark (349 chars)
Welcome to this cozy home in Lakewood Heights and ready for your own personal touch to make this home!! There is also a covered back patio and plenty of space in the fully fenced yard. This home is situated on Lake Houston and offers a boat ramp and private parks. Don't wait any longer and make your appointment today!!!! No showings until 7/4/21
-
2021-07-20status Pending 349-char remark
Show marketing remark (349 chars)
Welcome to this cozy home in Lakewood Heights and ready for your own personal touch to make this home!! There is also a covered back patio and plenty of space in the fully fenced yard. This home is situated on Lake Houston and offers a boat ramp and private parks. Don't wait any longer and make your appointment today!!!! No showings until 7/4/21
-
2021-07-09status Option Pending 349-char remark
Show marketing remark (349 chars)
Welcome to this cozy home in Lakewood Heights and ready for your own personal touch to make this home!! There is also a covered back patio and plenty of space in the fully fenced yard. This home is situated on Lake Houston and offers a boat ramp and private parks. Don't wait any longer and make your appointment today!!!! No showings until 7/4/21
-
2021-07-02$160,000 Active 349-char remark
Show marketing remark (349 chars)
Welcome to this cozy home in Lakewood Heights and ready for your own personal touch to make this home!! There is also a covered back patio and plenty of space in the fully fenced yard. This home is situated on Lake Houston and offers a boat ramp and private parks. Don't wait any longer and make your appointment today!!!! No showings until 7/4/21
-
2002-08-27soldstatus
-
1998-08-26soldstatus
-
1997-10-02soldstatus
-
1997-09-01soldstatus $56,000
ⓘ Source: listings_history table (triggers on properties + properties_extension) + one-shot
backfill from property_details.listing_events for pre-trigger history.
Tax reassessment forecast TX · Resets to sale price
- Current annual tax
- $3,523 · $294/mo
- Projected year-2 tax
- $3,567 · $297/mo
- Expected delta
- +$43/yr (+$4/mo · 1.2%)
ⓘ Screening estimate from a state-policy table — verify with the county assessor before closing.
Climate risk First Street
- Flood 1/10 Low FEMA zone X (unshaded) · 0% chance over 30 yrs
- Wildfire 1/10 Low
- Heat 9/10 Extreme 7 d/yr ≥112°F today · 25 d/yr by 30 yrs out
- Wind 9/10 Extreme 99% chance of damaging wind over 30 yrs
- Air quality 2/10 Low 2 unhealthy d/yr today · 2 by 30 yrs out
Nearby sold comps map
Loading sold comps map…
Walkable amenities ~0.75 mi
Loading nearby amenities…
Taxation est. · year 1
- Rental income
- $24,443
- − Mortgage interest
- −$10,917
- − Property taxes
- −$3,523
- − Insurance
- −$974
- − Repairs & maintenance
- −$1,955
- − Management
- −$1,955
- − HOA
- −$300
- − Depreciation
- −$5,670
- Taxable loss
- −$853
- Est. tax savings @ 24.0%
- +$205
- After-tax cash flow
- $2,452/yr
For passive investors: Depreciation is non-cash, so a rental often shows a tax loss while cash-flowing — sheltering income. Rental losses are passive: they offset passive income freely, and up to $25,000/yr can offset ordinary (W-2) income if you actively participate and your MAGI is under $100k (phasing out to $0 by $150k); unused losses carry forward. On sale, claimed depreciation is recaptured at up to 25%, and gains may owe capital-gains tax (a 1031 exchange can defer both). Figures are a year-1 estimate at your 24.0% rate — not tax advice; consult a CPA.
Schools (NCES district)
- District
- Huffman ISD
- NCES district ID
- 4823820
- Math proficiency
- 32% ▼ -9.00%
- Reading proficiency
- 35% ▼ -9.00%
- Median HH income
- $65,848
- Composite
- 30.61/100
- National rank
- #6195
- State rank
- #500 of 826 in TX
Livability — Houston
- Score
- 74/100
- State rank
- #184
- US rank
- #4771
Category grades
Schools grade is shown separately in the Schools card above.
Census & demographics
- Census place
- Houston, TX
- County
- Harris County · 4,702,590 people
- City population
- 3,226,434
- Metro
- Houston-The Woodlands-Sugar Land, TX
- Population (ZIP)
- 14,342
- Household income
- $96,404
- Rent vs Own
- Severe rent burden
- 377.0
Population outlook (Harris County) Hauer SSP2
- Today (2025)
- 5,571,493 people
- By 2030
- 6,089,821 · +9.3%
- By 2040
- 7,142,806 · +28.2%
- By 2050
- 8,185,864 · +46.9%
- By 2075
- 10,574,329 · +89.8%
- By 2100
- 12,109,958 · +117.4%
Race, ethnicity, and origin ACS 2023
- Neighborhood character
- Majority White (65%)
- Race & ethnicity
- White 65% Hispanic / Latino 23% Two or more races 9% Black 5% Native American 4%
- Hispanic origin (detail)
- Mexican 20%
- Common ancestry
- Lithuanian 4% Slovak 2% Romanian 2%
- Foreign-born
- 9% · Canada
- Languages at home
- 79% English-only · Spanish 18% Other Indo-European 2%
Political lean MEDSL · Harris
- 2024 margin
- Lean D (+5.5) · D 52.0% · R 46.4% · Other 1.6%
- 2008→2024 swing
- +3.9pp toward D · 2008: 1.6pp · 2024: 5.5pp
- All cycles
- 2024: D+5.5 2020: D+13.3 2016: D+12.4 2012: D+0.1 2008: D+1.6
Not yet ingested
- Civics
- —
Market trends
- HPI YoY
- ▼ -8.59%
- Current HPI
- 472.03
- Rent YoY
- —
- Metro
- Houston-The Woodlands-Sugar Land, TX
- State GDP YoY
- ▲ 3.95%
- F500 in state
- 110
Industry mix (Fortune 500 HQ in TX)
| Industry | F500 HQs | Revenue |
|---|---|---|
| Energy | 16 | $1,198B |
|
||
| Technology | 5 | $198B |
|
||
| Engineering / Construction | 4 | $72B |
|
||
| Energy Services | 3 | $60B |
|
||
| Utilities | 3 | $41B |
|
||
| Healthcare | 2 | $330B |
|
||
Price history
+257.0% since first listed13 events — show timeline
- 2026-05-01 Price Changed $199,900 HARMLS
- 2026-04-03 Price Changed $204,900 HARMLS
- 2026-03-26 Listed $209,900 HARMLS
- 2022-03-13 Price Changed $1,475 RENT.
- 2021-09-02 Sold (Public Records) — Public Records
- 2021-08-31 Sold (MLS) — HARMLS
- 2021-07-20 Pending — HARMLS
- 2021-07-09 Pending — HARMLS
- 2021-07-02 Listed $160,000 HARMLS
- 2002-08-27 Sold (Public Records) — Public Records
- 1998-08-26 Sold (Public Records) — Public Records
- 1997-10-02 Sold (Public Records) — Public Records
- 1997-09-01 Sold (Public Records) $56,000 Public Records
Property tax history
+1.7%/yrLatest (2025): $3,523 · -9.5% YoY. Source: county tax records.
Cash-flow waterfall
monthlySold comps — $/sqft
last 12 mo · ≤1 miLoading sold comps…