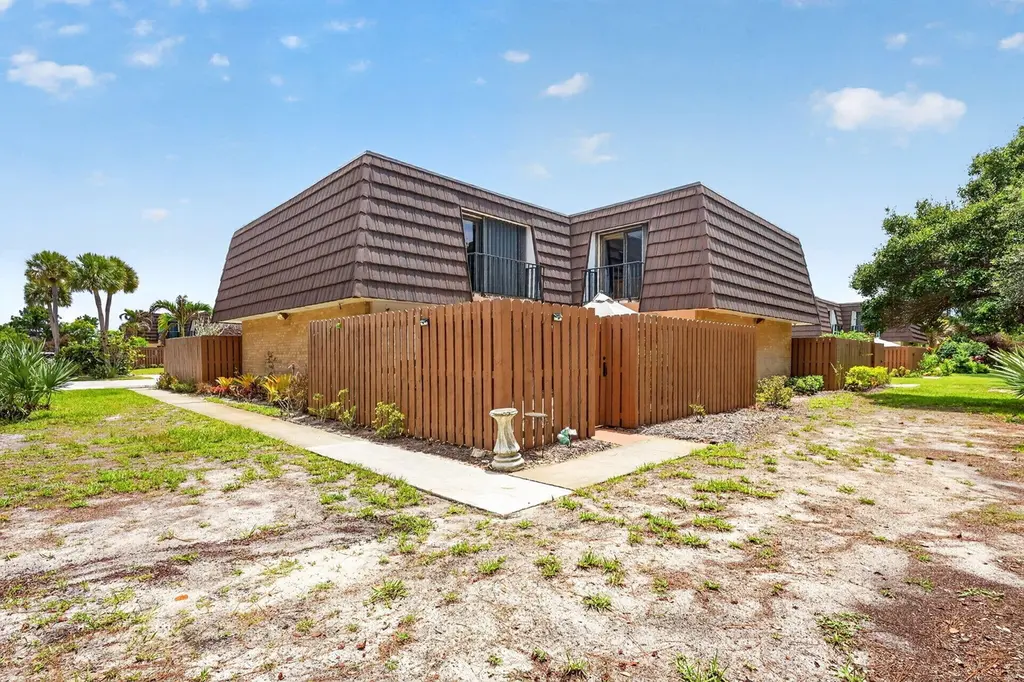
5706 SE Riverboat Dr #202 · Port Salerno, FL
Flood risk 1/10 · Minimal
- FEMA flood zone
- X (unshaded)
- Chance of flooding over 30 yrs
- 0.0%
- Est. flood insurance / yr
- $507 – $1,088
Fire risk 2/10 · Minimal
- Est. fire insurance / yr
- $947 – $1,759
Heat risk 10/10 · Severe
- Hot days now (above 106°F)
- 7 days/yr
- Hot days in 30 yrs
- 24 days/yr
Wind risk 10/10 · Severe
- Chance of severe wind over 30 yrs
- 99.0%
Air-quality risk 2/10 · Minimal
- Unhealthy air days now
- 1 days/yr
- Unhealthy air days in 30 yrs
- 1 days/yr
Risk factors via First Street. Map © Google.
Why this score? — see what drove the D grade
The composite is a weighted blend of 9 inputs, each scored 0–100. Each bar is that input's sub-score; the figure is the points it added to the 100-point composite (weight × sub-score).
- Cash flow +11.4/30.0
- ARV discount +7.9/15.0
- 1% rule +5.6/10.0
- Schools +4.5/10.0
- Livability +3.5/5.0
- DSCR +3.3/10.0
- Rent growth +3.2/5.0
- Condition / age +2.5/5.0
- Appreciation +0.0/10.0
$230,000
🖨 Deal sheet (PDF) 📄 Offer letter ✓ Due diligence
Listing remarks
Light and bright 2 bed, 2.5 bath townhouse in desirable River Pines community in Stuart. Corner end unit offers privacy, no rear neighbors, and peaceful natural surroundings. Updated kitchen features granite countertops, stainless steel appliances, and ample cabinet space, ideal for everyday living and entertaining. Hardwood flooring throughout. Fully fenced private patio with outdoor storage shed and two walk-out balconies. River Pines offers resort style amenities including two swimming pools, tennis, and pickleball courts, plus a private boardwalk to the water. Located near top-rated schools, shopping, dining, and just minutes from beaches and downtown Stuart. Schedule your private tour
Key facts
- Private boardwalk
- Updated kitchen
- Outdoor storage shed
Tags
Property features AI
Finance
- Financial info: Pets allowed (cats and dogs allowed; number limits apply)
- HOA & community: River Pines Homeowners Association; Monthly HOA fee; Association amenities include beach access, pool, fishing pier, parking, handball, pickleball courts, and street lights; HOA fee includes cable TV, insurance, maintenance of structure, trash, common areas, common real estate tax, reserve funds, roof repairs, and pool service
Exterior
- Parking: Assigned and guest parking on asphalt; 2 open parking spaces (2 total parking)
- Utilities: Public water; Public sewer; Water and sewer available
- Home design: Townhouse; Two stories; Resale property; Facing west; East of US-1 frontage
- Construction: Stucco and CBS construction; Block foundation; Flat and mansard roof
- Exterior features: Open patio/terrace; Patio; Shed(s); Fenced yard with wood fencing; Sidewalks; Paved road
Interior
- Kitchen: Dishwasher; Electric range; Microwave; Garbage disposal; Electric water heater
- Bedrooms: No main-level bedrooms (upper-level bedrooms present)
- Flooring: Carpet; Laminate; Tile; Wood
- Bathrooms: 2 full bathrooms; 1 half bathroom; 1 main-level bathroom
- Heating & cooling: Central heating; Central air; Ceiling fans
- Interior features: Walk-in closets; Upstairs living area; Blinds and drapes
- Laundry & utility: In-unit laundry; Washer hookup; Electric dryer hookup; Laundry closet; Laundry located on main level and in bathroom
Neighborhood map
What this means for you Summary
Snapshot
- This is a 2-bed/2.5-bath townhouse listed at $230k.
Deal economics
- At list price, monthly cash flow is $-79 ($-951/yr) — negative.
- To cash-flow at today's rent, offer at most $219k (5.0% below list).
- Meets the 1% rule at list price ($2k rent vs $230k).
- Recommended offer: $219k (5.0% below list) — sets the bar for cash-flow.
- Cap rate 5.9% vs local median 3.2% in Port Salerno — top-decile yield for the area; either an underpriced asset or a hidden risk that comps aren't pricing in. Stress-test before assuming the spread holds.
Location & tenants
- Location reads 70/100 on livability (#440 in FL) — a middle-class / working-renter tenant base. Strengths: housing A+, crime A, health & safety A; Watch: amenities F, commute F.
- Martin (suburban): math 52% / reading 53% proficiency, ranked #24 of 73 in FL (top 33%) — acceptable for families but not a draw, mixed tenant base, ~2y average lease.
- Zoned schools: Murray Middle School (math 45% / reading 43%, grade D, #327 of 571 statewide, top 57%, 616 students, 69% FRL); South Fork High School (math 36% / reading 48%, grade F, #275 of 667 statewide, top 42%, 1,810 students, 51% FRL) — zoned schools average 60% FRL vs 41% district-wide (19 pts higher); higher-poverty schools than district average — tighter screening recommended.
- Market conditions: Rents rising (+2.7%/yr); 595 active listings in the ZIP; 30 comparable units currently listed for rent nearby; rentals at typical pace (median 25d on market — plan ~3-4 weeks tenant-placement turnaround); solid renter incomes; 737 units permitted in Martin County in 2024 (167 in 5+ unit buildings).
- This rent runs 37% of the median local income ($78k/yr) — at the standard rent-burdened threshold; future hikes will face affordability resistance.
Forward outlook
- Local home prices are declining (-3.0%/yr); year-one equity from $2k of loan paydown is wiped out by about $7k of value loss. Plan a longer hold.
- Martin County population projected at +19% by 2050 — long-run rental-demand tailwind backs the buy-and-hold thesis.
Negotiation context
- Only 9 days on market — expect competitive offers; lowballing is unlikely to land.
- 2 sale attempts since 21y ago with the ask held roughly flat each time — persistent listings suggest the price (not the market) is what's stuck; bring a comps-based counter.
Risks & watch-outs
- Climate carrying-cost: severe wind risk, 99% chance of damaging wind over 30y; extreme-heat days projected 7→24/yr by 2055 (HVAC capex compounding) — expect insurance premiums to compound above CPI over the hold.
Questions for the listing agent
- What do current leases actually rent for vs. the listed asking? Can we see a recent rent roll and the last 12 months of T-12 income?
- What does the HOA fee cover, when was the last increase, and are there any pending special assessments or reserve-fund shortfalls?
- Is there a deadline driving the sale (1031 exchange, divorce, estate, relocation)? That informs how much negotiation room exists.
- Schools are D-rated, which usually means shorter tenancies and higher turnover. Who's the typical renter profile here, and what's been the actual vacancy rate?
- The area grade is low — what's the realistic commute time and amenity access for the typical tenant pool here? Any planned neighborhood developments (good or bad) we should know about?
- What's the average days-on-market for RENTAL listings here right now (not sales)? A rising rental-DOM trend means longer vacancies and softer asking-rent achievability than the comps imply.
- What's the recent tenant-quality profile in this submarket — average credit score on applications, eviction rate, late-payment / NSF rate, and stable-employment percentage? A property-management company in the area should have these aggregated.
- How much new for-sale + rental construction is in the pipeline within 1–3 miles? Heavy new supply typically softens prices + rents 12–24 months out; constrained supply supports both.
Investment metrics
- 1% rule
- 1.06% ✓
- Cap rate
- 5.88%
- Cash-on-cash
- -1.48%
- DSCR
- 0.93
- GRM
- 7.9
CMA / ARV
- ARV (on-the-fly)
- $231,840
- Comps found
- 12
Show comp detail 12 sales within ~0.75 mi
| Address | Dist | Beds/Ba | Sqft | Sold | Price | $/sf | Match |
|---|---|---|---|---|---|---|---|
| 5802 SE Riverboat Dr #301 | 0.09mi | 2/2.5 | 1,288 (0%) | 1mo | $220,000 | $171 | 95 |
| 5805 SE Riverboat Dr #407 | 0.13mi | 2/2.5 | 1,288 (0%) | 2mo | $260,000 | $202 | 92 |
| 6061 SE Riverboat Dr #825 | 0.36mi | 2/2.5 | 1,288 (0%) | 1mo | $270,000 | $210 | 82 |
| 6068 SE Riverboat Dr #728 | 0.42mi | 2/2.5 | 1,288 (0%) | 2mo | $249,000 | $193 | 79 |
| 5335 SE Miles Grant Rd Unit H 209 | 0.32mi | 2/2.0 | 1,250 (-3%) | 2mo | $220,000 | $176 | 76 |
| 5363 SE Miles Grant Rd #106 | 0.36mi | 2/2.0 | 1,250 (-3%) | 0mo | $225,000 | $180 | 76 |
| 6158 SE Riverboat Dr | 0.52mi | 2/2.5 | 1,288 (0%) | 1mo | $221,000 | $172 | 75 |
| 5335 SE Miles Grant Rd #214 | 0.33mi | 2/2.0 | 1,186 (-8%) | 1mo | $140,000 | $118 | 69 |
| 5403 SE Miles Grant Rd #209 | 0.43mi | 2/2.0 | 1,186 (-8%) | 1mo | $488,000 | $411 | 64 |
| 5403 SE Miles Grant Rd Unit H111 | 0.43mi | 2/2.0 | 1,186 (-8%) | 2mo | $210,000 | $177 | 63 |
| 5303 SE Miles Grant Rd Unit L101 | 0.40mi | 1/2.0 (-1) | 1,186 (-8%) | 2mo | $145,000 | $122 | 60 |
| 5413 SE Miles Grant Rd #205 | 0.44mi | 3/2.0 (+1) | 1,460 (+13%) | 1mo | $278,000 | $190 | 49 |
Match score weights: distance 35% · size 25% · config 20% · recency 20%. Top-matched comps best support the ARV.
Projected returns pro-forma
-3.0% appreciation · 2.71% rent growth · sell at horizon
- IRR
- -19.0%
- Equity multiple
- 0.34×
- Total profit
- $-42,734
- Equity at exit
- $34,294
- IRR
- -12.0%
- Equity multiple
- 0.29×
- Total profit
- $-45,416
- Equity at exit
- $19,886
Cash invested: $64,400 (down + closing). Projections, not guarantees.
Landlord ↔ Tenant lean methodology
- Overall (STATE)
- 87 Strongly Landlord-Friendly
- State Florida
- 87 Strongly Landlord-Friendly · R+3
- County
- — inherits STATE
- City
- — inherits STATE
ZIP-level market 34997
- Rents YoY
- 2.7%
- Active inventory
- 595
- Price-to-rent
- 7.9×
Monthly cashflow live
- Estimated rent
- $2,440 high interval (Pro) →
- Mortgage (P&I)
- −$1,206
- Tax est. 1.5%
- −$288 /mo · $3,450/yr
- Insurance
- −$96
- HOA
- −$417
- Vacancy / Maint / Mgmt
- −$512
- Net cashflow
- $-79
Break-even live
Sensitivity live
| Price | -10% $80 | -5% $0 | +0% $-79 | +5% $-159 | +10% $-238 |
|---|---|---|---|---|---|
| Rent | -10% $-272 | -5% $-176 | +0% $-79 | +5% $17 | +10% $113 |
| Rate | -1.0pp $37 | -0.5pp $-21 | base $-79 | +0.5pp $-139 | +1.0pp $-199 |
UW: 25.0% down · 7.5% · 30yr · 1.5% tax · 5.0% vac · 8.0% maint · 8.0% mgmt
Financing live
Cash to close
- Down payment
- $57,500
- Closing costs
- $6,900
- Reserves months
- —
- Total cash needed
- —
Loan-product check · same deal, 3 products live
Conventional
25% down · 7.5% · 30yr
- Down + closing
- —
- Monthly P&I
- —
- Monthly cashflow
- —
- DSCR
- —
- Eligible?
- —
Personal DTI + credit; lowest rate.
DSCR
20% down · 8.5% · 30yr
- Down + closing
- —
- Monthly P&I
- —
- Monthly cashflow
- —
- DSCR
- —
- Eligible?
- —
No personal income docs; deal must DSCR.
Hard money
10% down · 12.0% · 12mo
- Down + closing
- —
- Monthly P&I
- —
- Monthly cashflow
- —
- DSCR
- —
- Eligible?
- —
Short-term bridge; refi at stabilization.
Rent comps 30 comps
| Address | Beds | Baths | Sqft | Rent | $/sqft | DOM | Units | Dist |
|---|---|---|---|---|---|---|---|---|
| 5674 SE Riverboat Dr #131 Stuart, FL | 2.0 | 2.5 | 1288 | $2,400 | $1.86 | 23d | 1 | 0.10mi |
| 5674 SE Riverboat Dr #131 Stuart, FL | 2.0 | 2.5 | 1288 | $2,600 | $2.02 | 25d | 1 | 0.10mi |
| 6003 SE Riverboat Dr #802 Stuart, FL | 2.0 | 2.5 | 1288 | $2,200 | $1.71 | 25d | 1 | 0.33mi |
| 5403 SE Miles Grant Rd Stuart, FL | 2.0 | 2.0 | 1186 | $1,750 | $1.48 | 25d | 2 | 0.46mi |
| 6021 SE Landing Way #2 Stuart, FL | 2.0 | 2.0 | 1135 | $2,500 | $2.20 | 25d | 1 | 0.51mi |
| 6146 SE Riverboat Dr #918 Stuart, FL | 2.0 | 2.5 | 1288 | $1,950 | $1.51 | 25d | 1 | 0.52mi |
| 4621 SE Shady Ridge Ln Stuart, FL | 2.0 | 1.0 | 1660 | $2,100 | $1.27 | 15d | 1 | 0.55mi |
| 6082 SE Landing Way #7 Stuart, FL | 2.0 | 2.0 | 1135 | $3,000 | $2.64 | 25d | 1 | 0.55mi |
| 6142 SE Landing Way Unit 9-11 Stuart, FL | 2.0 | 2.0 | 1135 | $3,500 | $3.08 | 25d | 1 | 0.61mi |
| 6102 SE Landing Way #13 Stuart, FL | 3.0 | 2.0 | 1590 | $2,000 | $1.26 | 25d | 1 | 0.64mi |
| 5359 SE Dell St Stuart, FL | 3.0 | 2.0 | 1272 | $2,800 | $2.20 | 25d | 1 | 0.66mi |
| 6142 SE Landing Way #16 Stuart, FL | 2.0 | 2.0 | 1590 | $3,750 | $2.36 | 25d | 1 | 0.73mi |
| 5636 SE Foxcross Pl Stuart, FL | 2.0 | 2.0 | 1598 | $9,000 | $5.63 | 15d | 1 | 0.74mi |
| 5795 SE Mitzi Ln Stuart, FL | 3.0 | 2.0 | 1315 | $3,000 | $2.28 | 25d | 1 | 0.76mi |
| 4885 SE Capstan Ave #27 Stuart, FL | 2.0 | 2.0 | 1273 | $2,500 | $1.96 | 25d | 1 | 0.84mi |
| 4650 SE Manatee Way Stuart, FL | 3.0 | 2.5 | 1764 | $5,900 | $3.34 | 25d | 1 | 0.91mi |
| 4606 SE Binnacle Way Unit 1 Stuart, FL | 2.0 | 1.0 | 928 | $1,850 | $1.99 | 15d | 1 | 0.93mi |
| 4710 SE Glenridge Trl Stuart, FL | 3.0 | 2.0 | 1442 | $3,300 | $2.29 | 15d | 1 | 1.06mi |
| 4939 SE Salvatori Rd Stuart, FL | 3.0 | 2.0 | 1334 | $2,500 | $1.87 | 25d | 1 | 1.22mi |
| 5280 SE Seascape Way #101 Stuart, FL | 3.0 | 3.0 | 1561 | $2,500 | $1.60 | 15d | 1 | 1.25mi |
| 5300 SE Schooner Oaks Way Stuart, FL | 3.0 | 2.0 | 1600 | $3,700 | $2.31 | 25d | 1 | 1.35mi |
| 5152 SE Club Way #104 Stuart, FL | 2.0 | 2.0 | 1358 | $7,500 | $5.52 | 15d | 1 | 1.37mi |
| 5881 SE Windsong Ln Stuart, FL | 2.0 | 2.5 | 1288 | $2,100 | $1.63 | 15d | 1 | 1.40mi |
| 4421 SE Village Rd Stuart, FL | 2.0 | 2.0 | 1080 | $2,100 | $1.94 | 25d | 1 | 1.42mi |
| 6531 SE Federal Hwy Stuart, FL | 2.0 | 2.0 | 1100 | $1,725 | $1.57 | 15d | 2 | 1.42mi |
| 4107 SE Barcelona St Stuart, FL | 2.0 | 1.0 | 1224 | $2,500 | $2.04 | 25d | 1 | 1.43mi |
| 6535 SE Federal Hwy Stuart, FL | 2.0 | 2.0 | 967 | $1,750 | $1.81 | 25d | 1 | 1.47mi |
| 6551 SE Federal Hwy Stuart, FL | 2.0 | 2.0 | 969 | $1,825 | $1.88 | 23d | 2 | 1.49mi |
| 6551 SE Federal Hwy #104 Stuart, FL | 2.0 | 2.0 | 969 | $2,000 | $2.06 | 15d | 1 | 1.49mi |
| 6537 SE Federal Hwy #102 Stuart, FL | 2.0 | 2.0 | 969 | $1,845 | $1.90 | 15d | 1 | 1.49mi |
HOA detail
- Monthly dues
- $417 · $5,004/yr
- Likely covers
- waterpool
Listing history 7 events
-
2026-06-21days on market $230,000 Active 9 DOM
-
2026-06-18days on market $230,000 Active 6 DOM
-
2026-06-17days on market $230,000 Active 5 DOM
-
2026-06-16days on market $230,000 Active 4 DOM
-
2026-06-15days on market $230,000 Active 3 DOM
-
2026-06-13remarks 699-char remark
-
2026-06-13$230,000 Active 1 DOM
ⓘ Source: listings_history table (triggers on properties + properties_extension) + one-shot
backfill from property_details.listing_events for pre-trigger history.
Climate risk First Street
- Flood 1/10 Low FEMA zone X (unshaded) · 0% chance over 30 yrs
- Wildfire 2/10 Low
- Heat 10/10 Extreme 7 d/yr ≥106°F today · 24 d/yr by 30 yrs out
- Wind 10/10 Extreme 99% chance of damaging wind over 30 yrs
- Air quality 2/10 Low 1 unhealthy d/yr today · 1 by 30 yrs out
Nearby sold comps map
Loading sold comps map…
Walkable amenities ~0.75 mi
Loading nearby amenities…
Taxation est. · year 1
- Rental income
- $29,274
- − Mortgage interest
- −$12,884
- − Property taxes
- −$3,450
- − Insurance
- −$1,150
- − Repairs & maintenance
- −$2,342
- − Management
- −$2,342
- − HOA
- −$5,004
- − Depreciation
- −$6,691
- Taxable loss
- −$4,588
- Est. tax savings @ 24.0%
- +$1,101
- After-tax cash flow
- $150/yr
For passive investors: Depreciation is non-cash, so a rental often shows a tax loss while cash-flowing — sheltering income. Rental losses are passive: they offset passive income freely, and up to $25,000/yr can offset ordinary (W-2) income if you actively participate and your MAGI is under $100k (phasing out to $0 by $150k); unused losses carry forward. On sale, claimed depreciation is recaptured at up to 25%, and gains may owe capital-gains tax (a 1031 exchange can defer both). Figures are a year-1 estimate at your 24.0% rate — not tax advice; consult a CPA.
Schools (NCES district)
- District
- Martin
- NCES district ID
- 1201290
- Math proficiency
- 52% ▼ -14.00%
- Reading proficiency
- 53% ▼ -4.00%
- Median HH income
- $52,482
- Composite
- 45.1/100
- National rank
- #2690
- State rank
- #24 of 73 in FL
Livability — Port Salerno
- Score
- 70/100
- State rank
- #440
- US rank
- #7873
Category grades
Schools grade is shown separately in the Schools card above.
Census & demographics
- County
- Martin County · 165,223 people
- Metro
- Port St. Lucie, FL
- Population (ZIP)
- 47,075
- Household income
- $78,136
- Rent vs Own
- Severe rent burden
- 1323.0
Population outlook (Martin County) Hauer SSP2
- Today (2025)
- 172,383 people
- By 2030
- 180,192 · +4.5%
- By 2040
- 194,114 · +12.6%
- By 2050
- 204,992 · +18.9%
- By 2075
- 229,641 · +33.2%
- By 2100
- 232,146 · +34.7%
Race, ethnicity, and origin ACS 2023
- Neighborhood character
- Predominantly White (74%)
- Race & ethnicity
- White 74% Hispanic / Latino 19% Two or more races 9% Black 3% Asian 1%
- Hispanic origin (detail)
- Mexican 4% Puerto Rican 2% Cuban 3%
- Common ancestry
- Romanian 3% Lithuanian 3% Slovak 2%
- Foreign-born
- 14% · Canada, Jamaica, China
- Languages at home
- 81% English-only · Spanish 14% French/Haitian/Cajun 2% Other Indo-European 1%
Political lean MEDSL · Martin
- 2024 margin
- Solid R (+31.1) · D 34.1% · R 65.2%
- 2008→2024 swing
- -17.5pp toward R · 2008: -13.6pp · 2024: -31.1pp
- All cycles
- 2024: R+31.1 2020: R+24.6 2016: R+26.9 2012: R+22.9 2008: R+13.6
Not yet ingested
- Civics
- —
Market trends
- HPI YoY
- ▼ -319.78%
- Current HPI
- 336.7717
- Rent YoY
- ▲ 2.71%
- Metro
- Port St. Lucie, FL
- State GDP YoY
- ▲ 3.28%
- F500 in state
- 36
Industry mix (Fortune 500 HQ in FL)
| Industry | F500 HQs | Revenue |
|---|---|---|
| Industrial Technology | 2 | $29B |
|
||
| Insurance | 2 | $17B |
|
||
| Retail | 1 | $60B |
|
||
| Technology Distribution | 1 | $58B |
|
||
| Homebuilding | 1 | $35B |
|
||
| Technology Manufacturing | 1 | $35B |
|
||
Price history
+0.0% since first listed3 events — show timeline
- 2026-06-12 Listed $230,000 Beaches MLS
- 2016-06-26 Listing Removed — MCRTC
- 2005-10-14 Listed $229,900 MCRTC
Cash-flow waterfall
monthlySold comps — $/sqft
last 12 mo · ≤1 miLoading sold comps…